Part II
7 More advanced calculations: Odds Ratios and Relative Risk
Learning Objectives
By the end of this chapter, the learner will be able to
- Introduce the most common methods to assess risk in epidemiology: the odds ratio, and the relative risk.
- Learn how to analyze and report the odds ratio, and the relative risks as common methods of assessing risk from the results of epidemiological research studies
- Summarize the uses of odds ratio and relative risk in epidemiology.
Introduction
In this chapter, the topic of risk assessment and its related calculations is discussed. The previous chapter on study designs has been intentionally covered before risk is assessed, and that is because each study design has a more favorable statistical method or calculation that fits better and as a consequence answers the main research question proposed by the investigator. The point is that the
concepts of study designs, and risk assessment in epidemiology are intrinsically connected. For example, for case study designs, the odds ratio calculation works better compared with the relative risk that is more appropriate for the cohort study design. However, both measures of association can be used for more than one study, which is also a matter of which measure of association calculation responds better to the need of the study, and the expectations of the investigator. Even in the case of clinical trials that used commonly for therapeutic reasons, the major common measures of association discussed in this chapter are also useful. So, the principles are the same, use a risk assessment method that better fits your needs. [1]
Risk assessment – the basics: Odds Ratios and Relative Risk
One of the main reasons, epidemiology is so popular in public health, and medicine, is that it provides a platform to conduct research studies used to assess risk. A clinician may want to know what is the risk for the patient to die prematurely, or, long the patient has to live if there is a terminal disease such as cancer. The response for these questions come from epidemiological studies that had assessed the risk. The same is true for the public health practitioner, when there is a question about the risk of infectious diseases for an unvaccinated population, or, the access to health services for an underrepresented group in the community. Clinicians, and public health practitioners, both rely in epidemiology to answer their questions, and to plan health services among other interventions.
 |
| At Risk Assessment by Nick Youngson CC BY-SA 3.0 Pix4free.org |
But overall, what is risk, and what is risk assessment?
In mathematical terms, the definition of risk is, the probably that something will occur (happen) in a certain period of time.[2] It is accepted that in order to be considered valid, this probability has to be greater than one, and less than zero [3](more about this concept will be discussed later in this chapter). If we broadly had defined the concept of risk, what is risk assessment? Risk assessment is a series of techniques used to assess, or, evaluate risk. [4]It is based on the probabilities (risk), but it also includes other factors that contribute for the event to happen, these factors are also considered risk factors, which are factors associated with the health event (disease, health, etc.), but that are not necessarily the cause of the disease. [5]The cause of the disease is usually assessed using other epidemiological factors that will be also discussed later when referring to the applications of research designs in epidemiology.
 Image by Wokandapix from Pixabay Image by Wokandapix from Pixabay
|
The concept of risk and how it is measured
There are two major mathematical (or, statistical) methods used to assess (or, quantify) risk. The odds ratio, and the relative risk. Both of these methods required calculations based on the probably of the events to happen. The results are commonly called, measures of association.[6] In this manner, the results of the odds, or, the relative risk are used to assess the possible association of a risk factor in a health event (disease, or, not). [7] For this reason, in epidemiology, the most common measures of association are the odds ratio, and the relative risk.
And example can be seen during the COVID-19 pandemic as the following image presents, the odds ratios have been presented in a visual form, so, the reader interested in this information can find it easily. See image below:
 |
| “COVID-19 Odds ratios by country” Image by Hankwang, Licensed CC BY-SA 4.0 International, Wikimedia Commons. The image used here is from 2021-01-31, last updated 2021-02-14
Note: The following comments have been modified from the image website: As seen above in the graph, the odds ratio (left y axis) of B.1.1.7 versus ‘wild’ variants is [was] expected to grow exponentially; [0.076] means 7.9% growth per day. Also, as the author said: “The logarithmic slopes as indicated are not based on a rigorous uncertainty analysis.”[8]
|
Defining the concepts of Odds Ratio and Relative Risk
In order to understand these concepts (and also, for the calculation of these measures of association), there is need to review the concept of 2×2 tables first. Why? The 2×2 table assists with the visualization of the risk probabilities. A 2×2 table is called that way because it has two rows (horizontal), and two columns (vertical). By convention, the cells are filled with letters, which later will be used to create the calculation formulas. [9] A 2×2 table looks something as the following:
| a | b |
| c | d |
Later in this chapter, when the calculation formulas are presented, the totals (from the rows, and the columns) will also be visualized.
 |
| Odds by Nick Youngson CC BY-SA 3.0 Alpha Stock Images |
Odds ratio (commonly abbreviated as OR)
In general terms, the odds is the probability that an event will happen divided by the probability that it won’t happen.) One way to see (explain, visualize) this is to label, the 2×2 cells in terms of exposure, and not exposed. The layout of the table will look something as this:
| Exposed | Non-exposed | Totals |
| a | b | a+b |
| c | d | c+d |
| a+c | b+d | a+b+c+d |
Then, it can be seen that the odds ratio is a measure (calculation of the probabilities) that compares the odds of exposure to the factor of interest among cases to the odds of exposure to the factor among controls. That is one of the main reasons, the odds ratio is the most commonly used calculation to assess risk in case-control studies, in which cases are compared to those that are non-cases (controls, or, those not affected by the disease, disorder, or, any other health event).[10]
If we look at the table above and its categories, (The odds is the probability that an event will happen divided by the probability that it won’t happen.). Additional labels can be added to the 2×2 table in order to better understand, and use the formula. Now, the table looks like this:
| Exposed | Non-exposed | Totals | |
| Yes | a | b | a+b |
| No | c | d | c+d |
| a+c | b+d | a+b+c+d |
The formula for the odds ratio is:
In general terms, the categories represented with letters above in the table mean the following:
The letter ‘a’ represents the odds of = number of cases with the exposure
The letter ‘b’ represents the odds of = number of controls with the exposure
The letter ‘c’ represents the number of cases without the exposure
The letter ‘d’ represents the number of controls without the exposure
Example of how to calculate the Odds Ratio (or, OR)
A study hypothesized that smoking is associated with lung cancer. Initially, the investigators found 100 cases of lung cancer and identified 100 controls free of lung cancer from the general population, similar regarding age, sex, and socioeconomic status. At the end of the study, the entire set of numbers was released (and published), which were the following: from a total of 130 smokers, 90 of them had lung cancer.
To complete the calculation, enter first the numbers provided above, the rest of the numbers can be found by subtracting, the complete 2×2 table is shown below:
Smoking and Lung cancer
| Diseased (lung cancer) | Non-diseased | Total | |
| Exposed (smoked) | 90 | 40 | 130 |
| No exposed (no smoked) | 10 | 60 | 70 |
| Total | 100 | 100 | 200 |
To calculate the odds ratio, use the formula provided in the content before.
Based on the results of the OR and keeping in mind that an OR=1 implies no association. Answer the following questions: was the study hypothesis rejected, or accepted? Is smoking a significant risk factor for lung cancer? Answer the question based on your results of the OR.
Relative Risk (commonly abbreviated as RR)
It is important to understand what the relative risk is, especially when comparing it to the odds ratio. While the odds ratio assesses the risk or association in general, the relative risk is commonly used to assess causation. This is because it shows how much more or less likely people exposed to a factor are to develop a disease compared to those who are not exposed. Cohort studies are often used to assess causation and the results are measured using the relative risk. [11]
To calculate the relative risk (RR), we use the concept of 2×2 tables, which we have discussed earlier. We also use the concepts of exposure (or exposed) and not exposed (the values in the columns of the table). To prepare for the calculations, we need to consider the disease status as Yes and No. Below is the layout of the 2×2 table that we use to calculate the relative risk:
| Exposed | Non-exposed | Totals | |
| Yes | a | b | a+b |
| No | c | d | c+d |
| a+c | b+d | a+b+c+d |
The formula for the relative risk is:
In general terms, as we said for the odds ratio, the categories represented with letters above in the table mean the following:
The letter ‘a’ represents the odds of = number of cases with the exposure
The letter ‘b’ represents the odds of = number of controls with the exposure
The letter ‘c’ represents the number of cases without the exposure
The letter ‘d’ represents the number of controls without the exposure
Example for the calculation of the relative risk
The same information (from the table in the odds ratio example above) – numbers can be used to calculate the relative risk formula provided before.
Relative Risk (RR) = (a/a+b)/(c/c+d) = (90/130)/(10/70) =0.692 /0.142 = 4.8
Note: the results of the relative risk are more moderate (lower) than the results of the odds ratio. For most epidemiologists, this would be considered better because it does not exaggerate the results, making the results more credible.
Putting the concept into practice:
Applying the information provided by the calculation of the relative risk, and keeping in mind that an RR= 1 implies no association. Answer the following questions: was the study hypothesis rejected, or accepted? Is smoking a significant risk factor for lung cancer? Answer the question based on your results of the RR.
Key Takeaways
Applying what we had learned so far
Putting together the concepts learned so far in this chapter, the meaning (for interpretation of the results) of the calculations, or, computation of both, odds ratio, and relative risk can be better understood by putting attention to the statements below:
Interpreting the results of the odds ratio (OR) and the relative risk (RR):
- OR or, RR = 1.0 (or close to 1.0) means the risk of disease is similar in the exposed and unexposed group and exposure is not associated with disease.
- OR or, RR > 1.0 means the risk of disease is greater in the exposed than the unexposed group and the exposure could be a risk factor for the disease.
- OR or, RR < 1.0 means the risk of disease is less in the exposed group than the unexposed group and the exposure could be a protective factor.
Note: this information can be found in several sources of information available in the Internet, but there is one suggested website that discusses the topic well, and it is available at a document from Boston University, School of Public Health (see citation). [12]
Graphic example of how this information can be used and interpret especially for clinical purposes.
 |
| “Pre-term_corticosteroid_data”, image by HLHB, Licensed as GNU (General Public License), Wikimedia Commons.
Note: This is a plot chart showing information reported by several clinical trials of the use of corticosteroids to hasten lung development in preterm babies. The data used to create the plot is from a 1980s review and it does not contain up-to-date information. It is used only to illustrate the information about practical uses of the odds ratio (and in some cases, relative risk) calculations.[13]
|
More applications
Additional notes on the application of the concepts learned in this chapter about the odds ratio and the relative risk include the concept of Attack rate, Secondary Attack rate and Case Fatality rate. Each concept will be discussed in detail as follows.
Measures of disease outbreaks
The concepts of odd ratio and relative risk are commonly used to investigate disease outbreaks. This type of analysis are one of the ways in which epidemiology is well-known especially for food contamination outbreaks. Also, the analysis of for example food outbreaks has tremendous financial implications, companies can lose credibility and loss of revenue if their products became contaminated. Actually some companies disappeared in some regions of the U.S. after a serious food outbreak, as it is the case of Jack in the Box fast food restaurants chain in 1993. [14]
The first of the calculations to measure the impact of disease outbreaks is the Attack Rate. [15]The formula for its calculation is:
As simple as it look, the formula above is used as a public health measure that has been followed to control disease, separating the ill from those who are not ill or well. The separation of groups into these two categories more than useful for the analysis also help to understand why some people in the group or population did not get sick.
This apparently simple and practical formula provides results that pull together with additional information will provide the epidemiologist or investigator (of the outbreak) with meaningful information that can be put together in a chart for additional analysis, and make predictions about how to start the control of the outbreak as part of the public health team mobilization until the laboratory results are available. The laboratory results confirm the agent that caused the disease outbreak.[16]
Attack rate example
The Champions Elementary School held a potluck picnic for the fourth grade class. Invitations were sent to students and their parents. The day of the picnic, 135 fourth graders and 315 parents attended. The menu contained the following items: Greek salad, potato salad, dinner rolls, fruit salad, lasagna and chocolate chip cookies. It was found that of the parents, 275 ate all of the foods and 125 students ate all the foods. From this group, it was then reported that 45 students came down with staphylococcus food poisoning as did 65 parents. From the group of people who got sick 90 ate the potatoe salad, and 105 ate lasagna. Additional information: there were a group of fifty persons who had drink only and ate no food. Now, use the above information to calculate the following:
Attack rate (100%) = ill/(ill + well) x 100 during a time period =x 100 = 110/400 x 100 = 27.5% (Note than in this case, the denominator is more accurate because the 50 people who did not eat and only drink were subtracted from the total of 450 who constituted the total population).
With the information above, the food specific attack rate can be also calculated, for practical reasons, only two of the food items will be used for the following calculation:
Food Specific (Potato salad) Attack Rate (%) = ill/(ill + well) x 100 during a time period = 90/400 x 100 = 22.5%
Food Specific (Lasagna) Attack Rate (%) = ill/(ill + well) x 100 during a time period = 105/400 x 100 = 26.25%
If the two results are compared, it can be seen that more people got sick from eating the lasagna than the potato salad. But this is not the end of the story, the food specific calculation needs to be done for the rest of the items in order to compare the results, and make a prediction of what food items caused the staphylococcus food poisoning in the mentioned picnic. The word, ‘prediction’ is used because the confirmation of the suspected source of the contamination needs to be confirmed by laboratory analysis samples of the food consumed during the event.
Using the concept of case discussed in another section of this textbook, the study of those ill and well can be followed by using what is known as the Secondary Attack rate. These are the individual who become exposed to the agent that caused the disease outbreak by being in contact directly or indirectly with the original diseased group also called, the exposed group. The formula that follows reflect these concepts:
Secondary Attack rate (100%) = # of new cases in the group minus (-) the initial case(s)/# of susceptible persons in the group minus (-) the initial cases(s) x 100
Key:
Initial case(s) = these are composed by the Index case(s) + co-primaries
Index case(s) = this refers to the case that first comes to the attention of the public health authorities.
Co-primaries = these are the cases related to the index case so closely in time that they are considered to belong to the same generation of cases.
As seen above, the concept of secondary attack rate integrates the concept of Attack rate itself, and it also reflects the concepts of prevalence and incidence learned in previous sections of the book.
Example of Secondary Attack rate
Referring to the information of The Champions Elementary School held a potluck picnic used before in the calculation of the attack rate, the following additional information was obtained: from the people who were in the picnic, it was found that 35 took leftover potato salad home and a total of 95 families ate it the next day. Of the people in this group of families, 55 family members came down with a similar staphylococcus food poison symptoms after eating the leftover potato salad. Some of them got ill the same day, or, later in the evening or, the next day. Fifteen other family members got an upset stomach and were ill about 3 days later. With this information, calculate the secondary attack rate:
Secondary Attack rate (100%) = # of new cases in the group minus (-) the initial case(s)/# of susceptible persons in the group minus (-) the initial cases(s) x 100 = (110-55)/(400-55) = 55 /345 = 15.9%
As a third measure of disease outbreak, there is the Case Fatality Rate, which is a percentage (%). This is used to assess the capacity of an agent or any other factor to kill the affected group or, population. It is used to assess the concept of virulence, which has been also discussed at the beginning of the textbook. If this agent or, factor is able to kill a high number of the population, it is said that it is highly virulent. For example compared to the initial COVID 19 virus serotype, the Delta variant appears to be more virulent that the previous.
 |
| “Case Fatality Rate”, Our World in Data, Licensed CC BY-SA 4.0 International, Wikimedia Commons. |
The formula for case fatality rate is:
At certain point in the COVID-19 pandemic, the following data were available: A certain point in the pandemic, in the U.S. there was a total of 3,542,602 confirmed cases of COVID-19, and 211,944 deaths, with this information the calculation of the Case Fatality Rate follows:
| Confirmed | Deaths | Case‑Fatality | Deaths/100K pop |
|---|---|---|---|
| 3,542,602 | 211,944 | 6.0% | 651.93 |
It is important to note that the numbers have been changing as more cases have been confirmed, the most recent information for the U.S. is a CFR of 1.2% (CFR as March 23, 2022) = 973,213/79,803,443 x 100 = 1.21% of the population. And, the mortality per 100,000 people is 296.49 (973,213/332,403,650 x 100,000 population = 292.78 per 100,000 pop. [17]
| 79,803,443 | 973,213 |
As part of this information and knowing that although the data changes constantly, if it is always useful to see how calculation of the of the Case fatality rate by country in the world is presented in the publications and the news, see image below:
|
| “Case Fatality Rate”, Our World in Data, Licensed CC BY-SA 4.0 International, Wikimedia Commons. |
Application
How these concepts learned above about attack rate, secondary attack rate are used during an infection disease outbreak?
The calculations of the attack rate are used in the context of a set of procedures (also called, protocol) that make the results of these calculations meaningful. For this purpose tables are created to pull all of each individual result as a whole, and then, based on the difference, the investigator arrives to a hypothesis that will eventually lead to the finding of the possible causal agents.
To understand this process, the CDC has published the following information also called, protocol for the investigation of Infectious disease outbreaks. These CDC’s guidelines are summarized below:
Epidemiologic Steps of an Outbreak Investigation
- Prepare for field work
- Establish the existence of an outbreak
- Verify the diagnosis
- Construct a working case definition
- Find cases systematically and record information
- Perform descriptive epidemiology
- Develop hypotheses
- Evaluate hypotheses epidemiologically
- As necessary, reconsider, refine, and re-evaluate hypotheses
- Compare and reconcile with laboratory and/or environmental studies
- Implement control and prevention measures
- Initiate or maintain surveillance
- Communicate findings
Note: This information is taken directly from CDC available at: https://www.cdc.gov/csels/dsepd/ss1978/lesson6/section2.html complete reference is found at the list of references for this chapter under the title: “Investigating an Outbreak, Steps of an Outbreak Investigation” by CDC.
By looking at the information provided above, it is clear that the investigation of an infectious disease outbreak is a systematic process, which means, steps cannot be skipped because one step leads to another until the findings and the communication strategy is done. To illustrate the application of these principles, the following information about some infectious diseases that commonly cause illness in the community is provided.
Foodborne Illness
This is a typical example of in which disease outbreaks are very common. It kind of make sense since before the food is served at the table, it has followed a long process from the field and the production/processing/packaging plants to the distributors and consumers. This process is commonly known as the food production chain. See an illustration of this process below:
 |
| “Focus Areas” (for food production safety), Licensed CC BY-SA 4.0, Wikimedia Commons. |
The idea behind this approach is to put attention to the different places in which the food is has been planted (for example, fruit and vegetables), packed, and distributed even before it is at the consumer’s plate. Besides the image above, the following is an specific example:
 |
| “Farm to table continuum”, Public domain, Image from Flickr.
The image can be also found as part of the Food Safety: USDA Needs to Strengthen Its Approach to Protecting Human Health from Pathogens in Poultry Products Report.[18] |
Several pathogens or, agents. In general, the information the investigator (clinician, epidemiologist, or, any other public health worker dedicated to this area of foodborne illness) should look for is the following:
| Disease or Agent name |
| Incubation period of the disease |
| Mode of Transmission |
See how this information is usually found in textbooks, and the Internet. It is customary to create a table of agents, which I have re-created from several sources of information that are mainly of public domain. The following table contains information about the most common agents, and it does not pretend to be an exhaustive list of foodborne agents.
| Disease/Agent | Incubation Period | Mode of Transmission | Common Manifestations |
| Staphylococcus aureus | 2-4 hours | Contaminated food that contains staphylococcus enterotoxin | Gastrointestinal syndrome, majority of cases with vomiting |
| Cholera/Vibrio cholerae | 2-3 days | Contaminated water that contains infected feces or vomitus, also contaminated food | Profuse watery diarrhea (painless) |
| Campylobacter enteritis/Campylobacter jejuni | 2-5 days | Abdominal pain, diarrhea pain, malaise, fever | Undercooked chicken or pork, contaminated food and water, raw milk |
| Clostridium perfringens food poisoning | 10-12 hours | Heavily contaminated food (for example, meats and gravies that have been inadequately heated or stores especially at temperatures that allows bacteria multiplication | Diarrhea |
| Clostridium botulinum/Classic botulism | 12-36 hours | Contaminate food containing toxins (for example, home canned foods) | Classic syndrome compatible with botulism that include neurological symptoms besides the diarrhea. |
| Salmonellosis/Various species of Salmonella (for example, S. typhimurium and S. enteritidis) | 12-36 hours | Contaminated food that contains Salmonella organisms (for example, undercooked chicken, eggs, meat, raw milk) | Gastrointestinal syndrome |
Table of Common Foodborne Agents, created by the author of this textbook, Giovanni Antunez, Licensed CC SA 4.0
 |
| “Foodborne Illnesses”, Image from SafetyNews |
Common foodborne agents are staphylococcus aureus, clostridium botulinum and Escherichia coli (commonly known just as E. coli). But, depending on the source of the report and the year of publication, common bacteria foodborne agents include, nontyphoidal Salmonella spp., Clostridium perfringens, and Campylobacter spp. Leading causes of hospitalization were nontyphoidal Salmonella spp., norovirus (not include in the table because it is a virus and not a bacteria) and Campylobacter spp. [19]
Waterborne diseases
Some of the waterborne diseases are also foodborne as it is the case of Cholera, which is transmitted mainly by contaminated drinking water, and also by contaminated food. Common waterborne diseases besides cholera include, giardiasis, amebiasis that are intestinal parasites, and legionellosis (caused by bacteria) and schistosomiasis, which is a blood parasite transmitted by water contaminated with human waste).
Cholera
Once epidemic, the last epidemic of cholera in the new world, which is also known as the Americas is, the epidemic of cholera in Peru, Mexico and Central America in the 1990s.[20] A disease of the past century came back as a re-emerging disease in those mentioned countries. and also in recent years in Africa, one of the most dramatic is the cholera epidemic in Liberia and Sierra Leone in Africa just after the Ebola epidemic. And, in recent reports, cholera continuous to be a problem for several countries, below is a map of the affected countries:
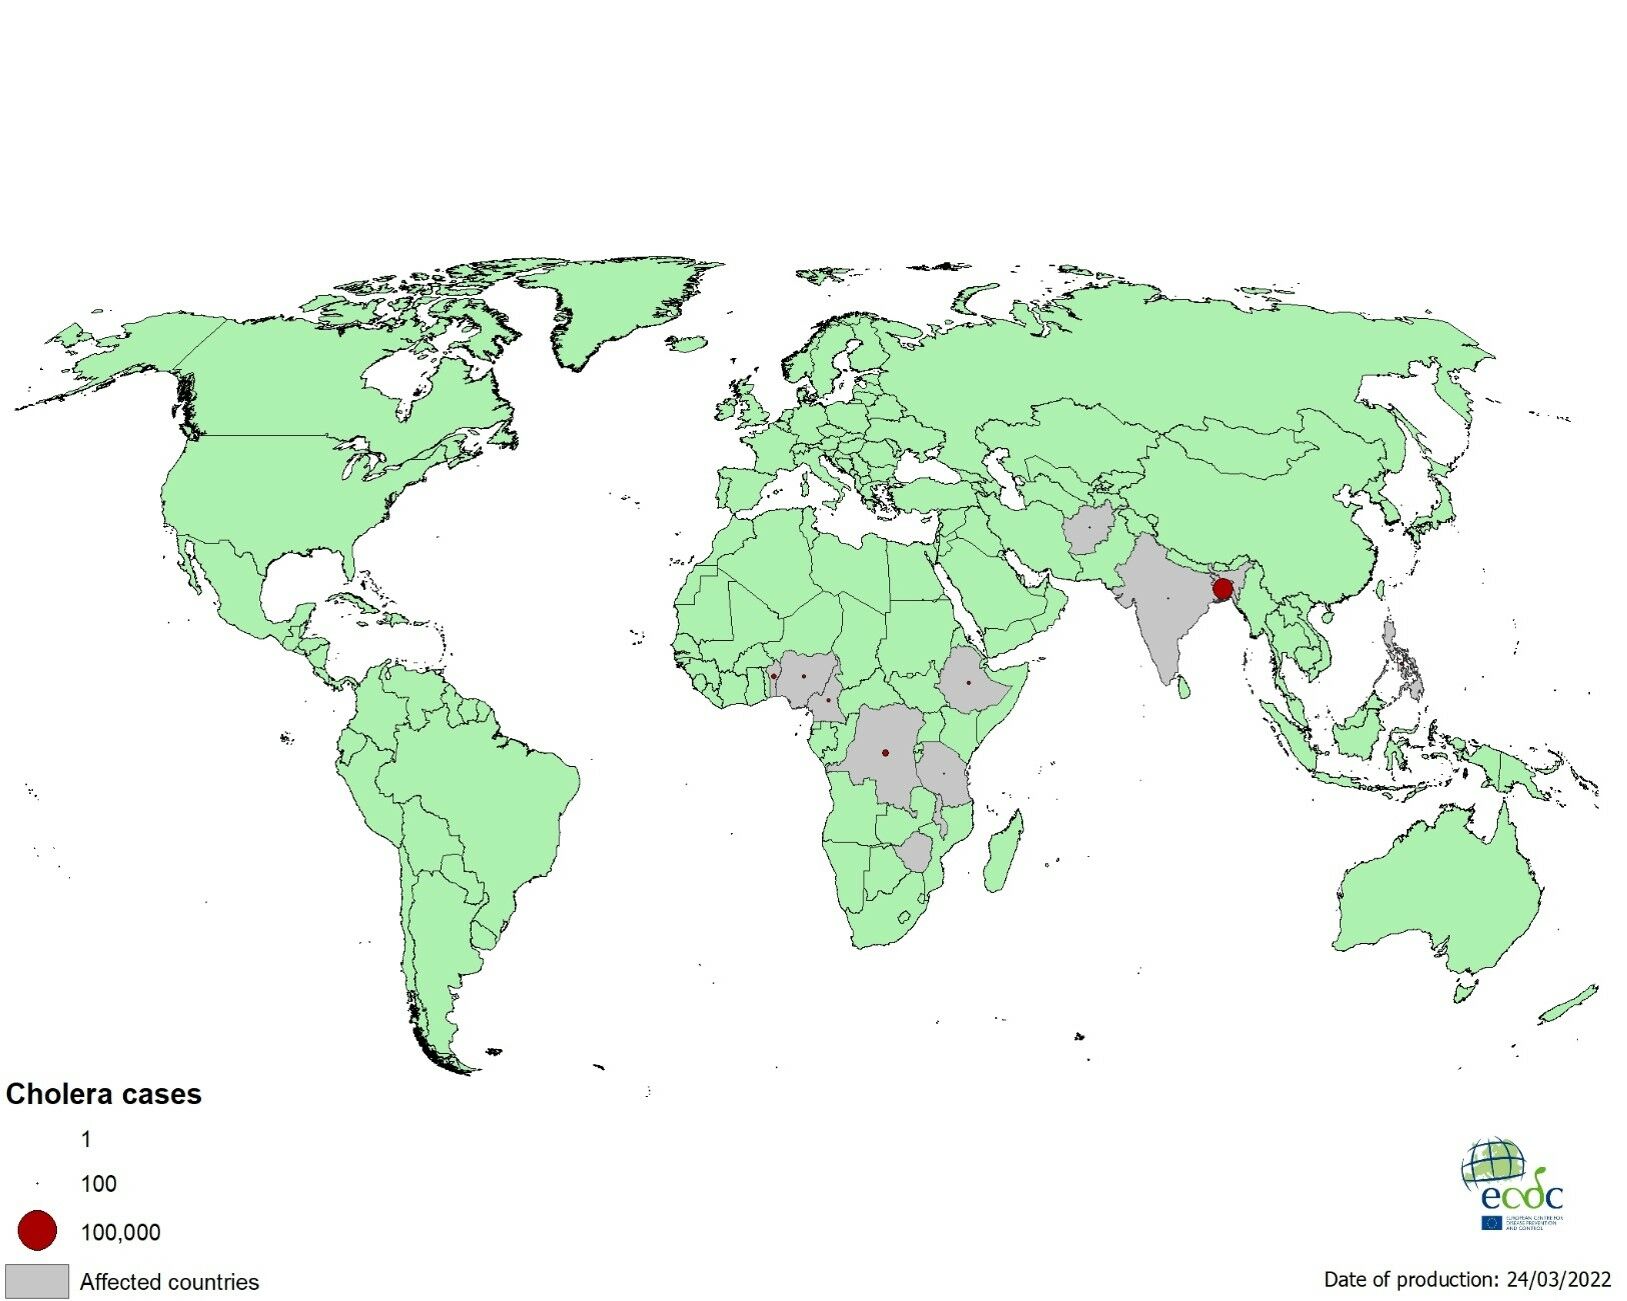 |
| “Geographical distribution of new cholera cases reported worldwide, January – March 2022”, Image from The European agency of Prevention and Control. |
Vaccine Preventable Diseases
Before the current COVID-19 pandemic, vaccine preventable diseases had been the cause of major disease outbreaks in the world not to say epidemics. The following are common vaccine preventable diseases: diphtheria, pertussis, tetanus, Haemophilus influenzae different serotypes, hepatitis A and B, measles, rubella, mumps, paralytic poliomyelitis. Classically, the majority of these diseases had affected the world’s children population, and because of the major emphasis in child’s vaccination, these diseases although not completely eradicated yet, they remain mostly under control. But cases of disease outbreaks especially of measles have been reported in recent years, as it is the case.
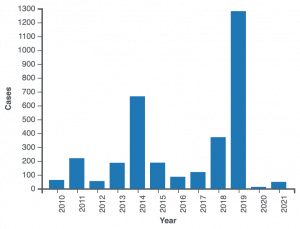 |
| “Reported measles cases in the United States by year, as of February 20, 2022”, image from CDC. [21] |
Sexually Transmitted Diseases
Other diseases that commonly generate disease outbreaks, includes HIV/AIDS which constitutes the most significant example of a sexually transmitted disease that reached epidemic proportions since the 1980s, and although no major attention has been brought to this serious public health problems, HIV/AIDS is still a serious problem in the United States and the world. The following is a map of the estimated number of people living with the disease in the world:
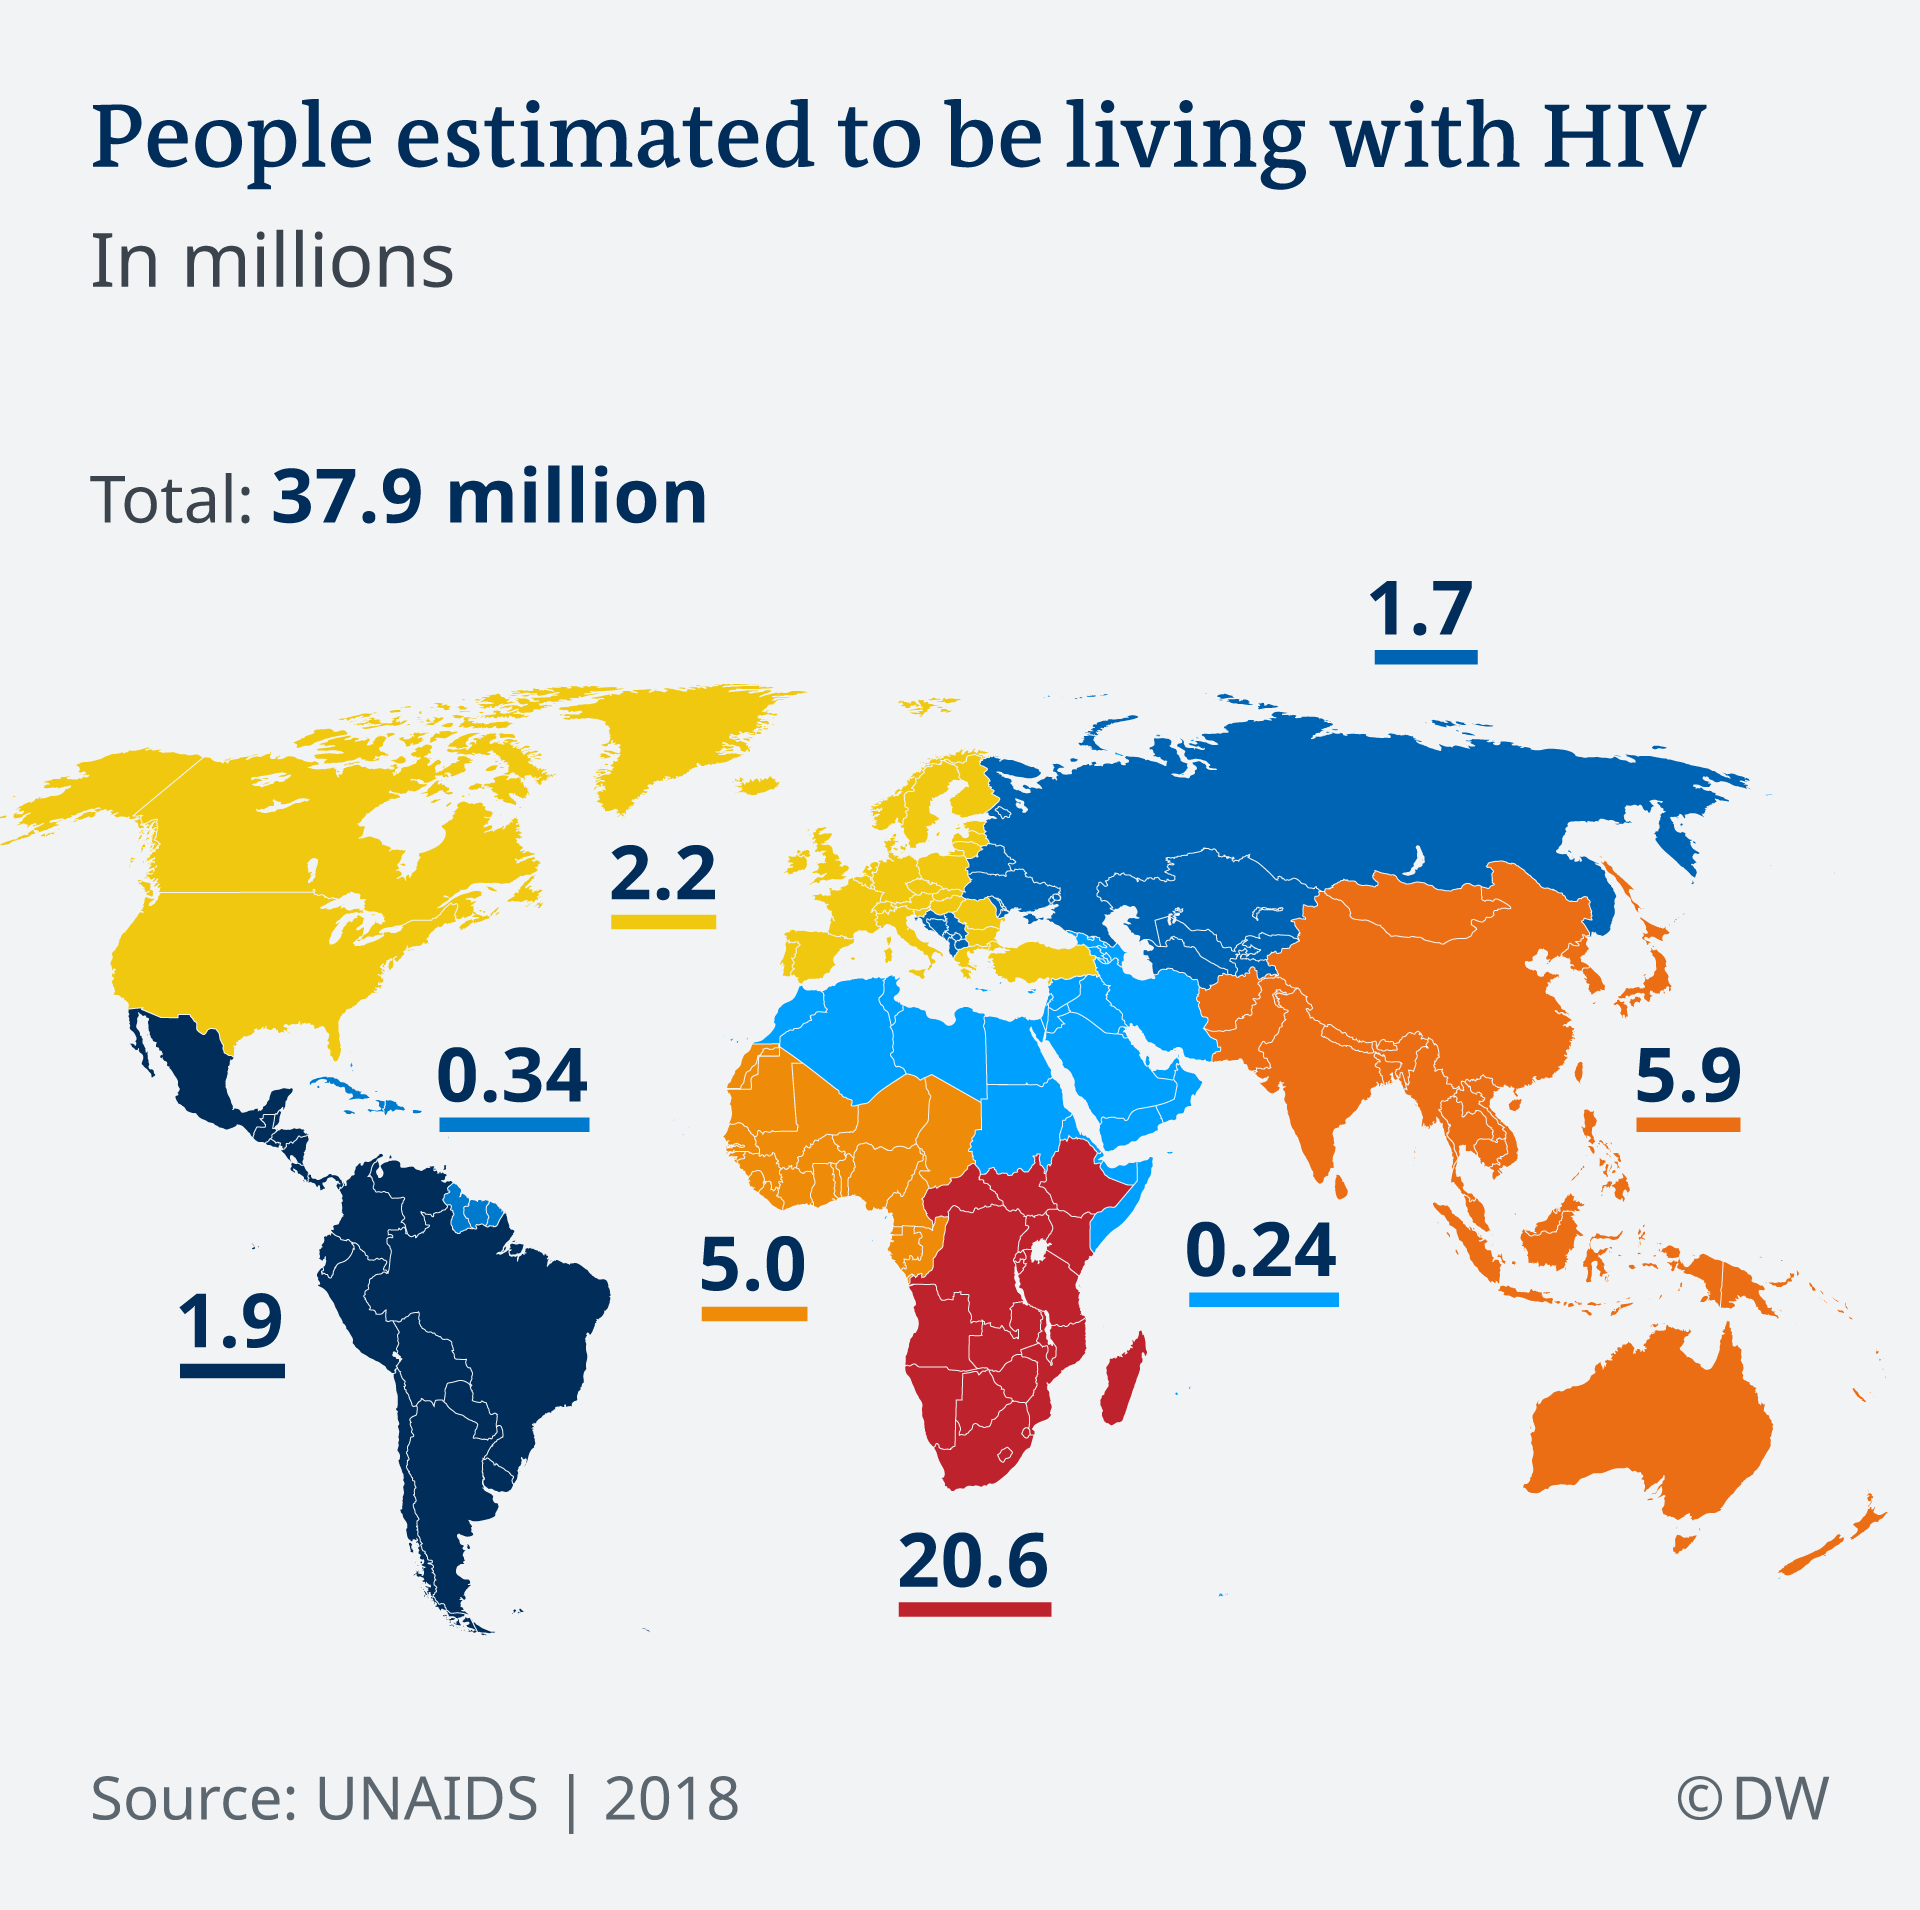 |
| Image from DW (Deutsche Welle) News |
The HIV/AIDS pandemic shows that there is need to remind us that although COVID-19 is the most pressing current health situation in the world, there is also other infectious and non infectious diseases that are waiting for attention of the world health care system. Otherwise, the world will enter in a continuous health emergency that will be difficult to control if no preparations are taken before re-emergent and new emerging diseases appear.
Summary. This chapter had covered the concepts of odds and relative risk and how they are used in epidemiology, and public health. Examples of both forms of assessment have been provided, and the second part of the chapter covered mainly applications and calculations that are used commonly for the investigation of disease outbreaks. These latter calculations are mainly applications of the concepts of prevalence and incidence, which is the topic of the previous chapter.
- Knol M, J, Algra A, Groenwold R, H, H. (2012). How to Deal with Measures of Association: A Short Guide for the Clinician. Cerebrovasc Dis 33:98-103. Available at: https://www.karger.com/Article/Fulltext/334180# ↵
- Online Dictionary (n.d.) Definitions from Oxford Languages. From https://www.google.com/search?client=firefox-b-1-d&sxsrf=APq-WBueRS_Jgug2a61MY29uKUB-p22K9A:1647222052957&q=define+probability&forcedict=probability&dictcorpus=en-US&expnd=1 ↵
- BYJU’S. (n.d.). Probability Definition in Math. From https://byjus.com/maths/probability/ ↵
- Canadian Centre for Occupational Health and Safety (CCOHS). (n.d.). Risk Assessment. From https://www.ccohs.ca/oshanswers/hsprograms/risk_assessment.html ↵
- RxList. (n.d.). Definition of Risk Factor. From https://www.rxlist.com/risk_factor/definition.htm ↵
- Haug, M. Gerard (n.d.). measure of association. Encyclopedia Britannica. https://www.britannica.com/topic/measure-of-association ↵
- Alexander LK, Lopes B, Ricchetti-Masterson K, Yeatts KB. (2012). Common Measures and Statistics in Epidemiological Literature In Eric Notebook, Second Ed. Available at: https://sph.unc.edu/wp-content/uploads/sites/112/2015/07/nciph_ERIC3.pdf ↵
- Hankwang. (202). COVID-19 Odds ratios by country. From https://commons.wikimedia.org/wiki/File:Covid-19_VOC-202012-01_odds_ratio_curves_by_country.png ↵
- Sauerbrei, W., & Blettner, M. (2009). Interpreting results in 2 x 2 tables: part 9 of a series on evaluation of scientific publications. Deutsches Arzteblatt international, 106(48), 795–800. https://doi.org/10.3238/arztebl.2009.0795 ↵
- CDC. (n.d.). Lesson 3: Measures of Risk. Section 5: Measures of Association In Principles of Epidemiology in Public Health Practice, Third Edition. From https://www.cdc.gov/csels/dsepd/ss1978/lesson3/section5.html ↵
- Tenny S, Hoffman MR. Relative Risk. [Updated 2021 Mar 30]. In: StatPearls [Internet]. Treasure Island (FL): StatPearls Publishing; 2021 Jan-. Available from: https://www.ncbi.nlm.nih.gov/books/NBK430824/ ↵
- Boston University, School of Public Health. (n.d.). Measures of association. From https://sphweb.bumc.bu.edu/otlt/mph-modules/ep/ep713_association/ep713_association_print.html ↵
- Roberts D, Brown J, Medley N, Dalziel SR. (2017). Antenatal corticosteroids for accelerating fetal lung maturation for women at risk of preterm birth. Cochrane Database of Systematic Reviews 3, Art. No.: CD004454. DOI:10.1002/14651858.CD004454.pub3. Accessed 14 April 2022. From https://www.cochranelibrary.com/cdsr/doi/10.1002/14651858.CD004454.pub3/full ↵
- Food Safety News (FSN). (n.d.). Jack in the Box E. coli Outbreak – 25th Anniversary https://www.foodsafetynews.com/2017/12/jack-in-the-box-e-coli-outbreak-25th-anniversary/ ↵
- Pettygrove, S. (n.d.). attack rate. Encyclopedia Britannica. From https://www.britannica.com/science/attack-rate ↵
- CDC. (n.d.). Lesson 3: Measures of Risk. Section 2: Morbidity Frequency Measures In Principles of Epidemiology in Public Health Practice, Third Edition. From https://www.cdc.gov/csels/dsepd/ss1978/lesson3/section2.html ↵
- Johns Hopkins School of Medicine. (n.d.). Mortality Analyses. From https://coronavirus.jhu.edu/data/mortality ↵
- U.S. Government Accountability Office (GAO). Food Safety: USDA Needs to Strengthen Its Approach to Protecting Human Health from Pathogens in Poultry Products. From https://www.gao.gov/products/gao-14-744 ↵
- Scallan, E., Hoekstra, R. M., Angulo, F. J., Tauxe, R. V., Widdowson, M., Roy, S. L....Griffin, P. M. (2011). Foodborne Illness Acquired in the United States—Major Pathogens. Emerging Infectious Diseases, 17(1), 7-15. https://doi.org/10.3201/eid1701.p11101 ↵
- Olsvik O. Koleraepidemien i Latin-Amerika [The cholera epidemic in Latin America]. Tidsskr Nor Laegeforen. 1992 May 30;112(14):1843-6. Norwegian. PMID: 1631846. ↵
- CDC. (2022). Measles Cases and Outbreaks. From https://www.cdc.gov/measles/cases-outbreaks.html ↵
The extent to which an event is likely to occur, measured by the ratio of the favorable cases to the whole number of cases possible.
the overall process of hazard identification, risk analysis, and risk evaluation.
Risk factor: Something that increases a person's chances of developing a disease. For example, cigarette smoking is a risk factor for lung cancer, and obesity is a risk factor for heart disease.
Measures of association, in statistics, any of various factors or coefficients used to quantify a relationship between two or more variables.
The attack rate is calculated as the number of people who became ill divided by the number of people at risk for the illness. In order to calculate an attack rate, a case definition, or set of criteria to define the disease of interest, must first be developed.
In the context of this class, a protocol is a series of guidelines for public health professionals, including epidemiologists that need to be follow in order to arrive to a valid scientific explanation of for example, the origin of a disease outbreak.
From the field and the production/processing/packaging plants to the distributors and consumers' table.
The term is used to identify the cause of the disease (a.k.a. ‘agent’
Another name for pathogens, or, causes of disease mainly infectious diseases.

Feedback/Errata