Part II
1 What is Epidemiology?
|
Learning Objectives By the end of this chapter, the learner will be able to
|
What is epidemiology?
The field of epidemiology is relatively a new science, at the point that sometimes (probably frequently), it is better understood in the context of another field of study, biostatistics. But epidemiology has its own terminology, and also its own methodology that make it a little different, if not very different from biostatistics.[1]
Epidemiology Definition
It is accepted that epidemiology is the science to understand, and explain the occurrences of health phenomena in a population. As a branch of public health, epidemiology studies not only disease, but also different health outcomes. [2]
Epidemiology: an interdisciplinary science
Since epidemiology integrates several aspects of the social sciences, and at the same time uses information, and tools from other sciences, that is the reason to consider, epidemiology as a interdisciplinary science. It takes information from statistics, medicine, biology, sociology, nutrition, cultural studies, gender studies, anthropology, etc., and integrates them into the production of models, formulas, and analyses that can be used to predict, prevent, and analyze many health phenomena, including the issue of quality of life, and wellness. Its contributions are vast, because of its interdisciplinary nature.[3] At the same time for epidemiology to be interdisciplinary brings some complications, since there is no way that results are free of errors; but as a science that auto-correct through trial and error, make it stronger for advancement.[4]
See an image (representation) of how interdisciplinary sciences work for a degree in bioinformatics.
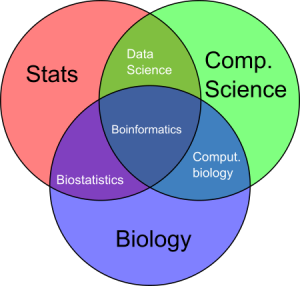 |
| A venn diagram showing what you might find at the intersections of statistics, computer science and biology. Image from Genmejigsaw, Bioinformatics. |
| Common Uses of Epidemiology | ||
|---|---|---|
| The following are commonly accepted uses of the field of epidemiology, details of each are included in the table below: | ||
| Use(s) | Example(s) | Additional examples and comments |
| To predict and prevent adverse (or, positive) health outcomes. | Epidemiology can be used to predict, and prevent adverse outcomes especially with those situations that are complex health issues. | The prediction feature has been one of the main characteristics because it is used to forecast for example, epidemics; and the prevention part confirms that epidemiology is an essential part of public health. |
| To determine the spread, and distribution of health issues | Epidemiology can be also used to determine the spread, and distribution of health issues, and outcomes in a community, by providing not only the data that supports the report, but also, the baseline information that policy makers can use to support current public health policies, and in some cases laws that regulate the unhealthy behavior. | In other cases, it can be used to promote a healthy behavior in order to control, or, prevent the disease (as it has been mentioned before in this section), or, the health outcome (not necessarily a disease) that contributes to the overall quality of life of the affected group, or, population. |
| To collect information, and track different health outcomes. | Epidemiology is used also to collect information, and track different health outcomes in a population. The most common method to conduct this function, is known as surveillance system that is used to systematically collect, analyze and disseminate health data that is commonly used for the functioning of public health programs, and services. | More than a method it can be used also to allocate resources that will help the public health practitioner find the needed resources for specific health conditions. |
| To study infectious diseases and also chronic diseases. | Since epidemiology started with the study of infectious diseases, the field was used mainly to study them. | the field of epidemiology expanded, and it also included the study of chronic diseases such as cardiovascular and cancer, which are also called, life-style diseases since their risk factors are linked to the way in which people live. |
| The planning of health services In this case, epidemiology is used also for the planning of health services, not only in clinical settings; but also at the population level, or, public health level (programs). |
For example, an epidemiological study about vaccination in an low income, and low literacy community will provide, and generate information, and data that can inform immunization public health programs. | Also, it can also inform (especially data) policy makers who want to legislate for more fair access to vaccines, especially to those groups in the population that have low, or, no access to these services. |
| Epidemiology and the evaluation of public health programs. | Epidemiology is very useful for the evaluation of health programs, including community-based programs, and in general health initiatives (such as coalitions, and consortia), in which an evaluation of the impact of the interventions is needed in order to keep the program alive, by getting funded. | Most funding organization these days, require an evaluation of the impact of most program's intervention, and epidemiology can assist with that in many ways by providing the numbers (statistics) that quantify the overall impact, but also the data that can be used also to predict health outcome. |
| For Epidemiology fieldwork. | In recent years the field of epidemiology has been opened to include qualitative data (and not only numbers, and it did in the past) to enhance, and put a face to the numbers; the most common of these are case studies, in which the number is small, and the meaningfulness of the information is accomplished by using qualitative data such as In depth interviews, personal stories, and narratives. | As we had mentioned in other sections of this chapter and the rest of the textbook, epidemiology by nature has been a quantitative science. |
| For the design and implementation of data collection instruments | In addition epidemiology can assist the public health, and medical practitioner with the development of data collection instruments such as surveys, and questionnaires commonly used to obtain population data that will be later analyzed using the epidemiological approach, which is population based. | Most of these data collection is quantitative. |
| To address public health problems. | Health outcomes are linked to poverty, low socioeconomic status, access to resources, issues of racism, and discrimination, etc. These are important aspects of public health. | As part of public health, epidemiology has an important role in social justice too, because many of the adverse health outcomes are linked to social issues such as poverty, low socioeconomic status, access to resources, issues of racism, and discrimination, etc. |
| The content of this table has been prepared using the references listed here. [5], [6], [7], [8], [9], [10], [11], [12], [13], [14]. | ||
The list of uses of epidemiology included in this book does not pretend to be exhaustive. There are probably more uses that have not been listed here but they can be found in the medical and public health literature.
Key Takeaways – Epidemiology is used to
- Predict and prevent adverse (or, positive) health outcomes
- collect information, and track different health outcomes
- To study infectious diseases and also chronic diseases
- For the planning of health services
- And others that had been listed above in this section.
Epidemiology and its beginnings
In addition, all of the mentioned uses and applications of epidemiology since its beginnings, epidemiology has greatly contributed to studying disease causality in medicine and public health.
The initial models of causality.
The most common models are discussed in this chapter. And, the applications of most of the terms will be covered in a brief chapter dedicated to infectious diseases later in the book.
Approaches used to explain causality
The history of epidemiology is linked to the causality model commonly used in the study of infectious diseases. And, one of the initial approaches used to explain causality is the interaction between host, agent, and environment.
The epidemiological triangle
In many ways, epidemiology started with the famous epidemiological triangle, which is an old model to explain causality. In this concept, for disease to occur, there is need to have a host, an agent, and an environment.[15] This explanation holds true for a long time in sciences, and at a certain point, the variable, time was added, in order to add a new dimension, which means, host, agent and environment occur in a specific time that can be minutes, hours, days, etc.

| Image prepared by Giovanni Antunez, Licensed CC BY 4.0 |
In so many ways, this model holds true for infectious diseases because it is based on the medical model to explain causality. The situation changes when these concepts are applied to the causality of non infectious diseases, in which the interaction of so many other factors, some of them very unpredictable cannot be explained by this concept of the epidemiological triangle. But for now, in this chapter, we will use the model to introduce the concepts, and definitions commonly used in epidemiology.[16]
Key Takeaways (Sidebar)
The agent
It is accepted that the agent is one of the major causal factors – and of course – in this medical model, common agents include (what we know so far in sciences): bacteria, viruses, fungi, other microbes and parasites. Another common name for the agent, is pathogen.pathogen. Examples of common agents, bacteria. See picture below:
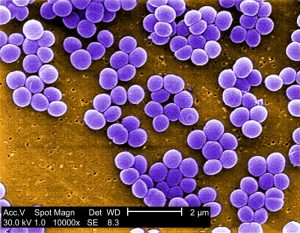 |
| Example of an agent. Staphylococcus aureus bacteria. Image from PIXNIO. Public Domain. |
The host
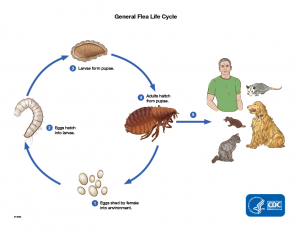 |
| The host is explained in this diagram shows ‘the typical lifecycle of fleas’. Image from CDC, Public Domain. |
The environment
 |
| Example of an environment, “Pollution in the city of Los Angeles”. Image from Wikipedia Commons. Licensed CC BY-SA 3.0 |
Time
 |
| Time, image by Mohamed Hassan, Pixabay |
Other models to explain causation in epidemiology
There is another model commonly used in epidemiology, which is very similar to the epidemiological triangle, and this is called, the ‘Chain of Infection.’ Again, the model works well for infectious diseases but not for other types of diseases or disorders.
The chain of infection model
In the chain of infection model, the main factors that contribute to disease development are the same, but they seem to be more developed, for example, the agent/pathogen is called, etiologic agent/pathogen; there is the addition of another category called, the source/reservoir, mode of transmission, and host. See image:
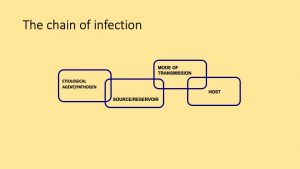 |
| Image prepared by Giovanni Antunez, Licensed CC BY 4.0 |
The improved model
Over the years, the chain of infection model has been expanded and some of the components [although they are essentially the same as the original conceptualization of the model], they appear listed independently, for example, the mode of transmission remains, but two new concepts added, the ‘means of entry‘ and the ‘means of escape’ – which are essentially related to the ‘mode’ of transmission. Also, the ‘host susceptibility’ has been added too, and the word, ‘organism‘ has been added to the the word ‘pathogen,’ creating a category known as the ‘pathogenic organism. The reservoir category remained unchanged. See the image that represents the model:
 |
| Image from a Chain of infection |
Benefits of the two models – epidemiological triangle, and chain of infection
The answer to this question is that these models complement each other or expand on the concepts used to explain how disease transmission occurs. There is a lot details involved in the implementation of this model, but for this section, the major concepts have been discussed. It is also important to note that with the COVID-19 pandemic, many of these concepts have resurged because the pandemic is caused by an infectious disease agent.[17]
The newly developed epidemiological triangle
In the context of this section, here is how the concepts presented above have contributed to the ‘newly improved epidemiological triangle,’ which is presented below:
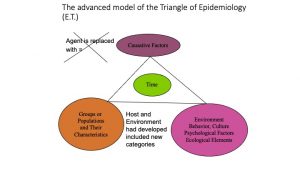 |
| Image prepared by Giovanni Antunez, Licensed CC BY 4.0 |
The epidemiological triangle is considered foundational to the field of epidemiology, it is limited (very basic) and only applies to infectious and other communicable diseases. For this reason, the need to develop more advanced models has been the basis to develop another concept, which is the web of causation.
The concept of the web of causation
The main premise of this approach is that there is more than one factor involved in the development of what we call, ‘disease.’ It is a series of factors that are involved in this process, it is multifactorial. multifactorial And, when the several factors are put together, the model looks more like a web -hence the name, web of causation. One example could be the case of the use of prostate-specific antigen (PSA) test used to assess if a man needs or, does not cancer treatment, especially unnecessary cancer treatment. [18] See image below:
 |
| Image ‘Example web of causation for PSA test’. Monika Wahi , Wikimedia Commons. Licensed CC BY-SA 4.0 |
Although the web of causation (also called, the ‘web of causality’) is very useful, but when there is time to operationalize the multitude of factors involved in the process. Most models fall short because it is more than the interaction between an agent, a host, and an environment, and even if the concepts are expanded such as in the case of the chain of infection model. There is a need to integrate the concepts of risk factors and other several factors that affect the health of the individual and the community in a direct and indirect forms. The concept of health determinants is depicted in the following image:
| Image: Social Determinants of Health. From CDC, Public Domain. |
In general social determinants are conditions in the places where people live, learn, work, and play that affect a wide range of health and quality-of life-risks and outcomes. [19] This approach is being found useful, especially to understand how health and disease are dynamic concepts that go beyond the identification of agents/pathogens, host characteristics, and the environment. On the other hand, and to be fair, the previous (‘older’) models can still be seen in this new model, especially that expansion on the concept of environment, and its associated factors.
Additional Common Epidemiological concepts
In this section of the chapter, the following concepts will be defined and explained: epidemic, endemic, pandemic, holoendemic, and others.
Epidemic
The term epidemic in general refers to an increase in the frequency of a disease (the term applies mostly to infectious diseases, although in recent years, it is common to hear the use of the term for non infectious diseases such as obesity). Or, put in another way, epidemic refers to an ‘excess’ in the number of cases of a disease. See a general graph (or pattern) of an epidemic:
 |
| Image from Medical Anthropology epidemiology. |
 |
| Image from Research Gate, originally developed by Mikayel Poghosyan |
At the same time, it is common for newly epidemiology students to confuse the term, ‘seasonal disease’ (explained later in this section) with an epidemic disease. But the difference is that a seasonal disease occurs during certain seasons, or, times of the year, and then, it declines. A common example is the seasonal flu, which usually starts in early October and ends around April or, May. Then, the number of cases declines significantly (almost disappears) during the summer months usually June – August. See a graphic representation of a seasonal disease such as the flu.
 |
| Image from CDC. Influenza outpatient visits, Public Domain. |
Another common term, especially in these days of COVID-19, it is pandemic. Since a pandemic is a disease that after being epidemic has crossed borders and become a health problem across the world, see an image of this below from the 2009 swine flu pandemic:
 |
| “The 2009 swine flu pandemic by country.” Image by ‘Allstrak, Wikipedia, licensed CC BY-SA 4.0 |
There is also a typical (classic) shape of a pandemic, which compared to the graph on an epidemic (see, epidemic here in this chapter), the pandemic comes (goes) in waves, and the entire process passed, it resembles the shape of a ‘W’ letter. See image below:
 |
| Spanish Flu by Age: M.A. Thesis, 2008 Keirsten E. Snover “The Spanish Influenza Epidemic of 1918-1919: The Spokane Experience”, Public Domain. |
Another image that reinforce the comments about the ‘pandemic goes in waves,’ can be seen below:
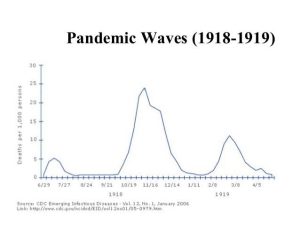 |
|
“Pandemic Waves (1918-1919),” Image from Future Capital, Public Domain. |
Another characteristic is that pandemic tends to appears every one hundred years, or, closer to one hundred years from the last pandemic as is the case of the Spanish flu. Epidemiologists use this type of information to compare and predict current and future pandemics. See the image below from :
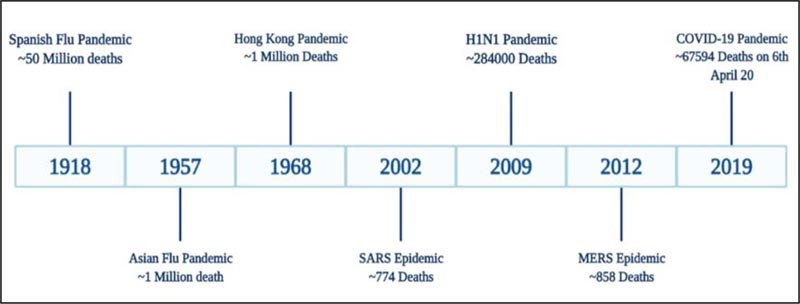 |
| “Timeline of influenza and coronavirus outbreaks since 19th Century.” From the article, A Comparative Analysis of the Spanish Flu 1918 and COVID-19 Pandemics In the Open PH Journal. See detail reference.[20] Licensed CC BY 4.0 |
An additional concept that usually is discussed in this context, is the concept of endemic, which essentially refers to a disease with a constant frequency that is limited to a specific area or region in the world. An example of an endemic disease for example in tropical regions, or, countries in the world is malaria, which is ‘endemic’ for example in some regions of Africa and Latin America, see image below:
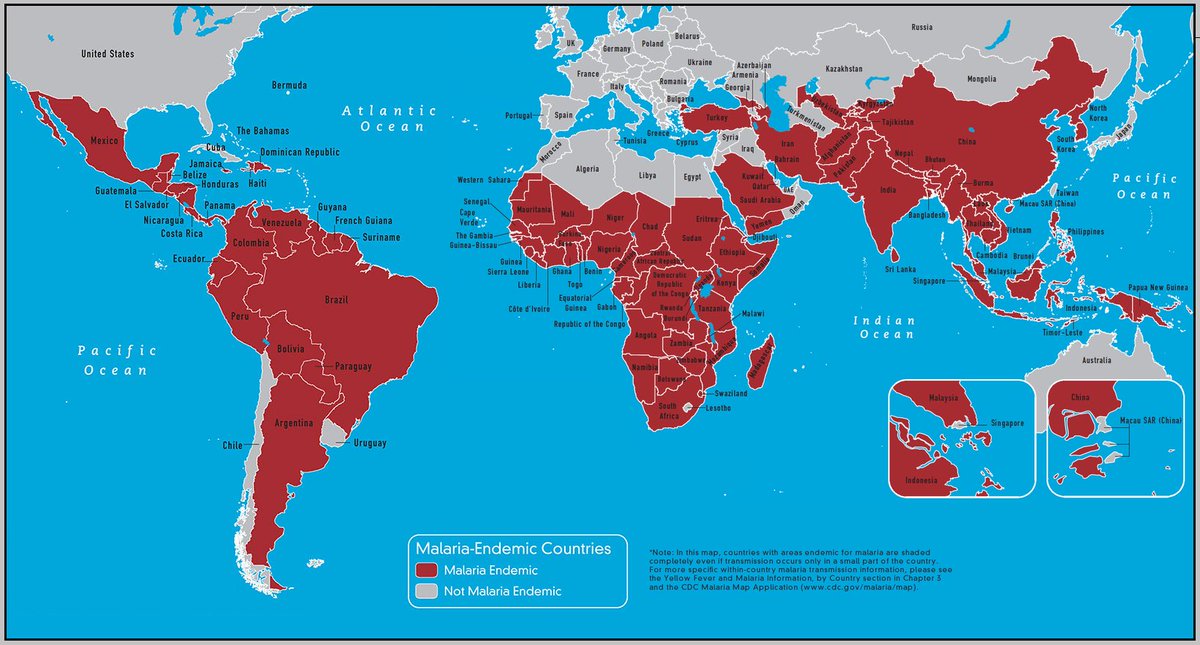 |
| Image found in a Tweet from Dr. Stavros Saripanidis. Labeled CDC map of Malaria Endemic Countries. |
Finally, an additional terms is also part of the list of concept discussed here, there are two terms, hyperendemic and holoendemic. The use of these terms is infrequent, but it probably helps to understand that a combination of terms is also possible.
Other terms and concepts used in epidemiology
The natural course of a disease
Every disease follows a natural course from start to finish, known as its natural history. If no medical intervention is introduced, the disease will run its full course. Epidemiology, the study of diseases, was originally developed under the medical model. Some diseases have a well-documented natural history, while others are not well understood. The image below provides a summary of the key components of this model.
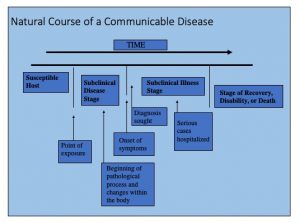 |
| Image prepared by Giovanni Antunez, Licensed CC BY 4.0 |
This model (of the natural history of disease) has been used to develop the concepts of primary, secondary, and tertiary prevention that are commonly used in medicine, public health, and especially in public health education. And this makes sense if the model is again applied to an infectious, or, communicable disease.
In this step, the person recovers, dies, becomes disabled, or, with severe limitations such as in the case of after a stroke in which most affected individuals have problems with speech, and walking to just mention some of the complications of an after a stroke episode. This phase is commonly misunderstood because many people see rehabilitation as part of the secondary prevention in which only medical care professionals provide services to rehabilitate the affected individual, but in general, going beyond the medical model, rehabilitation is more than just medical care, many times it means, helping the affected individual to improve the quality of life and to come back to society in a productive manner.
In addition, the following table goes into more detail and provide examples that should help to understand the above-mentioned concepts:
 |
| Image prepared by Giovanni Antunez, Licensed CC BY 4.0 |
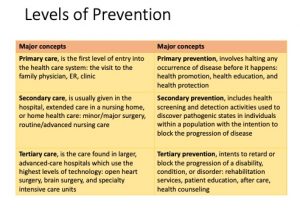
See a summary of this comparison in the following table:
| In the clinical model, there are three levels of healthcare services | From the clinical model, three level of prevention have emerged |
| Primary care | Primary prevention |
| Secondary care
|
Secondary prevention |
| Tertiary care
|
Tertiary prevention |
Important comments about the information above
The above distinctions should help public health professionals in training, especially health educators to better understand the differences between the levels of care and the level of prevention, especially for students who are not familiar with the United States healthcare system. This system works differently in other parts of the world, especially in developing countries. So, the comparison should also help to conciliate the differences.
Summary of the chapter.
This chapter has intended to give the student among other things, an overview of the field of epidemiology, what is it, and how it works. Also, it had covered most common concepts used in epidemiology; most of these concepts will be integrated with the content of several of the chapters that made the book.
- No Author. (n.d.). Epidemiology vs. Biostatistics: Understanding Their Roles in Public Health. University of Nevada Reno. Available at: https://onlinedegrees.unr.edu/blog/epidemiology-vs-biostatistics/ ↵
- Hernandez JBR, Kim PY. Epidemiology Morbidity And Mortality. (2020 Oct 13). In: StatPearls [Internet]. Treasure Island (FL): StatPearls Publishing; 2021 Jan–. PMID: 31613448. Available https://www.ncbi.nlm.nih.gov/books/NBK547668/ ↵
- Hanson, A., & Levin, B. (2018-02). Epidemiology, Chapter 4. In Introduction to Public Health in Pharmacy. Oxford, UK: Oxford University Press. Available at: https://oxfordmedicine.com/view/10.1093/med/9780190238308.001.0001/med-9780190238308 ↵
- Schoenbach, VJ. (2000). Chapter 4. Phenomenon of disease In Epidemiology Net. Available at: http://www.epidemiolog.net/evolving/PhenomenonofDisease.pdf ↵
- Frérot, M., Lefebvre, A., Aho, S., Callier, P., Astruc, K., & Aho Glélé, L. S. (2018). What is epidemiology? Changing definitions of epidemiology 1978-2017. PloS one, 13(12), e0208442. From https://www.ncbi.nlm.nih.gov/pmc/articles/PMC6287859/ ↵
- Centers for Disease Control and Prevention. (CDC). (2021). Social Determinants of Health: Know What Affects Health. Available at: https://www.cdc.gov/socialdeterminants/index.htm ↵
- Thacker, S. B., Parrish, R. G., & Trowbridge, F. L. (1988). A method for evaluating systems of epidemiological surveillance. World health statistics quarterly. Rapport trimestriel de statistiques sanitaires mondiales, 41(1), 11–18. From https://pubmed.ncbi.nlm.nih.gov/3269210/ ↵
- Al-Maskari, F. (n.d.). Lifestyle diseases: An Economic Burden on the Health Services. United Nations, Chronicle. From https://www.un.org/en/chronicle/article/lifestyle-diseases-economic-burden-health-services ↵
- Centers for Disease Control and Prevention. (CDC). (2011). Lesson 1: Introduction to Epidemiology Section 1: Definition of Epidemiology In Principles of Epidemiology in Public Health Practice. Third Edition. Available at: https://www.cdc.gov/csels/dsepd/ss1978/lesson1/section1.html ↵
- Centers for Disease Control and Prevention. (CDC). (2011). Epidemiology Glossary. Available at: https://www.cdc.gov/reproductivehealth/data_stats/glossary.html ↵
- Wolff, B., Mahoney, F., Lohiniva, AL., Corkum, M. (n.d.). Collecting and Analyzing Qualitative Data In the CDC field epidemiology manual. From https://www.cdc.gov/eis/field-epi-manual/chapters/Qualitative-Data.html ↵
- Goldberg M, Melchior M, Leclerc A, Lert F. (2003 Sept). Epidémiologie et déterminants sociaux des inégalités de santé [Epidemiology and social determinants of health inequalities]. Rev Epidemiol Sante Publique, 51(4):381-401. Available at: https://pubmed.ncbi.nlm.nih.gov/13679732/ ↵
- Kesteloot H. (2004). Epidemiology: past, present and future. Verh K Acad Geneeskd Belg. 66(5-6):384-405. From https://pubmed.ncbi.nlm.nih.gov/15641567/ ↵
- Al-Maskari, F. (n.d.). Lifestyle diseases: An Economic Burden on the Health Services. United Nations, Chronicle. From https://www.un.org/en/chronicle/article/lifestyle-diseases-economic-burden-health-services ↵
- CDC. (n.d.). Lesson 1 Understanding the Epidemiologic Triangle through Infectious Disease, pdf material. From https://www.cdc.gov/healthyschools/bam/teachers/documents/epi_1_triangle.pdf ↵
- Rivier University. (n.d.). What Is the Epidemiologic Triangle? From https://www.rivier.edu/academics/blog-posts/what-is-the-epidemiologic-triangle/ ↵
- Tsui, B., Deng, A., & Pan, S. (2020). COVID-19: Epidemiological Factors During Aerosol-Generating Medical Procedures. Anesthesia and analgesia, 131(3), e175–e178. From https://www.ncbi.nlm.nih.gov/pmc/articles/PMC7302069/ or, https://doi.org/10.1213/ANE.0000000000005063 ↵
- No author. (n.d.). Example web of causation for PSA test. Wikimedia Commons. From https://commons.wikimedia.org/wiki/File:Example_web_of_causation_for_PSA_test.jpg ↵
- CDC. (n.d.). Social Determinants of Health: Know what affects health. From https://www.cdc.gov/socialdeterminants/ ↵
- Agrawal, A., Aadesh, G., Kaivalya, D., Supriya, K., Punit, F., Nazli, K. (2021). A Comparative Analysis of the Spanish Flu 1918 and COVID-19 Pandemics. Open Public Health Journal, 14 (1), 128-134. From https://doi.org/10.2174/1874944502114010128 ↵
In principle, 'health phenomena' refer, to the phenomenology of health, which is a more holistic approach than the classic medical model, which emphasizes the concept of health as the absence of disease, but we know, it is more than that.
It refers here to the focus of epidemiology, which is the 'population' in contrast with the clinical model that focus on the individual.
The term refers to interrelated areas of sciences, which originally were called, 'disciplines'.
Data collected through observations, narratives, life stories, observations, in depth interviews, focus groups, etc.
Quantification is one of the strongest characteristics of epidemiology. It refers to the use of numbers and statistical analysis used to make data meaningful.
diseases that are linked to the way in which people live, for example, cardiovascular diseases and cancers.
the systematic collection, analysis and dissemination of health data for the planning, implementation and evaluation of public health programmes.
an increase (or, excess) in the frequency of a disease (the term applies mostly to infectious diseases).
The word model is used instead of explanation. For example, the initial explanations of causality.
The term is used to identify the cause of the disease (a.k.a. ‘agent’
A disease is the abnormal condition that negatively affects the structure or function of all or part of an organism. In general, the term refers to infectious diseases.
A term commonly used to refer to those 'diseases' that are not infectious, for example, mental disorders.
It refers to the 'cause' of the disease.
The living organism that contains the disease, or, that carry the disease.
The way in which the disease is spread of transmitted from an organism to another, for, example, water borne (transmitted by water).
The route of 'entry' into the living organism, for example, contaminated water and parasites [the entry is by the mouth/oral].
It is another word used to refer to the agent, or, cause of the disease.
Related to the pathogen, or, the agent that causes the infection.
The series of factors that are involved in this process of disease development.
To measure the variable in a qualitative or, quantitative manner. For example, a health index.
it is a disease that occurs during certain seasons, or, times of the year, and then, it declines.
The disease that started as an epidemic has crossed borders international, and it is now in almost all countries in the world, or, all countries in the world.
A disease that has a permanent or, constant prevalence in a region, or, a specific area in a country, or, region.
An endemic disease that affects mainly the population of children in a specific region/country of the world.
An endemic disease that had reached epidemic dimensions due to the increased number of cases.
The most common model used to identify medical and public health interventions mainly for infectious diseases and chronic diseases such as cancer.
Activities developed to prevent the development of disease, or, to detect the disease in an early stage.
When the symptoms appear or, are evident and the person seeks health care.
A series of interventions to regain functionality and have a better quality of life. It is the rehabilitation stage.

Feedback/Errata