Part II
6 Basic Epidemiological Methods and Calculations
Learning Objectives
By the end of this chapter, the learner will be able to
- Introduce the most common methods of disease frequency in epidemiology
- List common epidemiological methods of disease frequency: counts, proportions, ratios, rates, prevalence and incidence
- Apply the concepts of disease frequency in the analysis of results from epidemiological research studies
- Summarize the uses of prevalence, and incidence data in epidemiology.
Epidemiology as a quantitative science
As it has been briefly mentioned in previous chapters, epidemiology is mainly a quantitative science. And, although this is changing in recent years in which more qualitative research is becoming more accepted, and available; most professionals in the field accept that epidemiology is by nature, quantitative. So, what does it mean? It means that a quantity is used; epidemiology uses numbers (values), applied statistics, and other mathematical concepts to describe, analyze, and interpret health phenomena/events. [1]
Prevalence, incidence, counts, proportions, ratios and rates
Common epidemiological quantitative techniques/methods include counts, proportions, ratios, rates and prevalence, and incidence.
 |
| “Woman who counts money,” By Jan Chalon. Image from Look and Learn. Public Domain Dedication (CC0 1.0) |
Counts
In some cases, and especially for the recording of data about some diseases (these include mainly rare diseases or those that had appeared in the twentieth century – such as the case of Ebola in the seventeens (Ebola virus was first described in 1976 near the Ebola River in what is now the Democratic Republic of the Congo) [2] In this case, all it can be done at that time is to record a count since the affected people represented only one small number, such as 1 case of Ebola. For example, in the past, we used Ebola, which was very rare in the eighties; 1 case of Ebola was reported in 1976, with zero mortality at that time. [3]
A similar situation happened when the first cases of anthrax in the U.S. were reported, just after the September 11 New York attacks. [4] When the initial publications appeared, they referred only to 11 cases of anthrax. [5] As time passes, and more cases are detected, and aggregated, the count may become higher, but it is usually not high enough to do more than just count the number of cases. No statistical analysis is needed in these mentioned situations.
Ratios
When there is need to compare one number against another, in epidemiology, it is customary to use the ratio, which is a fraction (consisting of both numerator and denominator). A ratio is basically one quantity divided by another. There is no specified relationship between numerator and the denominator. The relationship is specified in the context of the problem that wants to be represented.[6]
The most common ratio is to compare the presence of a health problem among women compared to men. And, it is said, for example that breast cancer affect mostly women and just few men. As a quantitative expression, this can be said for example that comparing women to men, women have 100 times the possibility to have breast cancer compared to 1 men, expressed quantitatively, 100:1 or 100 to 1. [7]For this reason, it is said that ratios help to assess the impact of for example a health phenomena, commonly diseases as they are affecting people.
Proportions
If more meaning wants to be added to a ratio, then, the proportion is used. Since, a proportion is a measure that states a count relatively to the size of the group; a proportion is basically a ratio in which the numerator is part of the denominator. [8] That is the reason that it is said that, a ratio is a type of proportion that may be expressed as a percentage to help people better understand the meaning of the proportion, especially for health education purposes since most people are familiar with percentages but no with proportions.
Proportions are commonly used to describe the amount of disease that can be attributed to a particular exposure. For example, on the basis of studies of smoking and lung cancer, public health officials have estimated that greater than 90% of the lung cancer cases that occur are attributable to cigarette smoking.[9]
 |
| “Smoking Man,” By Jan Chalon. Image from Look and Learn. Public Domain Dedication (CC0 1.0) |
Key Takeaways
Rates
If we put together the concepts about a ratio with the concept of a rate, it can be said that, a rate is a ratio that consists of a numerator, and a denominator in which, time forms part of the denominator. Adding the time dimension makes the concept of rate different from the rest of the concepts mentioned before. In addition, a rate contains the following: disease frequency, unit size of the population, and the recording of the time period in which the health event occurs. Examples of rates will be provided in detail later in this chapter.
Moving beyond the basics
The concepts of counts, ratios, proportions, and rates have its application in epidemiology as they are the foundation -concepts that help to understand two more important measures of disease frequency: prevalence, and incidence.
Prevalence
When there is need to measure the presence of disease/or, any other health phenomena, the most common measure that incorporates the time dimension (as it is the case of the definition of rate above) is, prevalence, which is defined as the number of existing cases of a health problem, or, health condition in a specific population at a certain (specific) time. The time dimension can be expressed in seconds, minutes, hours, days, etc.
As we can see from the definition, there is need to understand the concept of case here (this concept will be explained more on detail as the content in this book progresses), but for practical reasons, a case is a set of standard criteria that helps to identify those individuals/groups or, population who have been affected by a health problem or, phenomena. In general, the definition of a case can be obtained from the medical literature, or, from the local public health departments.[11]
Key:
Total population = or, study population
The Multiplier = it can be 10, 100, 1000, 100, 000 etc.
Unit of analysis = people, study subjects, experimentation animals, etc.
Example of a hypothetical study: In March 2010 a study on tuberculosis began, the target population is a recent group of immigrants located in the south side of St Cloud, MN. From this population, the study enrolled 500 individuals, and from this group, 50 residents were identified as confirmed cases of pulmonary tuberculosis. What is the prevalence of tuberculosis in this population?
In some cases, people prefer to use the percentage to communicate the results, so, another way to report the results is to say that 10% of the study population had tuberculosis.
Other elements added to this formula
When the variable time is added to the formula (after the multiplier and unit of analysis), it helps to classify prevalence in two types: 1) Point, which refers to a point in time; and 2) Period prevalence or, the range of time is recorded and used in the calculation. When the data is sufficient in the calculation of the period prevalence, the variable time can be recorded/described in hours, days, weeks, months, years, etc., depending on the type of health event being described. The formula for Point prevalence is presented below:
Example:
Following with the previous example and looking at the beginning of the study specifically on March 1st, 2020, the study investigators were able to identify 5 cases, which basically refer to individuals who already had tuberculosis before they were enrolled in the study. This information can be used to calculate the point prevalence (or a point in time), then, using the formula
At the same time, if the duration of the investigation, or, the data collection period is known, the period prevalence can be calculated.
Using the same information example from above and knowing that, the study lasted 2 years, and now that this information is known, the result above can have an additional piece of information, which is the 2-years period in which a total of 50 individuals were identified with pulmonary tuberculosis. Using the formula above, the following is calculated:
Period prevalence = (50/500) * 100 = 10/2 = 5 per 100 pop in a period of two years.
As seen in the result, the period prevalence added new meaning to the initial information provided by the simple prevalence calculation.
Prevalence and incidence
Prevalence and incidence are common measures of disease frequency used in epidemiology. Prevalence can be calculated in three ways: as a general measure, or, just as ‘prevalence’; as a point in time, ‘point prevalence,’ or, during a specific period of time, ‘Period Prevalence.’
Prevalence common uses. It is accepted that prevalence can be used to assess/evaluate the following characteristics of populations: to estimate the frequency of an exposure to for example an infectious agent, or, chronic problems such as cancer, or, cardiovascular disease. Also, to describe the burden of a health problem (which is the same as evaluating the impact of that health problem in the community); and determining allocation of health resources such as number of beds in a local hospital for specific health conditions; or, to identify the number of healthcare facilities, and health care personnel available to treat, or, prevent specific health conditions/problems.[12]
Incidence
Another way to express the prevalence of a disease, or, health phenomena is to calculate its incidence. The formula for incidence can help define it:
Key:
Population at risk = this is the segment of the population, who is affected by the health phenomena.
The Multiplier = it can be 10, 100, 1000, 100, 000 etc.
Unit of analysis = people, study subjects, experimentation animals, etc.
In this manner, it has been also said that, that prevalence and incidence can be seen as the waterfall that feeds the pond. Recently, I’ve found another analogy which is illustrated below:
 |
| Incidence and prevalence Image from Williamson, G. [13] |
As can see in this image, the drops of water that feed the pool (are the new cases), and the water drops that fill the container are the total number of cases (new and old).
To calculate the incidence of the same hypothetical study used above, the following information is used:
The study that began in March 2010 lasted two years, with an initial number of 5 cases detected just at the beginning of the study. Over the years, an additional number of 45 confirmed tuberculosis cases were found, these cases also belong to the total number of of 50 cases reported at the end of the two years. This information is used to calculate the incidence.
The result of the calculation shows that the incidence measures the progression of the disease, and the impact of the accumulation of cases in the calculation results.
Point prevalence, or, incidence are very useful to quickly assess the public health problem in a community, but for health care planning, for example how many beds are needed for a specific health problem, a period is most useful, because it helps to get an idea of the impact of the health problem on the community.
Additional example applying the concept of Prevalence and Incidence
Suppose that in January 1996, 1000 adult residents of a community accepted an invitation to be examined for hypothyroidism at a local clinic. Eight persons were found to have the disease, it was newly discovered in 3, and 5 were already under treatment. The same group was examined again in January 1998. Six new cases of hypothyroidism were discovered; of these, two had developed symptoms several months before and had been diagnosed and treated by their personal physicians. It was learned that of the 8 hypothyroid persons discovered at the 1996 examination, one had discontinued medication and died of myxedema heart disease in 1997. Otherwise, all persons examined in 1996 came to the second examination. [The information provided in this example has been adapted from Friedman. Primer of Epidemiology.[14]. Also, the same example can be found in a packet of ancillary materials prepared by G. Antunez and available at Opendora Minnesota.[15]
Using the above information, respond to the following questions – don’t forget to use the formulas already provided in this chapter:
- What was the prevalence of hypothyroidism, treated or, not, in the examined group in January 1996? In January 1998?
- What was the annual incidence of hypothyroidism in the group?
- What was the 2-year period prevalence of hypothyroidism?
- What was the case fatality rate of hypothyroidism?
- Of all cases detected at the two examinations; what proportion was newly discovered?
- If only 900 of the original 1000 persons were still living in the community and came to the examination in January 1998, would any of your answers to the questions above be changed? If so, how?
Note: no answers for these questions are provided in the book. Please work on the responses, and consult with your class instructor if your answers are appropriate (or, correct).
A Summary of the differences between prevalence and incidence
In addition, if can be said that the main difference between prevalence and incidence is that incidence records, the number of new cases, and integrates the concept of population at risk. To help understand this concept, a comparison between incidence and prevalence is probably useful.
| Prevalence | Incidence | |
| Calculation incorporates in the numerator | All cases (old and new) | Only new cases |
| Calculation incorporates in the denominator | All population (every one) | Only population at risk |
| In terms of the variable time | It is usually a point in time | It incorporates periods, intervals, etc. |
| Reflects the event as | a snapshot of the disease/health event | a movie/video recording of the disease/health event |
Note: Table created by the author using what it has been learned by years of teaching on the subject are, and consulting different sources.[16]
Incidence and the variable time
In the case of incidence, time is essential. Since we want to know the progression/or, stopping of the ‘new cases’ during specific intervals/or, periods of time; it is possible to record, and report incidence in terms seconds, minutes, hours, days, weeks, months, years, decades, etc.; and this property of incidence makes the measure very useful in the control of disease, especially infectious diseases that depend a lot of the amount of time of its existence, or, presence in the community. But also, the variable time is important for the reporting of chronic diseases, for example, we want to know the survival rate of certain type of cancers; or, the number of disability years that mental health disorder can bring to the individual suffering from it.
Incidence = Number of New Cases/Population at risk x multiplier that includes the unit of analysis in a time period
Key:
The time period = it can be specific intervals/or, periods of time. For example, it is possible to record, and report incidence in terms seconds, minutes, hours, days, weeks, months, years, decades, etc.
Prevalence, incidence, and place/location
Besides the variable time, when is time to calculate prevalence, or, incidence, it is also useful to provide information about place/location of the health event. The most common places/locations used to report prevalence and incidence include: country, region, continents, and other geographic locations. However, we can use also spatial locations to report some health phenomena, or, events. Examples of these concepts are presented in the table below:
| Variable (type of place/location) | Example | The place/location here is |
|---|---|---|
| Country | Prevalence1 of type 2 diabetes in the United States | The entire country, or, the U.S. |
| Region | Prevalence of asthma attacks in school children in the Midwest | The Midwest region in the U.S. |
| Continents | Prevalence of Malaria in Africa | The continent is Africa |
| Spatial | Prevalence of Depression in Urban Settings | The category, urban can be applied to any any urban location, or, place in the U.S., the continent. The term urban here implies more than the physical location. |
Note: Table created by the author using what it has been learned by years of teaching on the subject area, and consulting different sources.[17]
Note1: to avoid confusion with the examples presented in this table, I only used the word, ‘prevalence,’ but the examples apply also to incidence. For example, the incidence of type 2 diabetes in the U.S.
When to add the time information?
For both (point prevalence or, point incidence), the place, or, location can be added depending of the amount of information that is requested, or, needed. A common combination include, point in time, and location. For example, prevalence/or, incidence of obesity in the U.S. general population in 2019. In a most specific manner, the same information can be presented by adding specifics about age of the population, for example, prevalence/or, incidence of obesity among school children K-12 in the U.S. in 2019. Multiple combinations can exist by using place/location, age, gender, and other related factors. An image is presented below as an example of the prevalence of obesity among the adult population in the U.S. in 2020. The image is also part of the publication. [18]
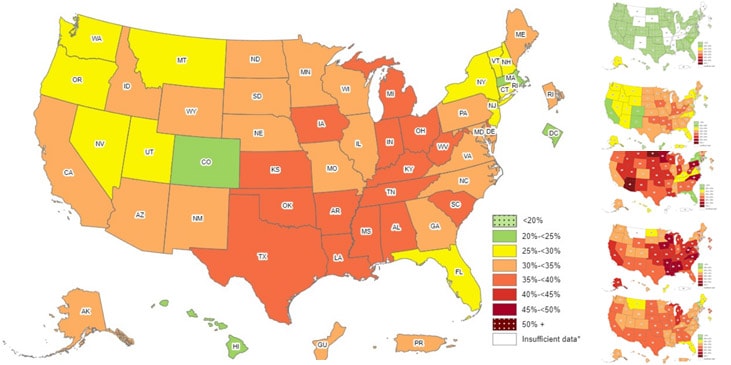 |
| “Adult Obesity Prevalence Maps”. Centers for Disease Prevention and Control (CDC). |
As the image shows, we can easily identify where the health problem of adult obesity is found at the state level in the country. Prevalence information is commonly used to develop this type of images/maps.
Applications of Incidence Data
The concept of incidence has an important application, which is the calculation of rates.[19] Rates are used to express the incidence of disease in a population. Why do not use prevalence instead? Prevalence is used to assess the extent of health phenomena mainly disease in a population, but it only allows to see an incomplete picture of the problem while incidence, especially expressed as rates is very useful to assess the impact or, extent in which the disease or health phenomena is affecting the population. It can also be used to assess possible etiological causes.[20]
Additional resources
Rates
Since they are based on the same formula of the calculation of incidence; the numerator reflects the number of specific cases, and the denominator captures the segment or total of a population who have been exposed to the health phenomena or, disease.[22] In this manner, the following is the general formula for a rate:
Key: Population at risk = this is the segment of the population, who is affected by the health phenomena.
The Multiplier = it can be 10, 100, 1000, 100, 000 etc.
Unit of analysis = people, study subjects, experimentation animals, etc.
Crude versus Specific Rates
When a rate is expressed as an analysis of the impact of disease/health phenomena in a population without taking into account much specifics, then, the rate is referred as ‘crude.’ It is crude because is not specific, it just point to the need to intervene, and to go into more detail in the exploration of the situation or health problem. That is the main reason, the specific rates are preferred if available. Specific rates are usually calculated using common variables such as age, gender, ethnicity, and other demographic characteristics that help to express the impact of these factors (variables) among the affected population. So if available, specific rates are preferred to crude rates. And, when the information needs to be more and more specific, there is need to adjust the information in order to eliminate the confounding factors, and the method to assess this is to use adjusted statistics, which gives the name to a third type of rates, the adjusted rates.[23] [24]
What are the most common rates used in epidemiology?
The most common use of rates is to study the impact of health phenomena (disease or not disease, healthy people and other characteristics of wellness) among populations and inside these population, there is need to find out who is affected, what gender, what age group, etc., is affected by a health problem or disease, or who are the healthy individuals in common population groups. For example, maternal and child health programs want to know how many women are pregnant, and how many of these women are giving birth to healthy babies. Rates are used to report this information, and that is the reason for the calculation of rates among those women who for example completed their pregnancy and deliver healthy babies. In this context, some of the most common rates are those related to maternal and child health. Examples include, the birth rate, fertility rate, infant mortality rate, maternal mortality rate and others.[25] It is also important to note that for the content of this section, the main focus will be on Crude, and Specific Rates, and most of the time, mortality rates.
Examples of common rates calculation
For the following examples, most of the information is provided here, but in other cases, there is need to find the information by searching the National Census, the CDC, or, any other source of credible information.
Example 1: There were 1,986,000 deaths in the United States in 1982. What additional information is required to compute the crude mortality rate for 1982? To complete the calculation, here is the formula (which is a modified form of the one presented above).
Note: The information for the U.S. in 1982 can be found at the United States Census Bureau.[26]
Example 2: The following is hypothetical data: A city has a population of 100,000 people (45,000 males and 55,000 females), and 1,000 people die per year (600 males, and 400 females). There were 50 cases (40 males, and 10 females) of lung cancer per year, of whom 45 died (36 males and 9 females). With this information complete the following calculations
a) Crude mortality rate
b) Sex-specific mortality rate
c) Cause-specific mortality rate for lung cancer
d) case fatality rate for lung cancer
Note: For each calculation above, a modified version of the general formula (provided in the example 1) needs to be created by the reader/student.
Health Indicators
There are a series of rates that are used to assess the overall health of a population, especially the group of children and women in a society. The results of these rates are used as ‘indicators’ of the health of a population or, group. [27]For example, is important to know how many children are born alive as it is also important to find out how many children are born death; and the results of these rate calculations are the ‘indicators,’ which ‘indicates’ the health of the overall population. The following are the most common on these indicators:
Birth Rate
As discussed before in this chapter, the birth rate can be expressed as crude or specific (less common in this category) being the most common, the crude birth rate, which is expressed in the following formula:
Note: in this formula to complete the calculation, it is customary to use 1, 000 as the multiplier. Please note that only the ‘live births’ are included in the numerator. Also, in this case, the crude rate is the only ‘necessary’ calculation since the numerator is already ‘specific,’ only those babies that are born alive.
In the following image, a decline in the overall birth rate has been observed progressively in the United States.
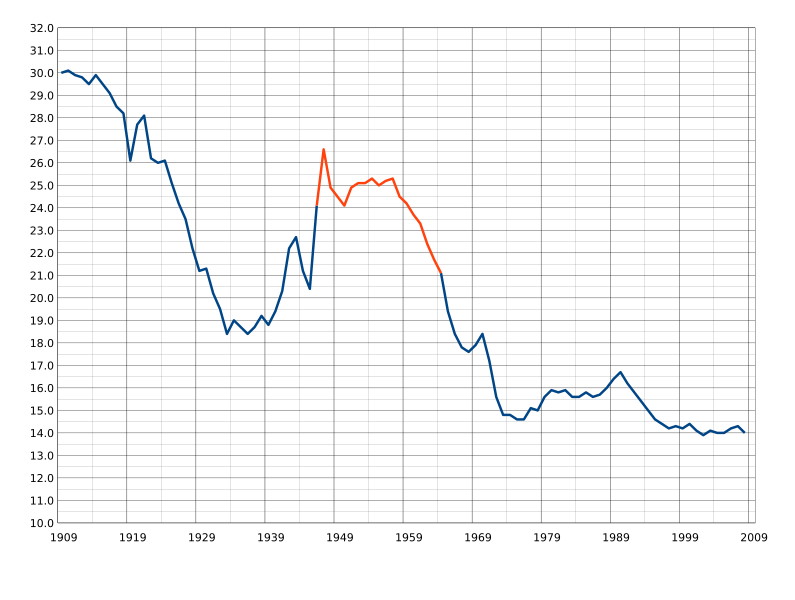 |
| United States Birth Rates. No author. Source. Image licensed CC SA. |
Fertility Rate
This type of rate is commonly used by demographers, and organizations that work in the health of women because it is important to know how many women in the population are in reproductive age, which means able to become pregnant, which increases the population and the need for health services especially, reproductive health. The formula is:
Note: It is important to note in this formula and in the denominator the specific target group is only those women who are considered (medically and for public health purposes) in reproductive age or aged 15-44.
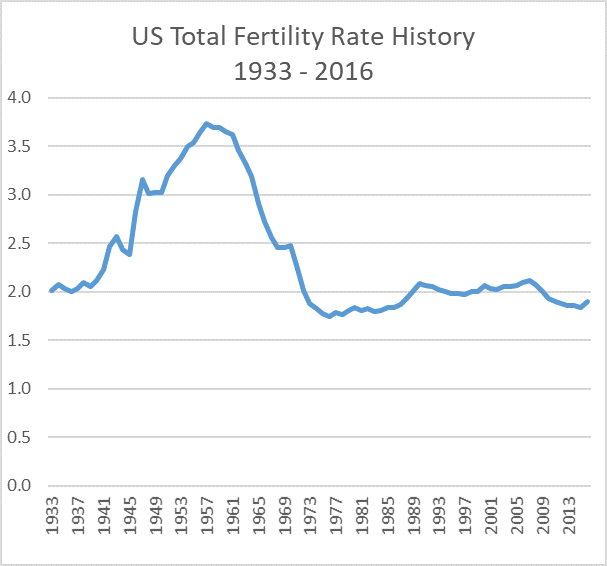 |
| United States Fertility. No author. Source. Image licensed CC SA. |
As seen in the graph/image above, the Fertility rate in the U.S. is in decline (In 2020, the U.S. TFR dropped to 1.64, the lowest level ever recorded), the same is happening in another major countries in the world. [28]
Fetal Mortality Rate
In the calculation of this rate, the numerator is represented by the numbers of children who died during the fetal period of life. In this case, there are at least two types of rates in this category, ‘fetal death rate’ itself, which is similar to ‘early fetal death,’ and the ‘Late fetal death,’ calculation formulas are included below:
Note: The term, ‘fetal’ is used in this formula instead of ‘children’ because medically a child that has not been born is a fetus. This may bring disagreement in the society, but appropriate or not, the term, ‘fetus’ is still the term in use in science. Also as it is accepted in medical sciences, a fetus that die when it is less or, equal to 20 weeks of gestation is considered a miscarriage (or, spontaneous abortion), or, abortion if it is not spontaneous. Finally, it is important to note (in the above formula that the denominator include the ‘live births’ and not only the ‘fetal deaths’. The multiplier in this case is by convention the 1,000 and the result does not have to be labeled in the unit of analysis category.[29]
Fetal mortality has been in decline in recent years in the U.S. as an article from an article published by U.S. News. [30]. The data on the article is based on data provided by CDC, which include images and tables not shown here for reasons of system’s compatibility. [31]
Late Fetal Death Rate
Note: The emphasis here is in the word, ‘late’ which is a fetal death that occurs after 28 weeks of gestation. Again, the multiplier in this case is by convention the 1,000 and the result does not have to be labeled in the unit of analysis category.
As a complement to the rates calculation, it is also customary to calculate the ratio of the ‘fetal death’ category. Again, in this case it is a ratio (not a rate), the formula is presented below:
Note: As noted above, in this case (ratio calculation), the denominator does not include the fetal deaths as it is the case of the fetal death rate.
Infant Mortality Rate
The infant mortality rate is highly recognized in public health and that is because it is an important measure (that reflects) the overall health of a population since for every child that dies, there is also a mother who lost her child, and the reasons for the loss are reflected but the quality of care that a pregnant women receives in a specific society. There are people who believe that just by knowing the infant mortality rate (and the mortality rate too, which is presented later), a person can judge (or, evaluate) the overall health care and social system of a country. To calculate the infant mortality, the following formula is used:
Note: It is customary (commonly used) that the multiplier for the infant mortality rate is set to 1,000 live births.
The CDC reported in 2019 that the infant mortality rate in the United States was 5.6 deaths per 1,000 live births, which represent 558.3 infant deaths per 100,000 live births, which did not change significantly from the rate in 2018.[32]
The state of Minnesota has a lower infant mortality rate, or, 4.47 deaths per 1,000 live births[33], which reflects that the state of Minnesota cares a lot compared most states in the U.S.
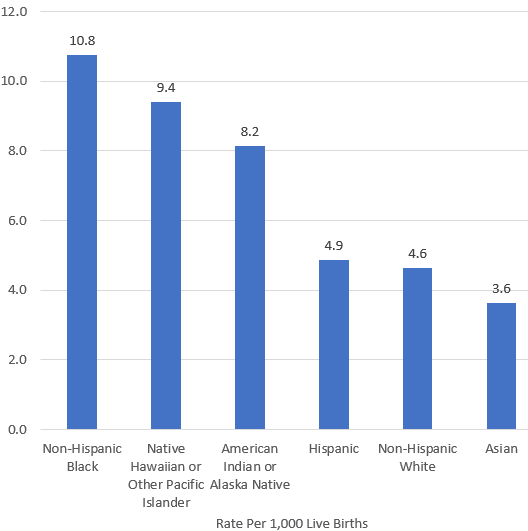 |
| Infant Mortality Rate Ethnicity by Race 2017. No author. Source. Image licensed CC SA. |
Going deeper in the infant mortality indicator
For medical and public health interventions, the calculation of additional rates in different stages of the live of children is also considered important and useful. The following calculations related to this category follows:
Note: It is customary (commonly used) that the multiplier for this type of calculation is set to 1,000 live births.
Postneonatal Mortality Rate
Note: It is important to note that the neonatal number of deaths is required before the postneonatal mortality rate is calculated.
Perinatal Mortality
There is also two more calculations that are related to this category and that are used to evaluate the health of children during gestation and the first month of life. For these purposes, the perinatal mortality rate and ratio are used. To work on these this calculations the following formulas are used:
Note: It is important to note that the above is a rate and below is the ratio. Also, in the result the label used for the unit of analysis is both, live births and fetal deaths.
Perinatal Mortality Ratio
Note: It is important to note that the ratio calculation the denominator contains only the live births (excluding the fetal deaths).
The calculation of the perinatal mortality rate and ratio exists because in many cases, and in most countries of the world, there is insufficient or, no data that records late fetal deaths, making difficult if not impossible to calculate the rate, making the ratio calculation the most practical.
The author could not find an image that could be used for each one of the categories discussed above, but there is graph/image that gives an idea of the frequency of these types of deaths. See below:
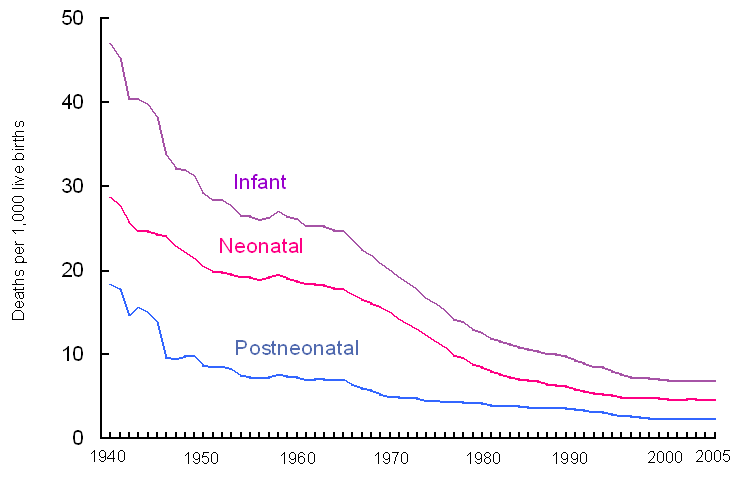 |
| United States Neonatal death. No author. Source. Image licensed CC SA. |
Note: although the title of the image is not included in the graph presented here, the most appropriate title could be something as: “Deaths related to childbirth in the U.S. – A comparison).
The health of the mother
As it is important to assess the health of a child – calculations have been presented above, it is also important/crucial to assess the health of the mother, especially when there is a death of a woman due to or, related to childbirth. The formula for this calculation is presented below:
Note: It is customary that the multiplier for the maternal mortality calculation is 100,000.
Maternal mortality is a strong health indicator of the health care conditions of a country, especially in issues related to pregnancy and childbirth. The more dissaraged a system is, the maternal mortality rates are high. It also reflects how poverty levels and distribution of wealth and care of women in a country or, region in the world. Based on this, it is accepted (although it is not always the case) that developed countries have lower indicators of maternal mortality (and also infant mortality) compared to developing countries.
Presenting visual examples of the problem of maternal mortality is always useful, and it is the case for example of the United States, which has seen a dramatic decline in maternal mortality from the 1900s to 1990, a graph with this information is presented below:
 |
| Maternal Mortality in the United States from the 1900s-1990. No author. Source. Image licensed CC SA. |
The dramatic decline is not as dramatic when more current data is researched, here is one example:
 |
| Maternal Mortality By year. No author. Source. Image licensed CC SA. |
Although, the authors of this graph used the ratio instead of the rate, the information is good enough to make the following point: now, looking at these data, it is clear that the decline that seen so dramatic, it is not. In this publication the maternal mortality for that time period (1967-1996) was also reported as to be 3.3 maternal deaths per 100,000 live births. [34] Looking at the numbers on maternal mortality clearly show that the United States needs to make investments to improve the health of women, so, the maternal mortality is in reality declined. These mentioned investments should include above all, better health care system, with improved access to those women living under poverty, and who also are excluded from society such as for example homeless women.
A proof of the need to improve the health of women in general (including the decline of maternal mortality) is part of the healthy people 2030, which uses the current statistics, the United States Maternal mortality is 17.4 maternal deaths per 100,000 live births (2018), and this is used by the HP 2030 committee as the baseline data, with a desired target of reducing this indicator by 15.7 per 100,000 by the year 2030. [35] Over the years, I had a class activity/computer lab that asked students to find the current data on maternal mortality and it has been always difficult, which for me, it shows that even data access about maternal mortality needs to be improved.
 |
| Trends in pregnancy related mortality in the United States. No author. Source. Image licensed CC SA. |
Practice calculations: Examples of some mortality indicators
Using data from the National Census, the CDC, or, any other source of information that is accepted as credible calculate the most common type of mortality indicators:
a) Infant mortality in Minnesota in the year 2005 (use the formula provided before in this textbook, and search for the numbers needed to complete the calculation.
b) Neonatal mortality in the U.S. in the year 2005 (again, use the formula provided in the textbook, and find the numbers to do your calculation).
c) Maternal mortality in the U.S. in 2005.
Note:
1. To find the numbers to complete the calculations, search the United States Census Bureau.[36].
2. For all of the calculations above, be sure to always state the unit of analysis, for example, for infant mortality and neonatal mortality use the 1,000 live births, for maternal mortality, 100,000 live births (during a year).
Specific Rates
In this category the topic of specific rates is covered with the addition also of the proportional mortality ratio. Both categories of calculations are useful to be more specific about for example, the ‘specific’ characteristics of the general population, or, a population segment or, study population. The formulas that follow cover these topics:
Cause-Specific Rate
The cause-specific rate is useful to assess the impact that specific diseases or, any other health phenomena has a specific population group. The formula follows:
Note: the term ‘midpoint’ refers to for example, mid-year, or at the end of June. It has been found that statistically, most populations double their size in the second six months of the year (end of december). For this formula then, if the total population is known, the midpoint is found by dividing the number by 2. The use of the total population for the calculation is also acceptable.
As it is common to find the cause-specific rate, the age-specific rate is also common. The formula is:
Note: the term ‘segment’ refers to the group of people included in the calculation based on their age. Age frequency intervals are used to specify the age group. For example, the people (in the study population) whose age is 5-10 or 11-15, etc.
In addition, there is one more calculation in this category of calculations covered in this chapter, and it is the Proportional Mortality Ratio. As the name implies, it is a ratio (not a rate). The formula is:
Note: the PMR multiplier it is by convention 100, which means that is a percentage (this is different compared with the rest of the calculations presented in this chapter). Also it is important to note that the mortality mentioned in the numerator has to be the same population included in the denominator.
Among other things, the PMR is not a measure of the risk of dying of a particular cause, it is in reality and indicator (in the study population) of the relative importance of a specific cause of death. It is commonly used to create the public health report known as, ‘the 10 major causes of death in a population, or, country.’ In general 10 causes are reported, but it can be more, for example 12 causes of death. It all depends of the main reason of the publication of this information, which is usually important for policy makers, and health care providers among others.
Adjusted Rates. The topic of adjusted rates is not be covered in this textbook, but the reader/learner can find more about it in the majority of advanced epidemiology textbooks.
For additional reading on the concepts discussed in this chapter
An overview of the concepts discussed in this chapter can be found online for free. Use this for consultation.[37]
Summary
This chapter has covered what it commonly called, basic epidemiological methods, which although seem to be simple compared to more advanced epidemiologic calculations methods, they represent the foundations of more complicated calculations. The chapter covers counts, ratios, proportions and then, the concepts of prevalence and incidence. Examples for all of these calculations have been provided in this chapter. It is also recommended that the student use the provided examples to expand on the concept, and practice more examples from the main sources of reference contained in this chapter. One great resource is free and it can be found online at the book, Epidemiology Kept Simple, whose link is provided above this summary.
- Hernandez JBR, Kim PY. Epidemiology Morbidity And Mortality. (2020 Oct 13). In: StatPearls [Internet]. Treasure Island (FL): StatPearls Publishing; 2021 Jan–. PMID: 31613448. Available at https://www.ncbi.nlm.nih.gov/books/NBK547668/ Note: this above reference refers to the origins of the term 'epidemiology' and also epidemiology as a science but half of the article is also about common calculations in epidemiology. ↵
- Centers for Disease Control and Prevention (CDC). (n.d.). History of Ebola Virus Disease (EVD) Outbreaks, from https://www.cdc.gov/vhf/ebola/history/chronology.html ↵
- Emond RT, Evans B, Bowen ET, et al. (1977). A case of Ebola virus, British Medical Journal, 2(6086):541–544. From https://www.bmj.com/content/bmj/2/6086/541.full.pdf ↵
- Centers for Disease Control and Prevention. (n.d.). History of Anthrax, from https://www.cdc.gov/vhf/ebola/history/chronology.html ↵
- Brachman PS (2002). Bioterrorism: an update with a focus on anthrax. American Journal of Epidemiology, 155(11), 981-987. Also found at https://www.cdc.gov/anthrax/basics/anthrax-history.html ↵
- Centers for Disease Control and Prevention (CDC). (2012). Principles of Epidemiology in Public Health Practice, An Introduction to Applied Epidemiology and Biostatistics, Lesson 3 Section I. Third Edition. Available at: https://www.cdc.gov/csels/dsepd/ss1978/lesson3/section1.html ↵
- Cancer Treatment Centers of America. (2019). What’s the difference? Male breast cancer and female breast cancer. From https://www.cancercenter.com/community/blog/2019/07/whats-the-difference-female-male-breast-cancer ↵
- Centers for Disease Control and Prevention (CDC). (2012). Principles of Epidemiology in Public Health Practice, An Introduction to Applied Epidemiology and Biostatistics, Lesson 3 Section I. Third Edition. Available at: https://www.cdc.gov/csels/dsepd/ss1978/lesson3/section1.html ↵
- Centers for Disease Prevention and Control (CDC). (n.d.). Health Effects of Cigarette Smoking. From https://www.cdc.gov/tobacco/data_statistics/fact_sheets/health_effects/effects_cig_smoking/index.htm ↵
- Spronk, I., Korevaar, J.C., Poos, R. et al. (2019). Calculating incidence rates and prevalence proportions: not as simple as it seems. BMC Public Health 19,512. Available: https://rdcu.be/crLfC ↵
- USAID. (n.d.). Basic Epidemiology. Primary Health Care Initiatives (PHCI) Project Contract No. 278-C-00-99-00059-00 Abt. Associates Inc. Available at: https://pdf.usaid.gov/pdf_docs/PNADN010.pdf ↵
- No Author. (n.d.). Measures of disease frequency and disease burden available at: https://www.healthknowledge.org.uk/e-learning/epidemiology/practitioners/measures-disease-frequency-burden ↵
- Williamson, G. (3 March 2016). Incidence and Prevalence. Categories: Research Methodology from https://www.sltinfo.com/incidence-and-prevalence/ Direct link to the image: Image from https://www.sltinfo.com/wp-content/uploads/2016/02/incidence-and-prevalence-1200x600-c-default.jpg ↵
- Friedman, G. D. (2004). Primer of Epidemiology. (5th ed). New York, NY: McGraw-Hill Companies. ↵
- Antunez, G. (2022). Principles of Epidemiology Ancillary Materials. St Cloud State University. From https://opendora.minnstate.edu/islandora/search/Antunez?type=dismax ↵
- Centers for Disease Prevention and Control (CDC). (n.d.) Lesson 3: Measures of Risk, Section 2: Morbidity Frequency Measures. Principles of Epidemiology in Public Health Practice, Third Edition. From https://www.cdc.gov/csels/dsepd/ss1978/lesson3/section2.html ↵
- Ford, G. (6th November 2020). Prevalence vs. Incidence: what is the difference? From https://s4be.cochrane.org/blog/2020/11/06/prevalence-vs-incidence-what-is-the-difference/# ↵
- Centers for Disease Prevention and Control (CDC). (n.d.) Adult Obesity Prevalence Maps. From https://www.cdc.gov/obesity/data/prevalence-maps.html ↵
- No author. (n.d.). PH717 - Module 3 - Measuring Frequency and Association, Incidence. From https://sphweb.bumc.bu.edu/otlt/MPH-Modules/PH717-QuantCore/PH717-Module3-Frequency-Association/PH717-Module3-Frequency-Association4.html ↵
- Ward M. M. (2013). Estimating disease prevalence and incidence using administrative data: some assembly required. The Journal of rheumatology, 40(8), 1241–1243. https://doi.org/10.3899/jrheum.130675 ↵
- Centers for Disease Control and Prevention (CDC). (2012). Principles of Epidemiology in Public Health Practice, An Introduction to Applied Epidemiology and Biostatistics, Lesson 3 Section I. Third Edition. Available at: http://www.cdc.gov/csels/dsepd/ss1978/ ↵
- Boston University, School of Public Health. (n.d.). Summary of Measures of Disease Frequency. From https://sphweb.bumc.bu.edu/otlt/MPH-Modules/PH717-QuantCore/PH717-Module3-Frequency-Association/PH717-Module3-Frequency-Association4.html#headingtaglink_7 ↵
- No author. (n.d.). Standardized Rates of Disease, Crude Rates. From https://sphweb.bumc.bu.edu/otlt/mph-modules/ep/ep713_standardizedrates/ep713_standardizedrates2.html ↵
- Naing N. N. (2000). Easy way to learn standardization : direct and indirect methods. The Malaysian journal of medical sciences : MJMS, 7(1), 10–15. From https://www.ncbi.nlm.nih.gov/pmc/articles/PMC3406211/#:~:text=The%20difference%20between%20crude%20rates,as%20standard%20(Figure%201). ↵
- Health Knowledge. (n.d.) Rates and ratios used to measure health status including geographical, occupational, socio-economic position and other socio-demographic variations. From https://www.healthknowledge.org.uk/public-health-textbook/health-information/3b-sickness-health/rates-ratios-measure-health ↵
- United States Census Bureau. (2017). Data. From https://www.census.gov/data.html ↵
- Canadian Institute for Health Information. (n.d.). Health indicators. From https://www.cihi.ca/en/health-indicators ↵
- Population Reference Bureau. (May 6, 2021). Why Is the U.S. Birth Rate Declining? From https://www.prb.org/resources/why-is-the-u-s-birth-rate-declining/ ↵
- No author. (n.d.). Fetal Mortality Rate. From https://www-doh.state.nj.us/doh-shad/view/sharedstatic/FetalMortalityRate.pdf ↵
- Emerling, G. (2021). U.S. Fetal Mortality Rate Hits Historic Low The measure marks what federal researchers call ‘a major but often overlooked public health issue.’ U.S. News. From https://www.usnews.com/news/health-news/articles/2021-10-26/fetal-mortality-rate-hits-record-low-in-us ↵
- Gregory, CW., Valenzuela C., Hoyert, D. (October 26, 2021). Fetal Mortality: United States, 2019 Division of Vital Statistics, National Vital Statistics Reports, 70 (11), 1-20. From https://www.cdc.gov/nchs/data/nvsr/nvsr70/nvsr70-11.pdf ↵
- Kochanek KD, Xu JQ, Arias E. (2020). Mortality in the United States, 2019. NCHS Data Brief, 395. Hyattsville, MD: National Center for Health Statistics. From https://www.cdc.gov/nchs/products/databriefs/db395.htm ↵
- Centers for Disease Prevention and Control (CDC). (n.d.) Infant Mortality Rates by State. From https://www.cdc.gov/nchs/pressroom/sosmap/infant_mortality_rates/infant_mortality.htm ↵
- Centers for Disease Prevention and Control (CDC). (n.d.). Maternal Mortality -- United States, 1982-1996. From https://www.cdc.gov/mmwr/preview/mmwrhtml/00054602.htm ↵
- Healthy People 2030. (n.d.). Reduce maternal deaths — MICH‑04, LHI (Leading Health Indicators). From https://health.gov/healthypeople/objectives-and-data/browse-objectives/pregnancy-and-childbirth/reduce-maternal-deaths-mich-04 ↵
- United States Census Bureau. (2022). Data Census. From https://www.census.gov/ ↵
- Formulas from Epidemiology Kept Simple. (n.d.). Chapter 3: Epidemiologic Measures. Epidemiology Kept Simple. Third Edition. Available at: https://www.sjsu.edu/faculty/gerstman/eks/formula_sheet.pdf ↵
A complication of thyroid disease in which edema is appears in different areas of the body.
Rates are an application of the concept of incidence of disease in a population.
It refers to the 'cause' of the disease.
This expression is used to say that more specific formula is available.
the numbers are fictitious and are used only with the purpose of the current example (or, calculation).

Feedback/Errata