3. Water Powered Electricity
Turbines driven by the power of flowing water are used to generate electricity for hydroelectric, wave, and tidal power. Hydroelectric energy accounts for over 6% of U.S. electricity generation but wave and tidal power are new technologies that are mainly in demonstration or pilot plant production around the world and not yet used as major power generators.
3.1 Hydroelectric Energy
Hydroelectric power, or simply hydropower, uses the energy of water flowing in a river to generate electricity. This is most often accomplished by building a dam that blocks the flow of water allowing it to collect into a reservoir upstream of the dam. Water from the reservoir is then directed through a pipe (called the penstock) to drive turbines located within the dam structure and generate electricity (Figure 3C.3.1)
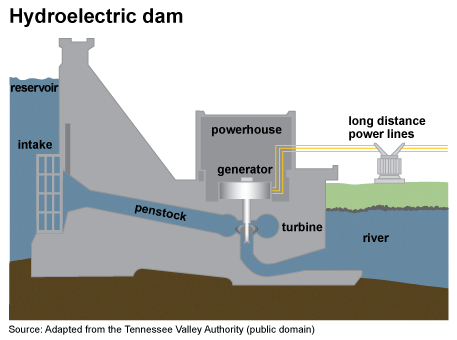
The volume of water flowing through the dam and the change in elevation from the reservoir to downstream side of the dam control how much energy is produced. This means larger dams with larger reservoirs can produce more energy over a specific time frame than smaller dams with smaller reservoirs.
Hydropower can produce large amounts of energy and can be used as a baseload energy source, one that can provide continuous, not intermittent, energy. The amount of water let through the penstock can be increased or decreased to generate more or less energy, respectively, as needed to meet energy demands.
While hydropower is renewable and unquestionably a cleaner energy source than fossil fuels, the reliance on dams creates greenhouse gas emissions and other environmental impacts as discussed in Chapter 2B.5.
A different type of hydropower that attempts to negate the impacts associated with large dams is run-of-river (ROR) hydropower. This can be defined as hydropower where inflow to the dam equals outflow from the dam over a relatively short period of time. The exact time frame over which these flows must be equal varies by country and the regulations that have been set there but can be almost continuous to over a period of a week. The simplest use of a system like this would be water wheels used to grind wheat at a mill. For power generation, however, this has a very different look that is often not too dissimilar from a traditional dam, albeit with a smaller reservoir.
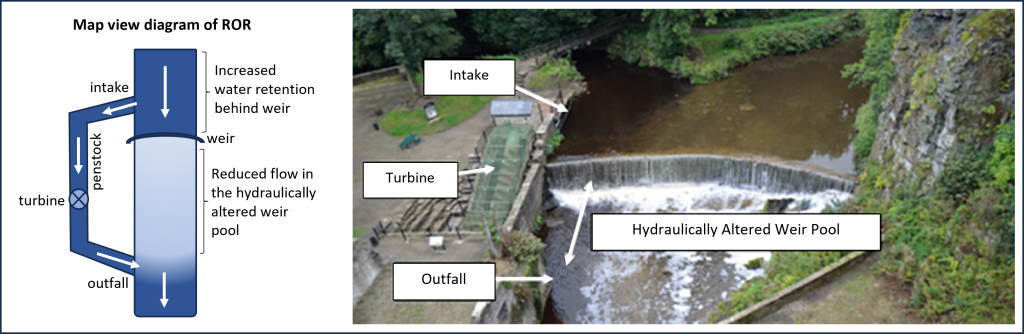
With ROR, a portion of water is diverted from the river into the penstock to generate electricity while the rest of the water can flow freely downstream. The method used to divert the water can range from a weir, where water is slowed down behind a small wall, pooling slightly upstream before flowing over the wall, to a full dam that allows water to run through it more consistently and freely than at a traditional hydropower plant (Figure 3C.3.2). The amount of water that is diverted through the penstock can range from minimal to about 95% of the river.
Because the water runs more freely in ROR, the size of the reservoir created is smaller than in traditional hydropower so less land is flooded behind the dam or weir. A smaller reservoir means the power plant’s output is impacted by water levels in the river, such that during times of drought or low water the power plant may not be able to produce sufficient energy to meet needs. The amount of land flooded can still be quite large though depending on the size of the ROR facility. The Dalles Dam in Oregon is a run-of-the-river hydropower plant that is among the largest 10 hydropower plants in the U.S. (Figure 3C.3.3). Emplacement of this dam created a 24 mile (39 km) long lake upstream of the dam, flooding the waterfalls that used to be present and inundating the former Native American community of Celilo.

Because water is more consistently flowing in ROR projects, the impacts associated with stagnant water in a reservoir, such as methane production and water temperature increases are reduced. However, because water is slowed behind the weir or dam, sediment still becomes trapped altering sediment supply to downstream locations. In addition, the presence of a weir or dam still impacts fish migration along the river.
3.2 Tidal Energy
Tidal energy converts the energy from flowing tidal currents into electricity. Tides are very long waves that move through the oceans generated by the gravitational pull from the Moon and to a lesser extent the sun. The combination of the gravitational pull from the moon and the centrifugal force created by the Earth-Moon rotation creates two large bulges of water, one directed towards the moon and the other exactly opposite the Moon. As the Earth rotates under these bulges of water, coastal areas experience high and low tides (Figure 3C.3.4). Most locations have two high and two low tides every day at very predictable times.
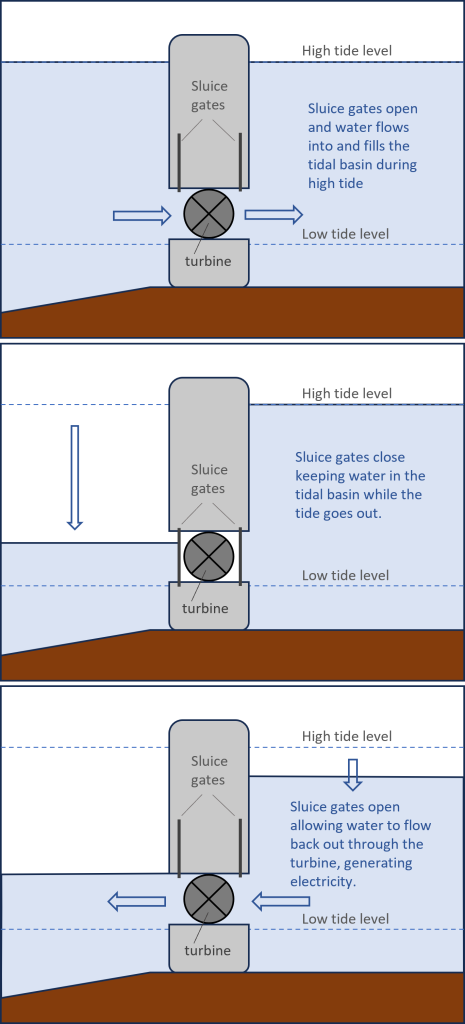
The first use of tidal power for electricity was similar to hydroelectric energy with the use of a tidal barrage or dam placed across an estuary near the mouth of a river. The dam traps incoming high tide water creating a filled reservoir, or tidal basin, behind the dam (Figure 3C.3.5, top). Sluice gates in the dam close once the tidal basin is filled, keeping water in the basin while the tide goes out (Figure 3C.3.5, middle). Once the tide has gone out, the water level on the ocean side of the dam is much lower than the water level in the tidal basin and the sluice gates open allowing water to flow out from the tidal basin through the turbine and generate electricity, just like in hydroelectric power (Figure 3C.3.5, bottom). Some tidal barrages are designed to generate electricity as water is flowing in and filling the tidal basin in addition to when it is flowing out.
As this style of tidal energy relies on a dam, many of the same environmental impacts associated with dams are also issues with this energy source. It is also not possible to use this style of tidal energy everywhere, as many locations do not have a large enough height difference between high and low tide, or tidal range, to generate sufficient energy or be economical to operate (building and maintaining dams is expensive!). A tidal range of at least 7m (22 ft) is needed for tidal barrage energy. Only two major tidal barrage plants are currently in operation. The largest starting producing energy in in South Korea in 2011 and has a power generating capacity of 254 megawatts (MW). The other has been operating in France since 1966 and has a generating capacity of 240MW of power. For comparison, a large hydroelectric dam is considered as anything over 30MW and very large dams, like the Hoover Dam, can produce over 2000MW. Coal and nuclear power plants are often in the 500-1000MW range or larger. Other smaller pilot plants are in Canada in the Bay of Fundy, which has the largest tidal range in the world, and in Russia.
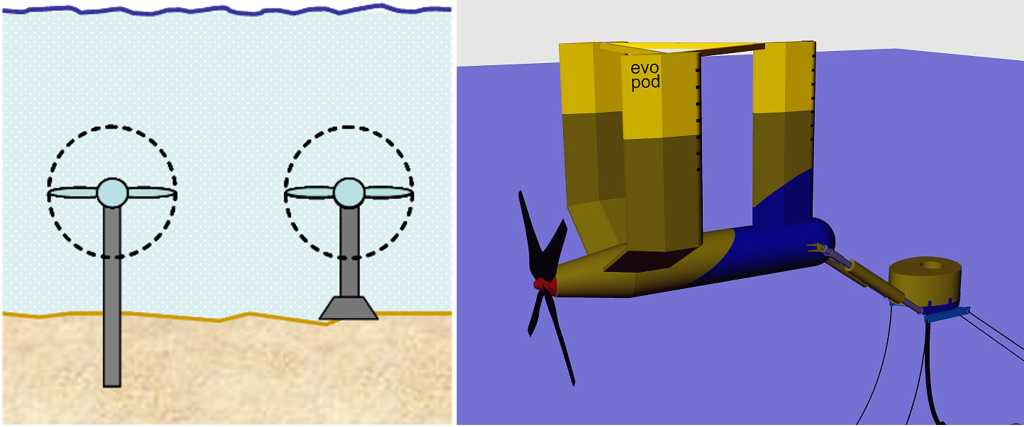
An alternative, and newer, form of tidal energy is under development that would alleviate the need for dams. This form is called tidal stream and uses underwater turbines, essentially underwater windmills, which are turned as tidal currents come in and out of an area (Figure 3C.3.6). While this still needs a location where tidal currents are predictably strong to be both economically viable and supply sufficient power, there are more sites favorable to this style of tidal energy than to tidal barrage. The first tidal stream plant, the MeyGen Project, opened in Scotland in 2018 with a 6MW facility comprised of four 1.5MW underwater turbines. Future phases of this project will expand this to a 398MW facility.
Tidal energy is inexhaustible and low in greenhouse gas emissions; the emissions associated with this energy come mainly from the construction of the dams and turbines. Unlike some other forms of renewable energy like wind and solar, tidal energy is also highly predictable. Unfortunately, the timing of when tides are flowing, and therefore when tidal energy can be produced, does not always align with peak energy usage times. The intermittent energy from tidal sources means it cannot be relied on as the only source of energy and would need to be used in conjunction with other sources that can supply more constant energy.
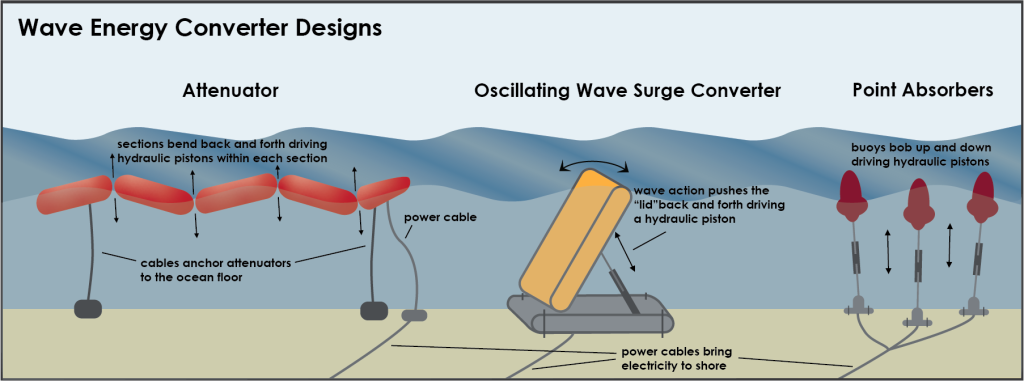
3.3 Wave Energy

Check your understanding: Water powered electricity
References
Anderson, D. H., Moggridge, H. L., Warren, P. H., & Shucksmith, J. (2014). The impacts of ‘run-of-river’ hydropower on the physical and ecological condition of rivers. Water and Environment Journal, 29(2), 268–276. https://doi.org/10.1111/wej.12101
EMEC: European Marine Energy Centre. (n.d.).Wave devices. https://www.emec.org.uk/marine-energy/wave-devices/
Ocean Energy Council (2014, March 25). Tidal Energy https://www.oceanenergycouncil.com/ocean-energy/tidal-energy/
SIMEC Atlantis Energy. (2024, February 13). MEYGEN – SAE Renewables. SAE Renewables. https://saerenewables.com/tidal-stream/meygen/
