4. Water Footprint Assessment
Assessing the water footprint of any product, individual, city, country, etc. is a complex activity. The water footprint (WF) of a country depends on what products and how much of those products are consumed as well as the WF of each of those products, which changes depending on where it was produced. A complete understanding of a country’s water footprint requires measuring water used to produce goods then following the path of that water through virtual water trade to measure the water consumed within each country. Obviously, countries with large populations will have larger water footprints than countries with small populations, so it is more useful to analyze the water footprint on a per capita basis to compare water footprints between countries (Figure 2D.4.1).
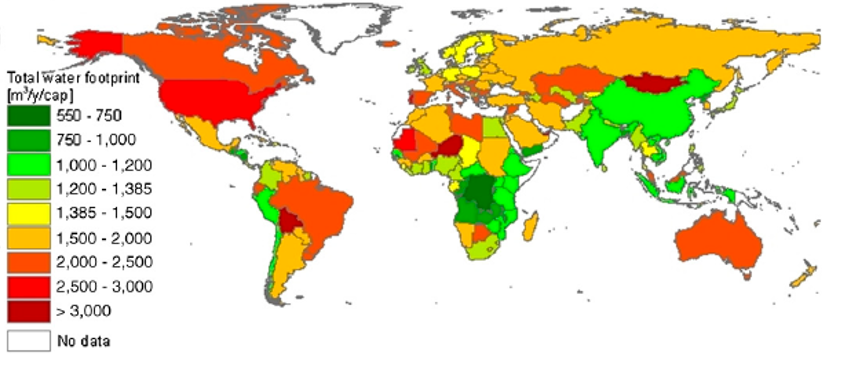
The range of total WFs per capita is high for developing countries, ranging from 550–3,800 m3/y per capita. This range is narrower for industrialized countries, from 1,250–2,850 m3/y per capita. The United States is on the high end of this with a per capital WF of 2,842 m3/y while the United Kingdom is on the low end with a per capita WF of 1,258 m3/y. This is in large part due to food production choices. The U.S. consumes 4.5 times the amount of beef as the global average while the UK consumes only 2 times the global average of beef. This means the U.S. has a much higher green and blue water component in its WF put towards raising cattle, one of the higher virtual water content foods. In addition, how cattle are raised in the U.S. is very different than in the UK as the UK has a much smaller reliance on animal feedlots. The widespread usage of feedlots in the U.S. contributes to a higher grey water footprint related to cattle production.
Historically, governments have only assessed water used within the country (the internal water) to make national water plans. However, this fails to consider virtual water trade and the amount of water that was used in other countries and imported (the external water). In assessing the global water footprint for a country, both the internal and external water needs to be measured. Figure 2D.4.2 below shows the water footprint just for crops and animal products consumed by citizens of the United States. This set of maps shows the total water footprint per capita (bottom map), as well as how each of the three water footprint components (green, blue, and grey) contribute to this total (top three maps). On these maps, any water within U.S. borders is internal water and water in all other countries is external water that was imported to the U.S. via virtual water trade.
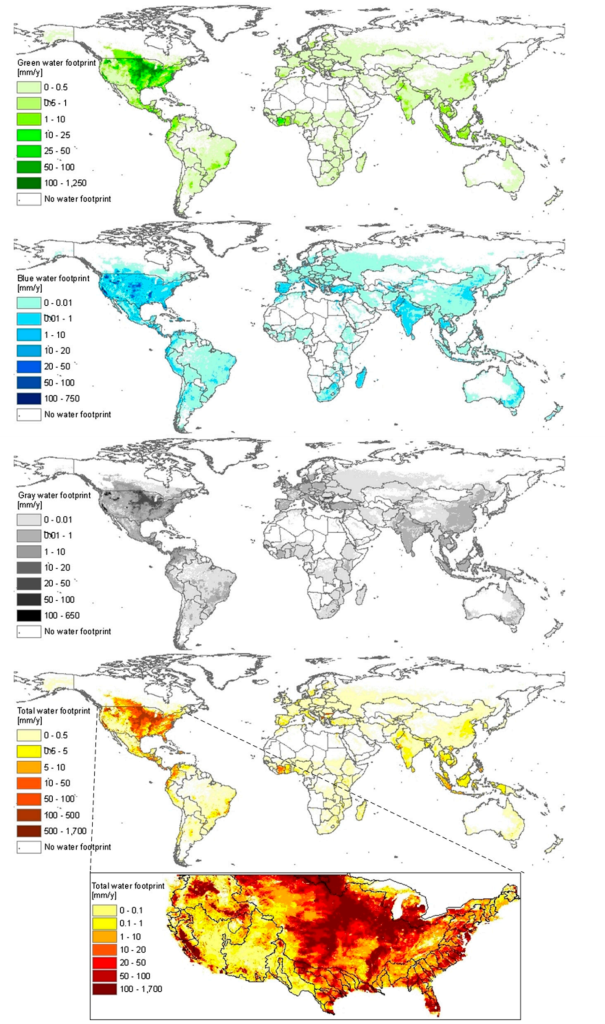
While most of the water footprint for U.S. citizens is internal water, roughly 20% is the result of external water. Most external water is green water used in agricultural production, which is logical as green water is the largest component of all national water footprints.
By using a comprehensive water footprint assessment, and categorizing both internal and external water, governments can make more informed water policy decisions that help reduce water stress and ultimately work towards a more globally sustainable use of water resources.
References
Hoekstra, A. Y., & Mekonnen, M. (2012). The water footprint of humanity. Proceedings of the National Academy of Sciences of the United States of America, 109(9), 3232-3237. https://doi.org/10.1073/pnas.1109936109
