2. Steam Powered Electricity
The energy resources that rely on pressurized steam to generate electricity are fossil fuels, nuclear, biomass, and geothermal. Fossil fuels and nuclear are non-renewable resources whereas biomass and geothermal are renewable resources.
2.1 Fossil Fuels
Fossil fuels are energy sources that are derived from ancient organic matter (plants, animals, and other organisms). They are rich in carbon that has been bonded with hydrogen molecules through chemical reactions giving them their other name of hydrocarbons.
When organic matter dies it is typically broken down and oxidized (joined with oxygen) quickly (weeks to years) to make carbon dioxide. However, if the organic matter settles into an area that is low in oxygen, or anoxic, the oxidation process will not occur, and the organic matter can be buried and preserved in sediments. If the temperature and pressure conditions are right for this buried organic matter it can be turned into a fossil fuel. The type of fossil fuel made will depend on the type of organic matter buried, the location where it was buried, and the pressure and temperature conditions it underwent. The process of turning buried organic matter into fossil fuels takes millions of years.
Formation of Coal
Coal is a black, brittle, carbon rich sedimentary rock that forms from vegetation buried in swamps. Swamps are commonly anoxic waters, so as vegetation accumulates in this oxygen-free setting the lack of oxygen prevents organic matter decay. As such, the carbon is not released as carbon dioxide, but instead is buried where it gets compressed and heated to transform into coal. Different grades or ranks of coal form as the organic matter becomes progressively more heated and compressed for longer periods of time (Figure 3C.2.1).
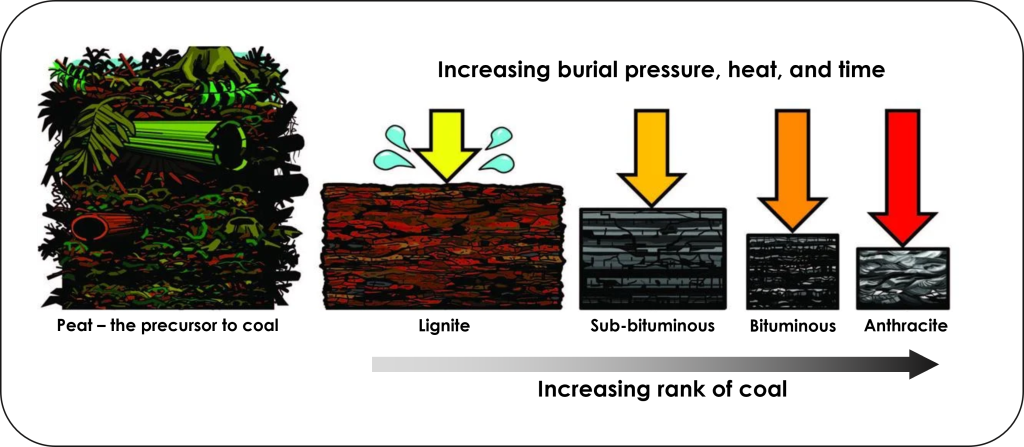
The precursor to coal is peat; a moist, organic rich accumulation of partially decayed vegetation. As peat is buried and subjected to higher temperatures and pressures over time, it is transformed into coal. Higher ranks of coal contain higher amounts of carbon and produce more heat energy when burned. The lowest rank of coal is lignite, then they increase in rank through sub-bituminous, bituminous, and finally anthracite coal is highest rank.
The first coal bearing rocks formed roughly 360-300 million years ago during the Carboniferous Period, named because the rocks from this time are carbon rich. During this time, land plants thrived, and large swamps were present on the landscape. The huge amount of carbon that was buried, and as a result removed long term from the atmosphere, during this time was a contributing factor in the Late Paleozoic Ice Age that began roughly 340 million years ago.
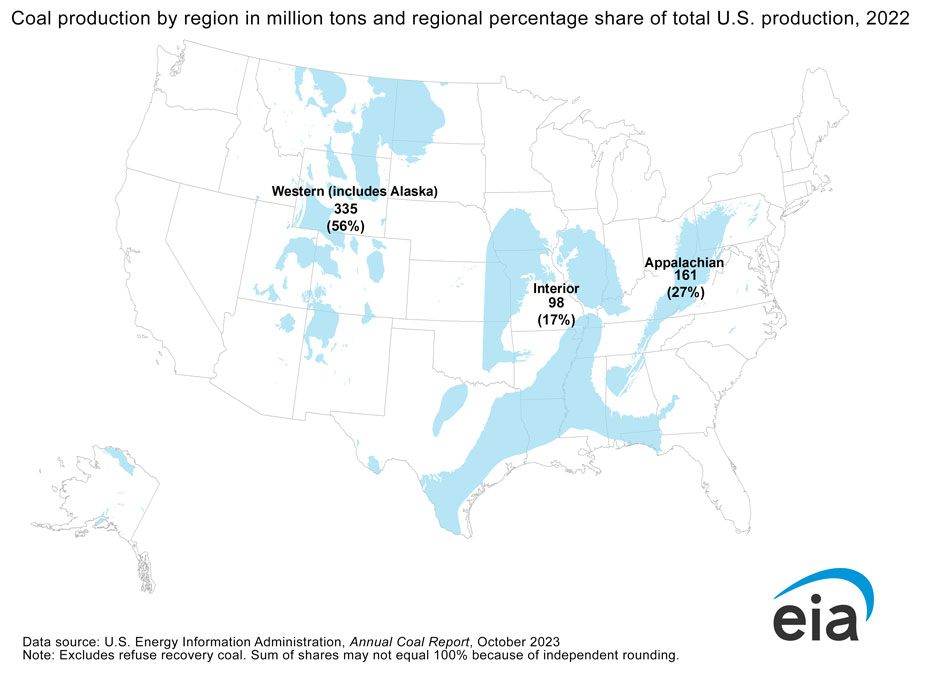
Coal is removed from the ground through mining. The type of mining used, whether underground or open pit, is based on how deep and how thick the coal seam is. In the United States, coal is mined from three main regions, the Western region, the Interior region, and the Appalachian region (Figure 3C.2.2). Wyoming, within the Western region, is the top coal producer in the country, providing over 40% of U.S. coal. Coal from Wyoming is dominantly sub-bituminous. The Appalachian region produces 27% of U.S. coal, most of which comes from West Virginia, Pennsylvania, and Kentucky. Coal in the Appalachian region is higher grade bituminous and anthracite coal.
Formation of Oil and Gas
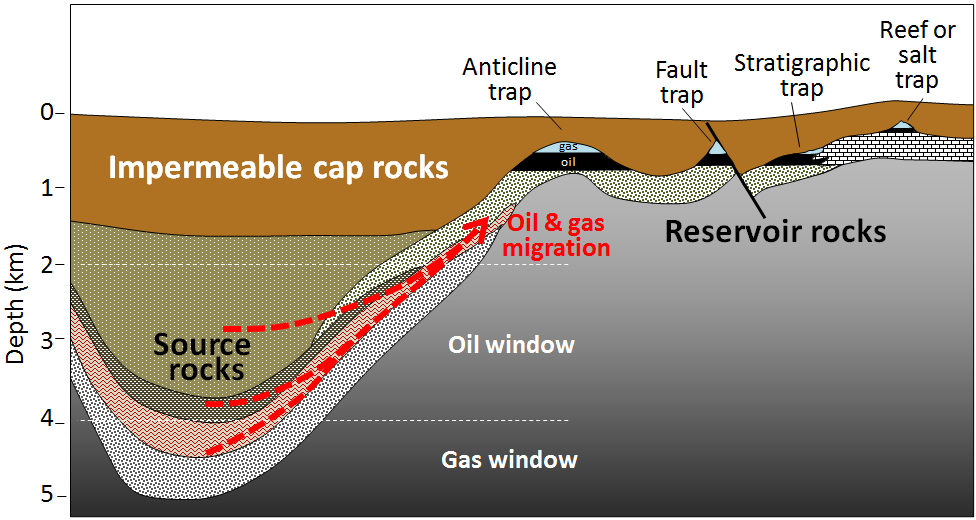
While the dominant use of oil is not for electricity production, it is formed alongside natural gas and therefore the formation of these two fossil fuels is linked. Oil and gas form similarly to coal in that organic matter accumulates and is buried under anoxic conditions. However, while almost all coal forms on land from terrestrial vegetation, oil and gas is primarily derived from marine micro-organisms that accumulate within sea-floor sediments. Increasing burial pressures and temperatures convert the organic matter in the sea-floor sediments to hydrocarbons. Oil formation occurs at depths greater than about 2 km, and at temperatures ranging from 60° to 120°C (oil window). At higher temperatures, methane gas is formed (gas window) (Figure 3C.2.3).
The rock containing organic matter where the formation of gas and oil takes place is called the source rock. As both liquid oil and gaseous methane are lighter than water, they tend to migrate slowly out of the source rock toward the surface and into reservoir rocks. Reservoir rocks are typically relatively porous and permeable because that allows migration of the fluids from the source rocks, and also facilitates recovery of the oil or gas. Oil and gas become contained in the reservoir rocks by overlying impermeable rocks called cap rocks. The orientation or geometries of the source rock and reservoir rock to the cap rock need to be correct in order for the oil and gas to become trapped. This keeps the oil and gas in the ground instead of letting it seep to the surface. Traps for oil and gas include specific types of rock folds (called anticlines), faults, stratigraphic (rock layer) changes, or in association with reefs and salt domes (Figure 3C.2.3).

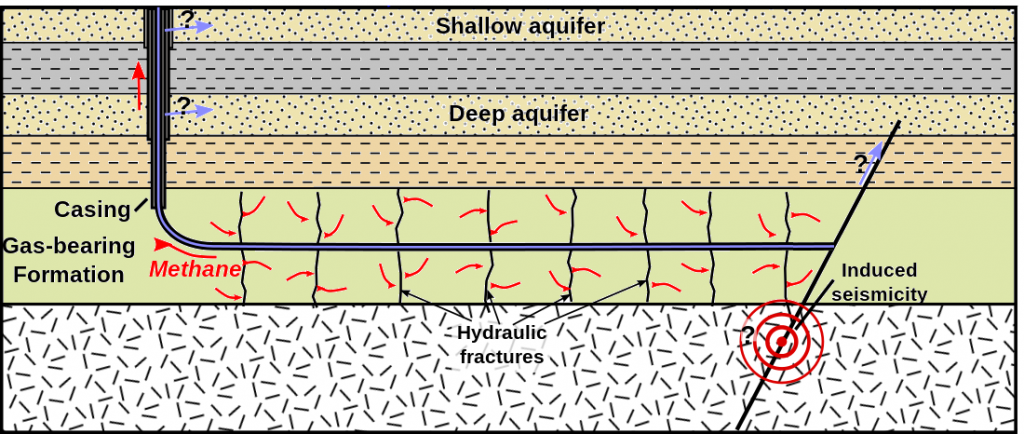
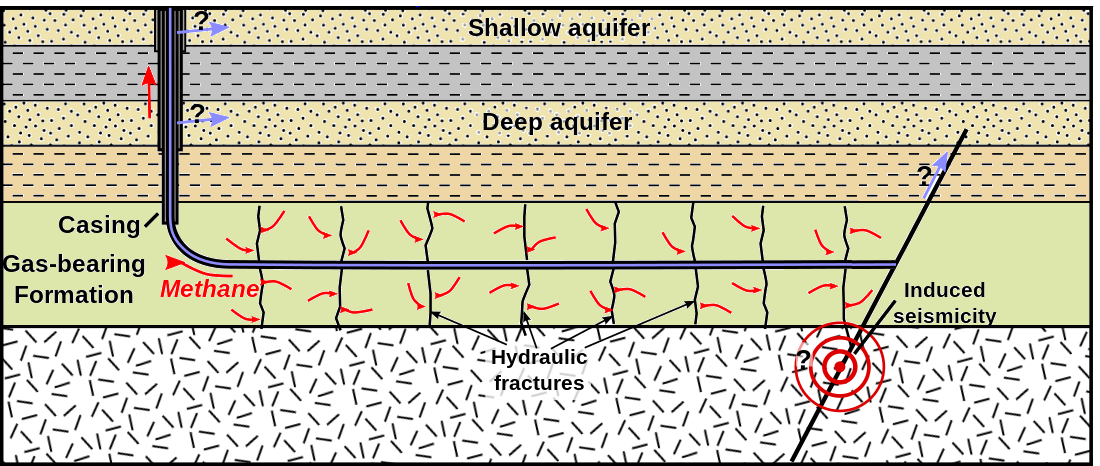
Oil and gas are extracted from the reservoir rock through drilling deep wells and pumping the oil and gas out of the ground. To aid in removing oil and gas, hot fluids and steam can be injected into wells placed in the reservoir rocks to help “thin” the oil and make pumping easier. Another method to increase pumping efficiency is hydrofracturing or “fracking”. This is where high pressure fluids are injected into wells to cause the rocks to break up or fracture, which can help release oil and gas (Figure 3C.2.4). Fracking is particularly useful when oil and gas are locked into relatively impermeable rocks such as shales which means regular pumping extraction is difficult and inefficient.
Fracking in North Dakota
Fracking technology led to the oil in North Dakota associated with the Bakken Formation. This shale formation contains large quantities of oil and gas that were not economical to extract prior to the advent of fracking because of the low permeability rock. The boom in North Dakota began around 2008, reached a peak around 2012 and tapered off as oil prices dropped around 2018.
While the economy of North Dakota was positively affected by this boom, the environment was not. While the bulk of fracking fluid is water, it also contains sand and other chemicals. As the fractures are made, sand is blown into them to keep the cracks open and provide porosity to increase extraction efficiency. The mix of the other chemicals is typically proprietary information, thereby making the potential health risks associated with spills or leaks into underground aquifers difficult to assess. In addition, fractures can also allow the oil and gas to migrate upward into drinking water aquifers, contaminating the drinking water supply.
The sheer quantity of water needed for fracking processes (1.5 – 9.7 million gallons of water per well) is also of concern at a time when freshwater supplies for drinking water, agriculture, and ecosystems are scarce. In addition, large volumes of wastewater are also produced. These contain dissolved chemicals and other pollutants and therefore must be contained and treated.
The injection of fluids at depth to manufacture porosity has also created earthquake swarms. While most of the earthquakes are small, some have been large enough to cause damage, which is a particular problem given they are occurring in areas that are ill equipped to deal with earthquakes given they are largely safe from natural earthquakes.
Air quality is affected by both the fracking and venting of natural gas but also through the mining of sand needed for the fracking fluid. This extends the environmental impact beyond just the region immediately surrounding the fracking. Fine silica sand dust can be inhaled causing lung infections and other respiratory illnesses. Minnesota and Wisconsin are the main mining locations for fracking sand in the U.S.
Another form of natural gas (which is methane) is created alongside coal. During the process that converts organic matter to coal, some methane is produced and stored within the pores of the coal. When coal is mined, methane is released into the mine where it can become a serious explosion hazard. Modern coal-mining machines have methane detectors on them and stop operating if the methane levels are dangerous. It is possible to extract the methane from coal beds without mining the coal; gas recovered this way is known as coal-bed methane.
Using Fossil Fuels for Electricity
Burning fossil fuels has dominated electricity production since the industrial revolution. A lot of energy is bound in a small volume of fossil fuels, making electricity production from fossil fuels highly efficient. In addition, they are reliable; if there is an available store of coal or gas, energy can be made without needing to wait for a change in nature like the sun to rise or the wind to blow. These factors mean fossil fuels are easy to rely on as they are a “known quantity” and many existing power plants run on these fuels, negating the need to build new facilities to use a new energy type.
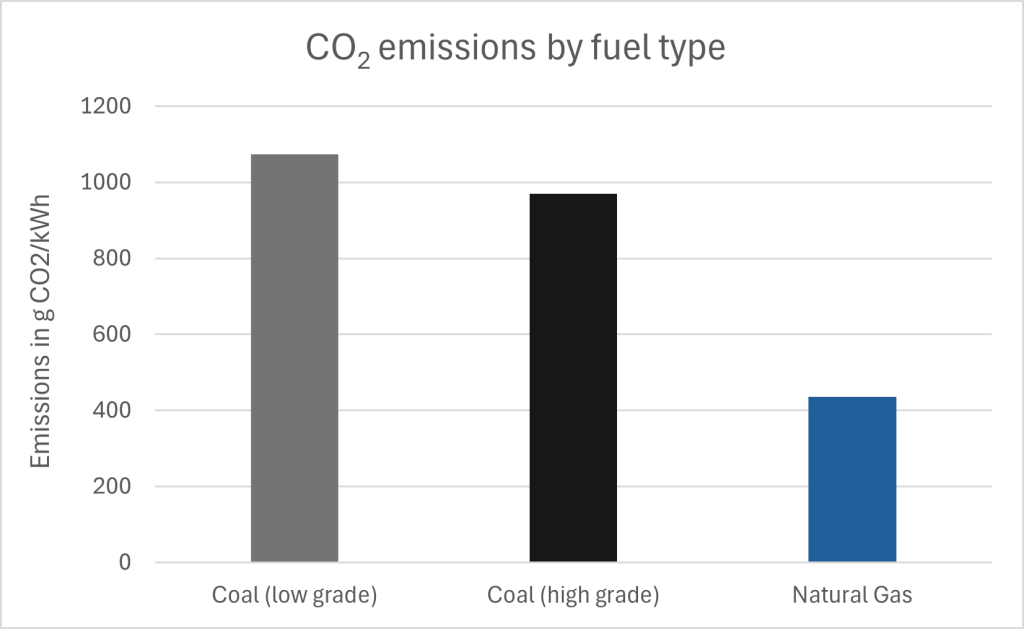
Despite this, there are obvious drawbacks to relying on fossil fuels as an energy resource beyond the fact it is non-renewable, and therefore a stronger reliance on alternative energies will be required in the future. Burning fossil fuels releases greenhouse gases, namely carbon dioxide and methane, although the amount of greenhouse gases released varies by fossil fuel type. Figure 3C.2.5 shows the CO2 emissions from burning high grade coal (anthracite), low grade coal (lignite), and natural gas. Burning low grade coal releases the most CO2, burning high grade coal emits slightly less CO2, and burning natural gas releases about half the amount of CO2 that high grade coal releases, for the same energy production. These values also include leakage losses of greenhouse gases from the natural gas power plants (i.e., natural gas leaks of unburned gas in the power plant). Leakage losses are present in natural gas plants due to the nature of using a gas versus a solid fuel. These losses are in the form of methane, a much more potent greenhouse gas than carbon dioxide, and have been converted into an equivalent CO2 amount for inclusion in this graph. Leakage losses were conservatively estimated around 1% loss for natural gas, but if losses rise much higher than 5%, the CO2 equivalent losses from natural gas energy become equal or higher than that of high-grade coal.
Another concern with natural gas is the high leakage potential during production and transportation of this fuel. Natural gas transported long distances through pipelines is 95% methane, and leakage of methane from pipeline is estimated to be over 2.6 billion metric tons each year in the United States. This is the equivalent climate impact of over 50 million cars being driven for a year. Measures to greatly reduce and eliminate methane leakage could reduce near-term global warming impact by 30%. Methane leaks are also harmful due to a high potential for fires and explosions. The impacts from leaking pipeline have the potential to increase in the future as most pipelines were designed to have a useful life of 50 years and the average pipeline age in the U.S. is currently 40-50 years with over 3 million miles of pipeline.
Coal mining also has methane leaks from the coal beds, but it is not on the same scale as natural gas pipeline leaks. However, coal burning releases other compounds in higher volumes than natural gas, namely sulfur dioxide (SO2), nitrogen oxides (NOx), particulate matter, and mercury. SO2 contributes to acid rain and both NOx and particulate matter contribute to smog. SO2, NOx, and particulate matter all contribute to respiratory illnesses. Mercury and other metals accumulate in the food chain to create neurological and development damage in humans and other animals.
Mining and extraction activities for fossil fuels have additional impacts on the environment by degrading air and water quality. They also destroy habitats and change the land use in areas around the mine site or pumping well. Surface mining and underground mining are the two main mining methods for coal. Surface mining has a much larger areal footprint but both forms can alter the landscape and pollute nearby streams. Coal often contains minerals high in iron sulfide (like pyrite, a.k.a. fool’s gold) and old mines or mine waste piles that are improperly reclaimed can result in acid mine drainage (AMD). AMD changes the chemistry of rivers, creating acidic waters that are high in heavy metals and toxic to the environment. As the highly acidic waters leaching out of the mine or waste pile mix with river water the pH rises slightly (but is still very acidic) allowing iron hydroxides to precipitate in the water. This iron hydroxide is called yellow boy and gives the water the characteristic yellow-orange color associated with AMD (Figure 3C.2.6).

Because of the land area required and the higher potential for degrading water quality, coal mining has a larger environmental impact associated with extraction of resources than natural gas does. Coal mining, preparation, and burning produces a large amount of waste material that is stored in containment ponds (impoundments) near the mine, coal preparation plant, or power plant. This waste material is a mixture of water and coal solids, or coal ash called a coal slurry, and is typically high in chemical toxins such as arsenic and mercury. Major environmental disasters have occurred because of impoundments catastrophically breaking.
Kingston Fossil Plant Coal Ash Slurry Spill
On December 22, 2008, the dike surrounding a coal ash slurry impoundment associated with the Tennessee Valley Authority’s (TVA) Kingston Fossil Plant (a coal fired power plant) ruptured, releasing 1.1 billion gallons of coal ash slurry (Figure 3C.2.7). The coal slurry flowed into the Emory and Clinch Rivers, both of which are tributaries of the Tennessee River. As of 2023, this is the largest coal slurry spill in U.S. history, topping the former record holder, the Martin County coal spill in West Virginia, which released 306 million gallons of coal slurry.
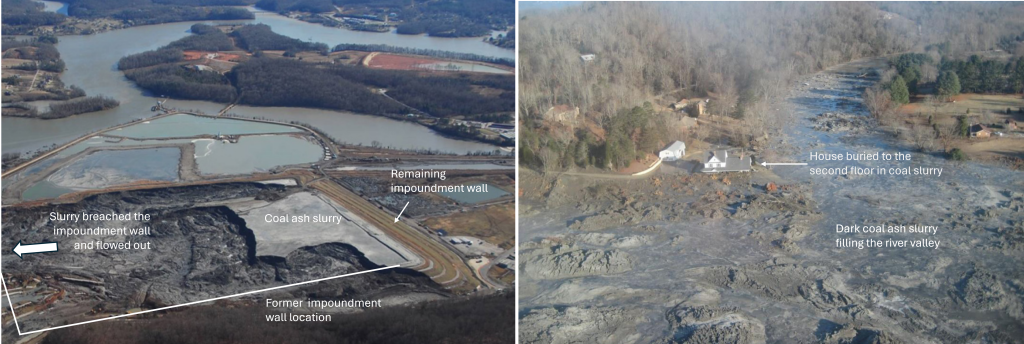
Coal ash slurry is the waste mixture of water and coal ash created by burning coal for electricity. At the TVA site, this waste was being stored using a wet pond method, which has higher potential for spills than a dry pond method. TVA engineers had raised concerns about this impoundment and leaks had been found for decades, with minor repairs being made instead of switching to a dry storage method due to the costs that would incur.
Significantly elevated levels of toxic metals including arsenic, lead, mercury, and copper were found in samples of slurry and river water following the spill. Within 10 years of the disaster, hundreds of the cleanup workers were ill and more than 30 had died with causes believed to be linked to the cleanup.
2.2 Nuclear Energy
Nuclear power relies on isotopes (for a refresher on isotopes see Chapter 3B.5) for energy production. However, the reliance is not on isotopes that will be long lasting and stable in the environment, but rather on isotopes that will break down. These isotopes are called radioactive isotopes, and they have a less stable nucleus that is susceptible to breaking down and emitting radiation and energy in a process called nuclear fission. Capturing this energy is how nuclear power plants generate electricity.
While all elements have isotopes, not all isotopes are radioactive and not all radioactive isotopes are useful for generating the energy required for electricity production. The most common isotope used for nuclear power is uranium 235, or U-235 (or 235U). It is useful because it has a large nucleus (92 protons and 143 neutrons) and releases a lot of energy during fission. However, it accounts for only 0.7% of uranium. The other main isotope of uranium, U-238, is far more common, accounting for most of the remaining 99.3% of all uranium. In order for U-235 to be useful as a fuel in a typical nuclear reactor it must be concentrated to 3-5%; this is called enrichment. U-235 must be enriched to greater than 20% to be used in submarine nuclear reactors or to be used in atomic weapons.
Enrichment of uranium is the main technical challenge in developing nuclear power. Separating uranium (of all types) from other elements is a relatively easy step as all isotopes of uranium behave the same and therefore can be chemically separated. Separating different isotopes from each other requires techniques that rely on the very small differences in atomic mass between the isotopes and uses techniques such as centrifuges and mass spectrometry.
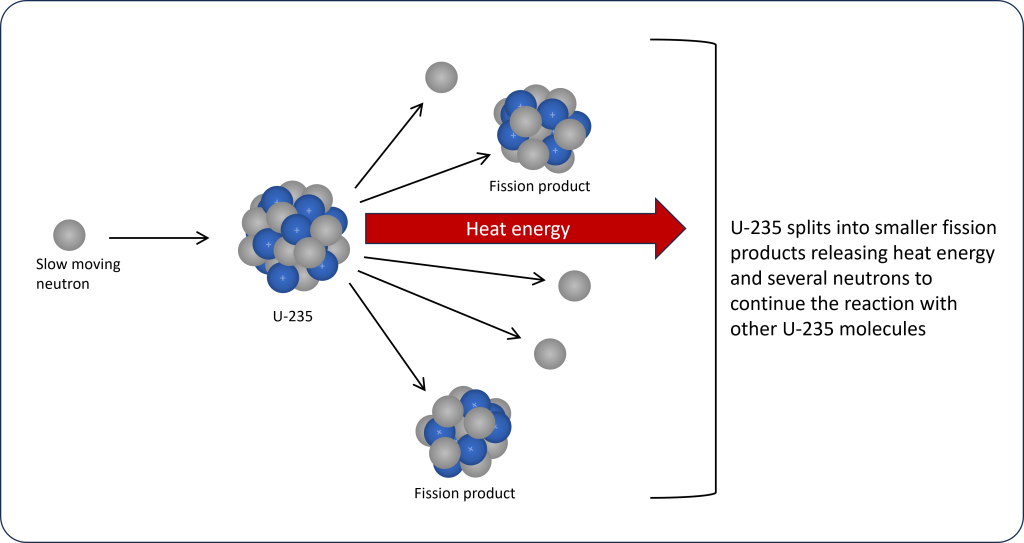
Once the uranium has been suitably enriched it is manufactured into fuel rods that are used inside a nuclear reactor. The nuclear reaction starts with slow moving neutrons being introduced inside the nuclear reactor. These slow neutrons collide with the nucleus of a U-235 causing it to split apart into smaller molecules called fission products and releasing large amounts of heat energy. Several neutrons are also released during fission, which can then collide with other U-235 molecules leading to a chain reaction (Figure 3C.2.8). This chain reaction allows the process to become self-sustaining once it has started.
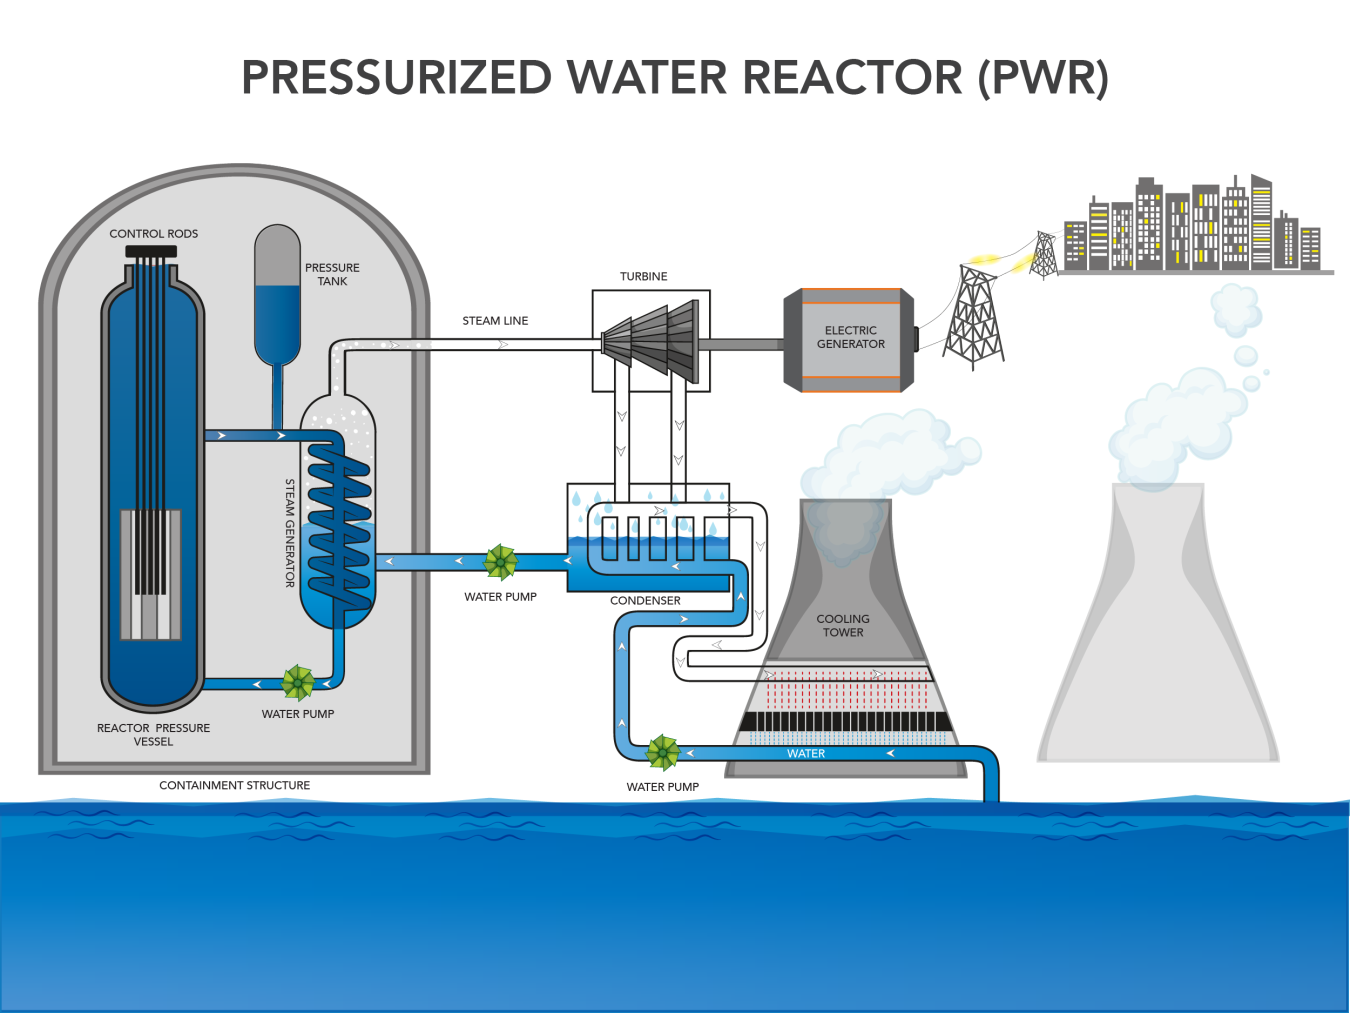
The heat energy generated during the fission of U-235 is captured by a cooling liquid inside the reactor. In U.S. nuclear reactor designs, this liquid is light water, meaning it is water that does not contain high levels of deuterium, the heavy isotope of hydrogen. The heat in the reactor core is used to boil water to generate steam that is used to run a turbine and generate electricity. This steam is then cooled back down to water and reused in the process. There is not one standard nuclear reactor design so the mechanics of exactly how and where steam is generated in the reactor change based on design. Figure 3C.2.9 shows the basic process for a pressurized water reactor, which is the main style of nuclear reactor in the U.S. In this reactor type, water in the reactor vessel is under pressure such that it can become superheated without turning to steam. It is then pumped to a separate steam vessel where its heat is transferred to water circulating in a separate set of pipes before it returns to the reactor vessel. Water in the separate pipes of the steam vessel absorbs the heat and boils, creating steam. This steam runs the turbine to generate electricity and then is cooled to be reused in the steam vessel. A lot of water is lost to steam during this process, so it is essential that nuclear power plants are located near a large and reliable source of water to replenish water lost to steam.
Nuclear meltdowns result from out-of-control chain reactions that produce more heat than the cooling fluid can remove. This can raise temperatures inside the reactor to levels that will literally make the fuel rods melt. This is dangerous as nuclear fuel is highly radioactive and a meltdown would release enormous amounts of radiation. To prevent meltdowns, a set of control rods are present that can be inserted into the reactor between the fuel rods. Control rods are made of materials that absorb neutrons so when inserted they reduce or stop the nuclear reaction rate by removing excess neutrons.
International Nuclear and Radiological Event Scale
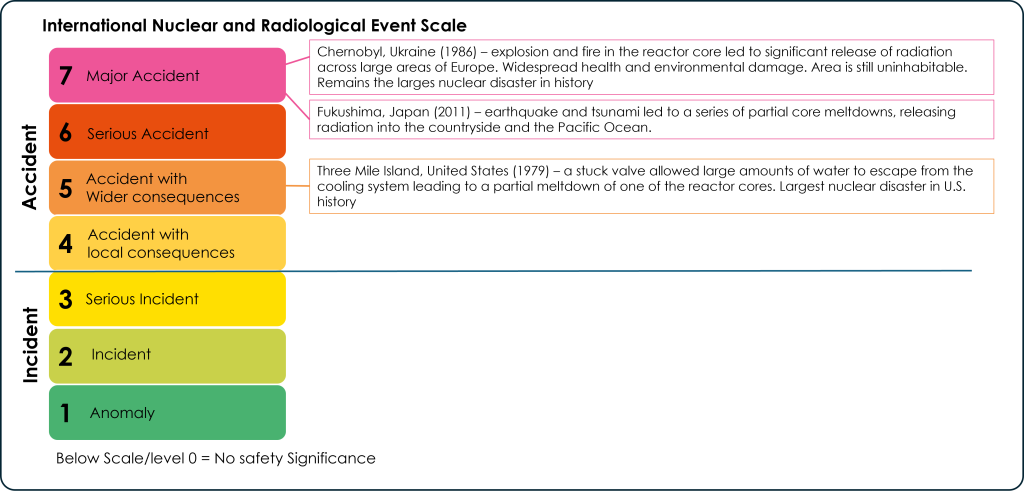
The International Nuclear and Radiological Event Scale (INES) was established to categorize the severity of nuclear accidents and incidents. It is divided into 7 levels, with 7 being a major accident and 1 being a small anomaly. The only level 7 accidents to have occurred are the Chernobyl, Ukraine nuclear disaster in 1986 and the Fukushima, Japan disaster in 2011. The most significant nuclear accident in the U.S. was a level 5 accident that occurred at the Three Mile Island nuclear plant in Pennsylvania in 1979 (Figure 3C.2.10).
Most nuclear power issues are smaller, at the incident level (1-3 on the INES). Nuclear accidents have the potential to harm ecosystems through the release of radiation. This can poison habitats and waterways and contaminate agricultural land. Developmental damage and radiation poisoning can affect humans and animals and in cases of severe exposure can cause rapid death.
As the chain reaction progresses, U-235 molecules are split and as a result no longer present in the fuel rod. As the concentration of U-235 decreases, the nuclear reaction slows and at some point the concentration is too low to be useful as a fuel. This takes between 3 and 7 years. While spent fuel rods are no longer useful as fuel, they still contain radioactive isotopes of U-235 and other fission products and must be disposed of in a manner that keeps workers, the general population, and the environment safe. The first step in dealing with spent fuel rods is to cool them as they are still extremely hot. This short term, or interim storage, commonly happens first in a wet storage area where fuel rods are placed into large pools of water as water is very good at absorbing heat. Sufficient wet storage cooling can take 5 years, after which they are put into interim dry storage. From here they can either be recycled, where remaining U-235 and other useable material is recovered, re-enriched, and reprocessed into more fuel rods, or they can be put into long term waste storage at a final disposal site (Figure 3C.2.11).
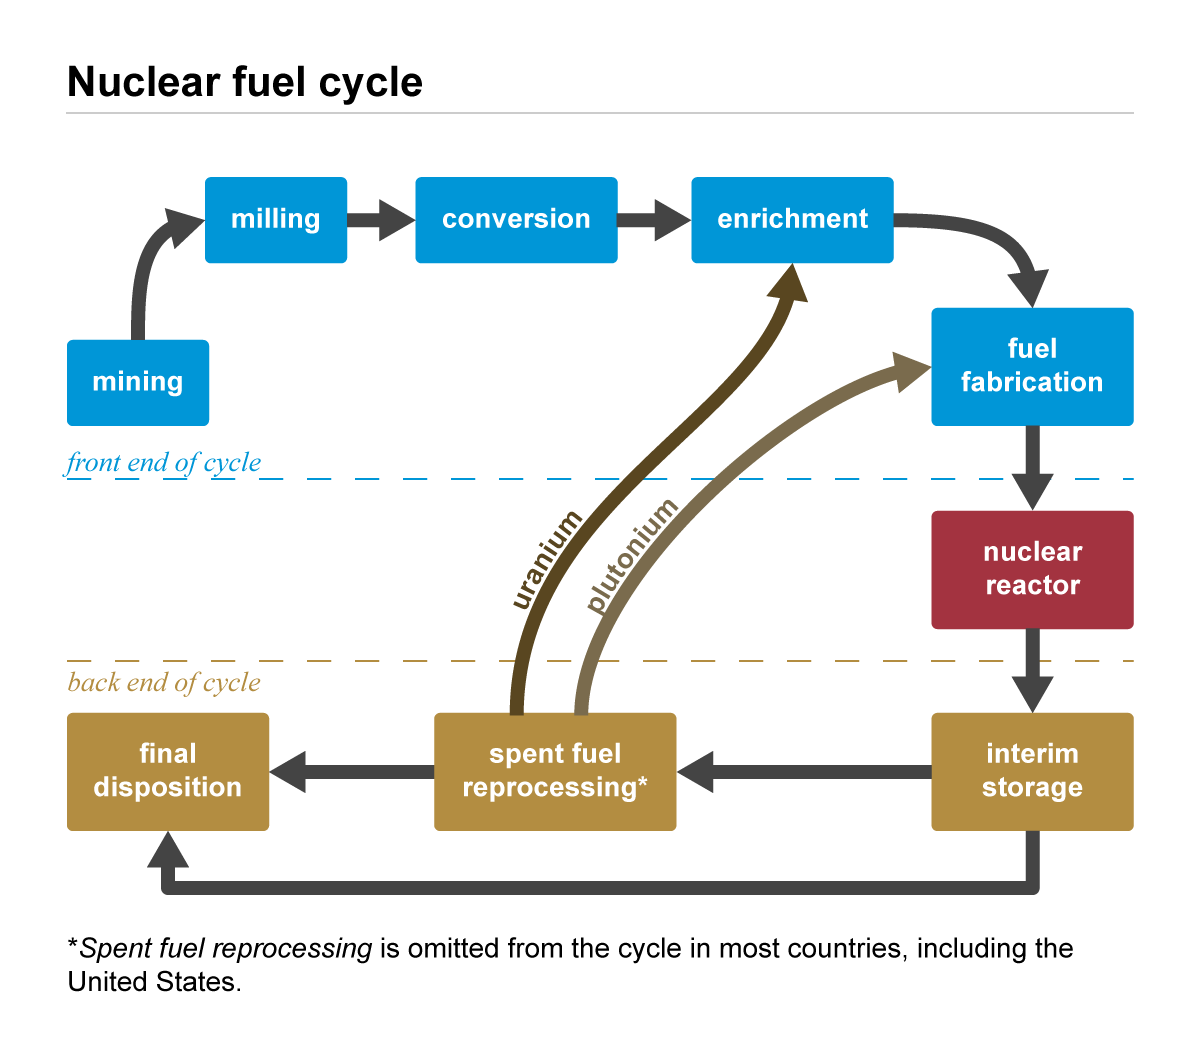
Long term storage sites have strict requirements due to the dangerous nature of nuclear waste. The waste must be kept in a place that is safe from contaminating humans, water, and other natural resources with radiation. As the decay rate of nuclear fuel is very long (U-235 has a half-life of 704 million years) it is radioactive for much longer than any human lifespan, so its safe storage must be ensured long into the future. These sites must also be in an area that is safe from earthquakes so that ground disruptions cannot harm the storage casks or create faults that cause radiation to leak. Deep geologic repositories are the best solution for long term storage, but finding areas deep underground that meet all of the storage requirements is difficult. In the U.S., the location chosen for long term waste storage is underneath Yucca Mountain in the middle of the Nevada desert. This site was approved in the late 1980s with a pilot project for waste storage being built in the early 2000s. Since that time, use of Yucca Mountain as a nuclear storage site has been mired in controversy and has not opened for waste disposal collection, leaving U.S. nuclear waste in interim storage. The people of Nevada do not want to house the waste for an entire country, particularly because they are one of the few states that does not produce any nuclear energy and therefore create no nuclear fuel waste. Yucca Mountain is located on Western Shoshone treaty land and the burial of nuclear waste there is highly contested by the Western Shoshone Nation as they have strong ties to the land and burying nuclear waste on this land is antithetical to their culture. The suggestion to use this land is seen as environmental racism.
Recycling can potentially recover 96% of material in a spent fuel rod, however, this is not done in the U.S. for several reasons. Firstly, it is a safeguarding measure taken in response to signing the Nuclear Non-Proliferation Treaty in 1968, whose purpose is to prevent the spread of nuclear weapons. Recycling recovers materials such as plutonium that could be used in nuclear weapons production. The other reason recycling is not done in the U.S. is that it requires a different type of reactor not present in the U.S., and therefore high costs would be incurred to build new recycling reactors. Recycling fuel rods is not seen as not necessary in the U.S. given the availability of nuclear fuel currently. As nuclear fuel is non-renewable the availability will change in the future, but that is not expected for over 100 years, at which time, recycling could extend the lifetime of nuclear fuel for many hundreds of years more. France, Japan, Belgium, and Russia all recycle nuclear waste.
Check your understanding: Nuclear Energy
2.3 Biomass Energy
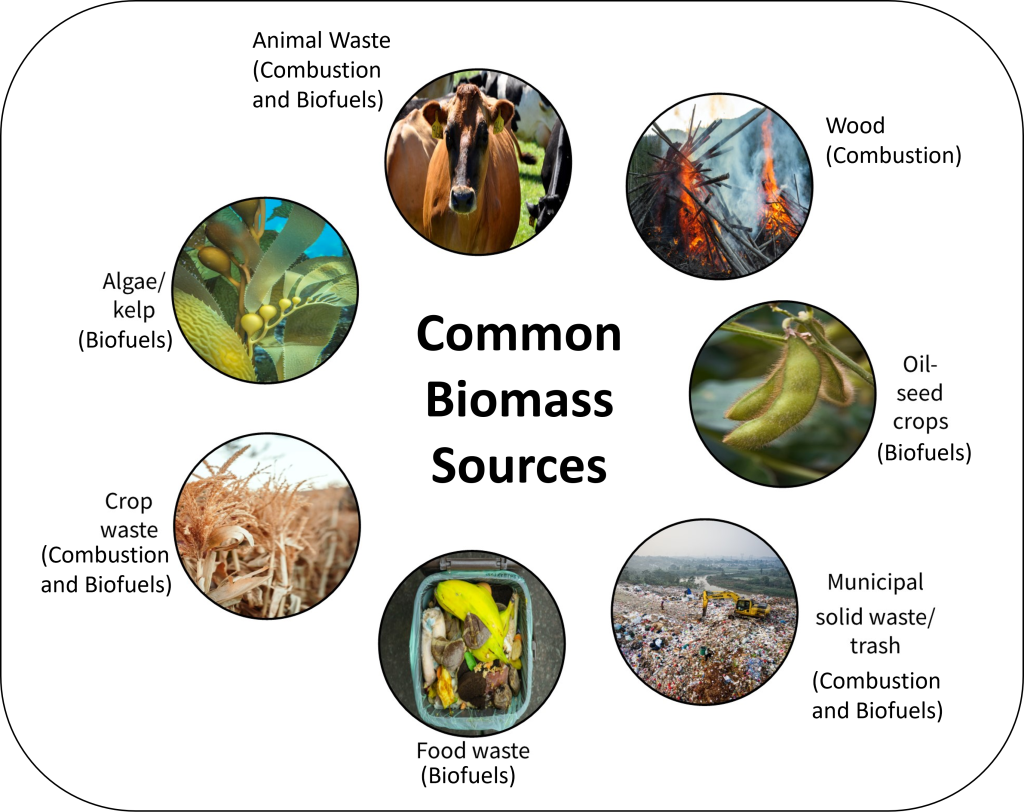
Biomass energy comes from plant and animal material and is used in two different ways, either by burning the material directly (combustion) or by creating biofuels (liquid or gas). The most used biofuel for electricity production is landfill gas. Anaerobic digestion of landfill waste creates methane gas (the main component of landfill gas), and this can be collected and processed to be used much like natural gas in a power plant. However, most biofuels are not used for electricity, but are instead used for transportation and heating fuels.
Most electricity from biomass is from biomass combustion. A variety of different types of biomasses can be used in this process such as wood and wood pellets, agricultural waste like grasses and corn stalks, and municipal waste. Wood and wood pellets are the largest share of biomass fuels, and these come from logging and mill residues; wood, paper, and furniture manufacturing; and discarded large timber products, such as railway ties, utility poles, and marine pilings. Combustion of biomass is done in a manner like combusting coal for electricity. In fact, mixtures of coal and biomass can be combusted together in a process called co-firing, although only about 20% of coal can be substituted with biomass before modifications need to be made to a coal plant design to burn a higher percentage of biomass. Figure 3C.2.12 depicts some of the common sources of biomass and indicates if that source is typically used for combustion, biofuels, or both.
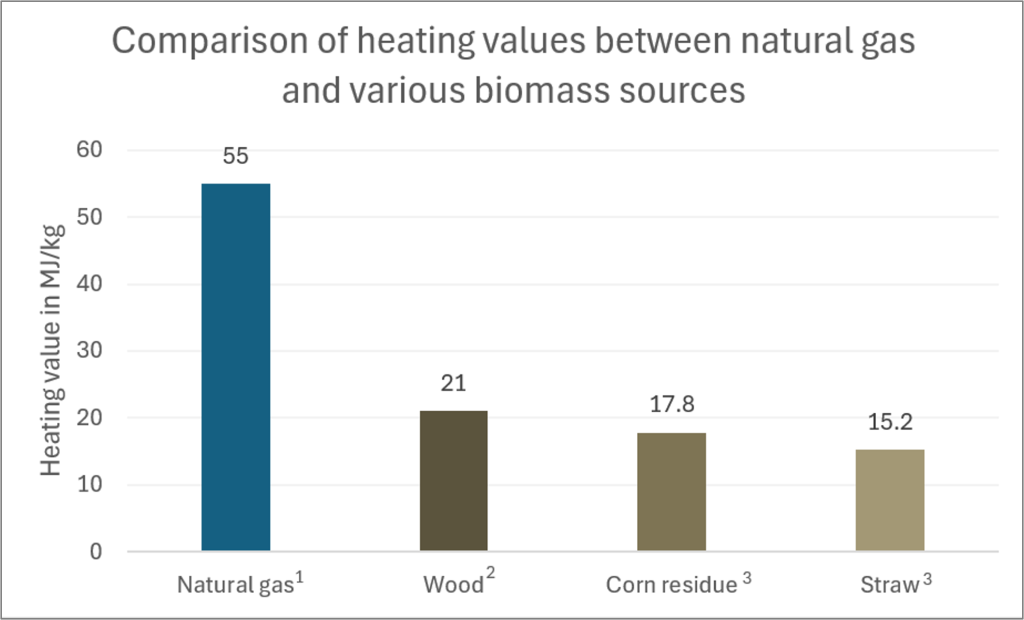
Proponents of biomass often discuss the renewable and abundant nature of this energy source and equate this with being a sustainable source of energy. While it is renewable and abundant, the degree to which this makes it sustainable is highly dependent on the type of biomass being used and how the biomass is produced (i.e., is it old growth forest that is not replanted or is it agricultural waste that is seasonally replenished). If the rate at which the biomass regrows is slower than the rate at which it needs to be burned for the energy required, it is hard to make the resource truly sustainable. This is particularly true with wood compared to grasses or other agricultural waste. Fast growing wood that is dedicated to biomass production is harvestable in 5-8 years while agricultural waste is produced in a single growing season. However, there are also energy density tradeoffs that must be considered between these materials as wood is the most energy dense biomass material, providing the most heat per kg of material and therefore less of it is required to generate the same amount of energy (Figure 3C.2.13). The heating value (the amount of heat energy created per mass of material burned) is lower in biomass than in natural gas. Not shown on the graph in Figure 3C.2.13 is the heating value of nuclear; it is over 100,000 times higher than that of biomass.
Combusting biomass is often described as being carbon neutral because the amount of carbon sequestered in the plant material during photosynthesis is equal to the carbon emitted during combustion. While this is true if analyzing just the carbon being captured and re-emitted, this does not consider emissions associated with growing, harvesting, and processing the fuel. Carbon emissions vary widely based on the fuel source and the preparation required to turn that biomass into usable, combustible fuel. High water content herbaceous grasses that need to be dried will create greenhouse gas emissions, particularly if the drying mechanism relies on natural gas. However, these emissions are minimal compared to fossil fuels. A major carbon emission issue associated with biomass, and one that is harder to assess, is that of land use change. Removing a forest to generate biomass for combustion rids the planet of a major carbon sink and affects soil biology leading to lower carbon uptake by these reservoirs. Land use changes also affect the overall albedo of an area, which can exacerbate climate change conditions. If biomass can be sourced such that it is a biproduct of other industries, such as utilizing excess wood pulp or sawdust from a papermill, or collecting dried corn stalks and leaves after corn harvesting, the sustainability increases.
Food security issues have arisen if land is designated specifically for growing biomass crops at the expense of food crops. Using land that is otherwise not productive land is the best option for designated biomass production.
In short, the type of biomass used and how it is grown plays a major role in the overall sustainability of biomass combustion. The land use changes associated with biomass production also mean that while the biomass itself might be carbon neutral, the overall use of biomass as an energy source is not carbon neutral.
2.4 Geothermal Energy
Geothermal energy is harnessed from heat inside the Earth (geo means Earth and thermal means heat). With increasing depth inside the Earth, the temperature also increases, this is called the geothermal gradient. This internal heat is a combination of residual heat from the formation of the planet and heat generated through natural decay of radioactive isotopes inside the Earth. The geothermal gradient averages 20-25°C/km through crustal depths applicable to geothermal energy production. This can increase to over 100°C/km in active volcanic regions where hot magma is near the Earth’s surface.
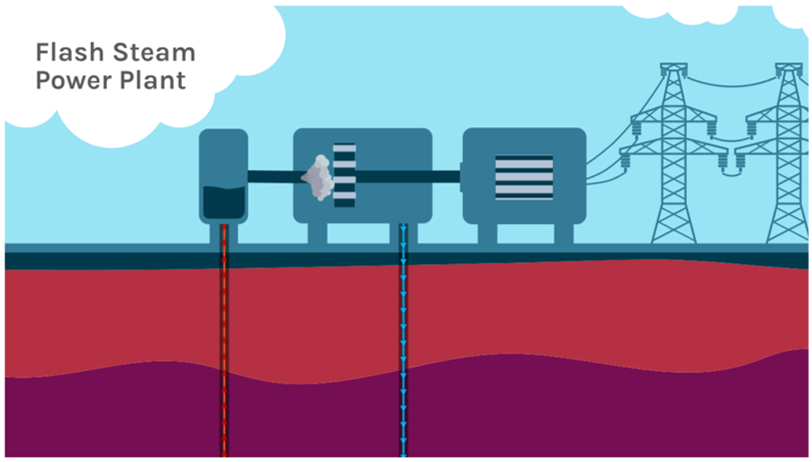
Geothermal power requires three components to be usable: heat, water, and permeable rock. If water or permeability are missing, they can be added or created but the heat portion must be present naturally. The two main methods for using geothermal energy are hydrothermal and enhanced geothermal systems (EGS). Hydrothermal energy is harnessed where water is present in hot rocks below the surface. This style of geothermal energy is commonly associated with volcanic activity and surface features such as hot springs and geysers and is the style of geothermal power strongly associated with Iceland, where it provides 90% of heating in the country and about 20% of electricity production (most of the remaining 80% is from hydroelectric). The largest hydrothermal power plant in the world is The Geysers in California. Located about 115 km (70 miles) north of San Francisco it has a geothermal field that uses over 350 wells spread out over 78 km2 (30 square miles) that pull steam from the ground to generate electricity. Most hydrothermal plants do not pump steam directly from the ground, but rather pump superheated water. The water associated with hydrothermal resources is under pressure and therefore can be far hotter than the boiling point of water but still liquid. As this water is brought to the surface through wells, it flashes to steam under the reduced pressure and this steam is used to drive a turbine to generate electricity (Figure 3C.2.14).
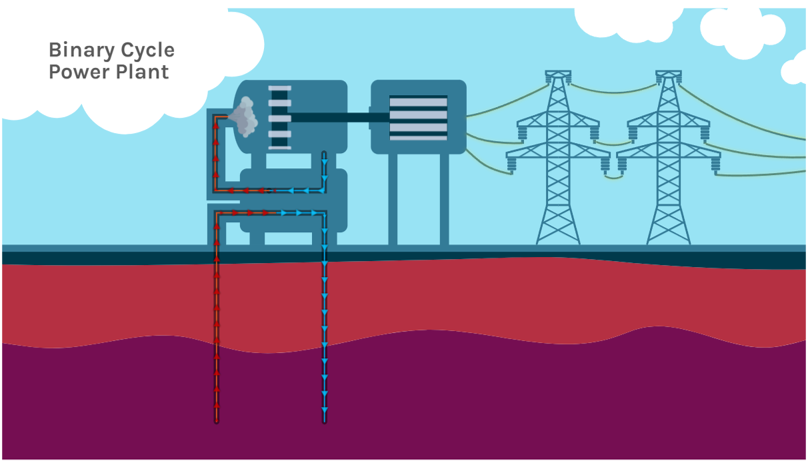
EGS lacks the presence of water or permeability or both within the hot rock and as such the hot rock needs to be “enhanced” to make geothermal energy. EGS production requires two wells, one for injecting water into the hot rock and a second to remove the heated water for energy production. Permeability is created within the hot rock by injecting pressurized water (hydraulic fracturing) to create fractures and geothermal reservoir space at depth. Water injected into this reservoir circulates and heats up before pumped out and used to generate electricity. The temperature of the rocks will determine the style of power plant built at an EGS location. If the rocks are hot enough to heat water above 182°C/360°F, a flash steam system can be used, but if water temperatures are lower, a binary-cycle system must be used. In a binary-cycle system, the geothermal reservoir water (i.e., the injected and circulating water) is pumped out of the ground and passed through a heat exchanger where it transfers heat to a secondary (“binary”) fluid. This binary fluid has a much lower boiling point than water, so even at lower temperatures, the heat is enough to cause it to flash to vapor and drive the turbines to generate electricity (Figure 3C.2.15). A binary-cycle system is not as efficient at generating energy as flash steam, and the efficiency of binary-cycle systems decreases as the rock temperature decreases. At rock temperatures below 150°C, there is not enough heat to operate binary-cycle systems with current technology.
The above diagrams both show cooled water being pumped back underground to be reheated. This requires energy to accomplish, so in the case of hydrothermal plants, where there is naturally occurring hot water underground and therefore no requirement to replenish the water used for energy, the cooled water is not necessarily pumped into the ground. This water is still very hot and can be used for other purposes. In Iceland, the Svartsengi Power Plant near Reykjavik produces electricity and provides district heating (hot water, radiator, and under sidewalk/road ice melt systems) and the “cooled” hydrothermal water is released into the famous Blue Lagoon hot pools, where the water temperatures are still 37–39°C (99–102°F) (Figure 3C.2.16)

EGS does not have abundant hot water below ground, so water must be pumped back down. Some of the energy generated at the EGS plant must be used to do this, which reduces the overall energy that can be harnessed. However, new ideas are emerging that would use EGS as a sort of battery storage for other intermittent energies such as solar and wind power. The idea being that solar and wind cannot control when those energies will be produced (i.e., you cannot control when the sun will shine or when the wind will blow), and as such, energy may be produced when it is not needed and therefore needs to be stored. Storage is typically done with batteries, but the mining and production of batteries have negative environmental impacts. Instead of using batteries for energy storage, the excess solar and wind energy could be used to pump water down into an EGS reservoir, thereby storing this energy until it is needed, when it would be turned into electricity again by the EGS power plant.
The U.S. has the highest share of hydrothermal energy in the world producing enough electricity to power the equivalent of 2.7 million homes. While hydrothermal systems are more energy dense, they require the right underground conditions. EGS has the potential to be used almost anywhere in the world. As it is a newer technology, currently most EGS facilities are pilot or demonstration facilities or are in the development phase, however, the potential for EGS is huge. The estimated heat energy within the U.S. is thousands of times more energy than current annual energy consumption, however, much of this heat is deep, 3-10 km depth, making it expensive and technologically hard to access. Current geothermal wells range from 1-3 km in depth. With current technology, the U.S. Department of Energy estimates over 40 million homes could be powered by EGS derived energy by 2050.
Like the other steam powered energies, geothermal resources can provide constant energy. Geothermal energy is largely emission free. EGS does not emit carbon dioxide during the production of electricity, but hydrothermal plants may, and this is largely dependent on the composition of the existing reservoir fluid being pumped. If the magma source providing energy to this hydrothermal area is outgassing carbon dioxide or sulfur dioxide, then some of this can be incorporated into the hydrothermal fluid and emitted during energy production. Any emissions from geothermal plants are minimal relative to emissions from a fossil fuel burning power plant.
While there is some concern that hydraulic fracturing will induce seismicity, these earthquakes are of a similar nature to those associated with fracking for natural gas, namely relatively small in magnitude. The biggest hurdle for implementing EGS is the high cost associated with building these power plants. They are not as costly as a coal or nuclear power plant but do cost more than a natural gas power plant or any other type of renewable energy facility. It is expected that as technology for EGS improves and demand for renewable energy increases, these costs will fall.
Check your understanding: Geothermal Energy
References
Capareda, S. C. (2013). Introduction to biomass energy conversions. In CRC Press eBooks. https://doi.org/10.1201/b15089
Energy density – Energy Education. (n.d.). https://energyeducation.ca/encyclopedia/Energy_density#cite_note-9
How long will the world’s uranium supplies last? (2009). Scientific American. https://www.scientificamerican.com/article/how-long-will-global-uranium-deposits-last/
Kalak, T. (2023). Potential use of industrial biomass waste as a sustainable energy source in the future. Energies, 16(4), 1783. https://doi.org/10.3390/en16041783
Liu, L., Memon, M. Z., Xie, Y., Gao, S., Guo, Y., Dong, J., Gao, Y., Li, A., & Ji, G. (2023). Recent advances of research in coal and biomass co-firing for electricity and heat generation. Circular Economy, 2(4), 100063. https://doi.org/10.1016/j.cec.2023.100063
Massachusetts Institute of Technology (2006). The Future of Geothermal Energy: Impact of Enhanced Geothermal Systems (EGS) on the United States in the 21st Century. MIT Press (MA). https://wayback.archive-it.org/all/20110310030646/http://geothermal.inel.gov/publications/future_of_geothermal_energy.pdf
McVay, R. (2023). Methane emissions from U.S. gas pipeline leaks. Environmental Defense Fund. https://www.edf.org/sites/default/files/documents/Pipeline%20Methane%20Leaks%20Report.pdf
Quaschning, V. (n.d.). Specific carbon dioxide emissions of various fuels. Volker Quaschning – Erneuerbare Energien Und Klimaschutz. https://www.volker-quaschning.de/datserv/CO2-spez/index_e.php
U.S. Department of Energy (n.d.). Biomass resources. https://www.energy.gov/eere/bioenergy/biomass-resources
U.S. Department of Energy (n.d.). Geothermal – Electricity generation. https://www.energy.gov/eere/geothermal/electricity-generation
U.S. Energy Information Administration (EIA) (n.d.).The nuclear fuel cycle. https://www.eia.gov/energyexplained/nuclear/the-nuclear-fuel-cycle.php
U.S. Environmental Protection Agency (2018). TVA Kingston Site Case Study. https://www.epa.gov/sites/default/files/2018-02/documents/tva_kingston_site_case_study_2017.pdf
World Nuclear Association (n.d.). What is nuclear waste and what do we do with it? https://world-nuclear.org/nuclear-essentials/what-is-nuclear-waste-and-what-do-we-do-with-it.aspx

#/media/File:BlueLagoon_Noface.jpg)