2. Controls on Erosion in Stream Systems
Flowing water is powerful, which gives streams the ability to erode the landscape over which they flow. A stream’s power, and therefore ability to erode, is based on several interconnected factors, such as the steepness of the slope over which it is flowing, its velocity and its discharge. How much power a stream has determines how much sediment and the size of sediment a stream can transport.
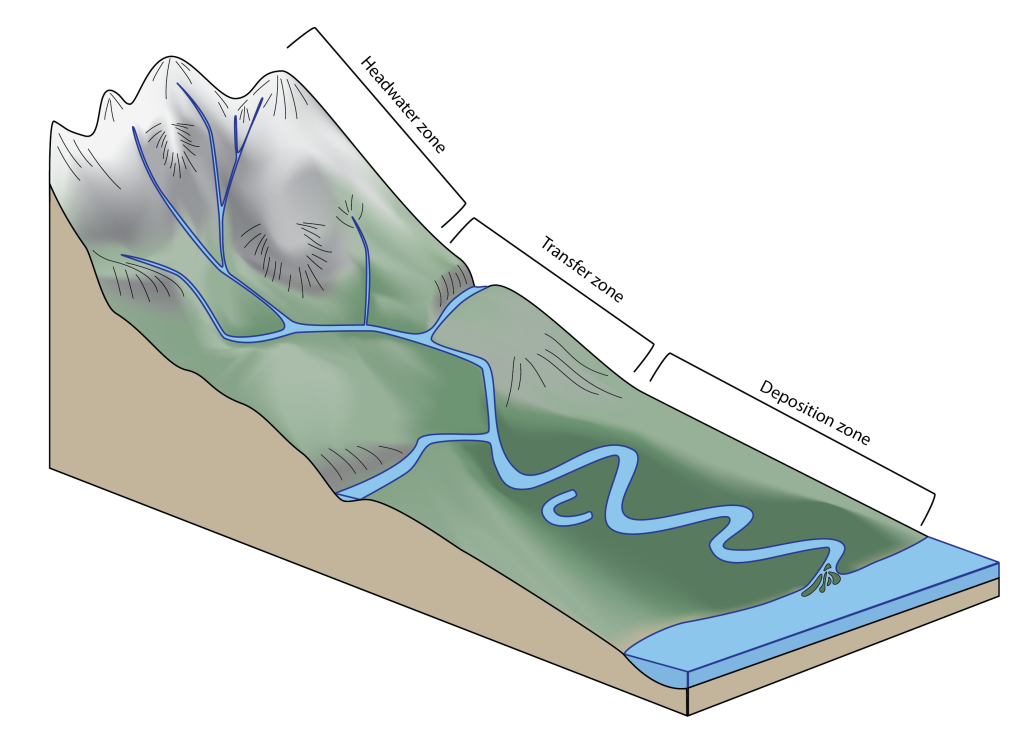
All streams have the same basic shape to their slopes (technically called the gradient) from their heads (start) to their mouths (end). They are steepest near their heads and the gradient gradually decreases towards their mouths. This change in gradient sets up three specific zones within a stream system where erosion, transportation, and deposition of sediment create specific stream features.
Nearest the start of a stream, where the landscape is steepest, is the headwaters zone. In this region, waterfalls, rapids, and deeply eroded V-shaped valleys are common. As the landscape starts to flatten, streams flow through the transfer zone on the way to the gently sloped depositional zone. In the transfer zone, stream valleys start to widen as tributaries come together. In the depositional zone, streams wind their way across broad, flat valleys and floodplains as they make their way toward the mouth (Figure 2B.2.1).
Velocity, which is the speed at which the water is flowing, i.e., the distance water moves in a given amount of time. It has a strong control over which stream features are created in each zone. The velocity of a stream is not uniform along its length or across its width. Higher velocity water has more power and can erode and transport larger sediment sizes. As velocity decreases, the size of sediment that can be eroded and transported also decreases, and larger sediment sizes are instead deposited (Figure 2B.2.2).
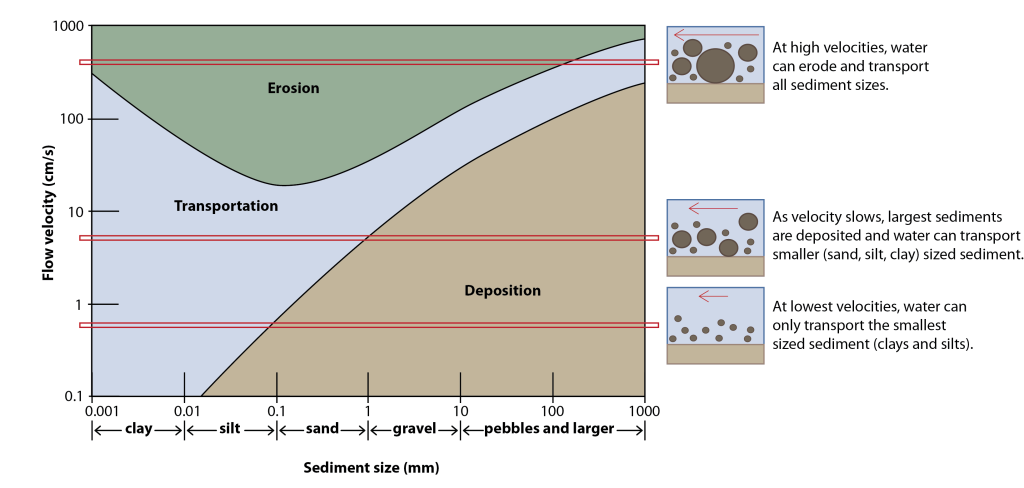
The flow velocities needed to erode material (pick it up off the bottom of the stream) are faster than the velocities needed to keep it transporting downstream. In other words, it takes a little extra effort to pick up the material, but once it is moving with the water it will stay there even at slightly lower velocities. The flow velocity must drop even lower before the material will be deposited. For example, a 1 mm grain of sand will remain resting on the bottom of the stream until the flow velocity is high enough to erode it (~20 cm/s). But once it is in suspension, that same 1 mm particle will remain suspended until the flow velocity drops below 10 cm/s, at which point the stream does not have enough energy to keep the sand moving and so the sand is deposited.
Steeper slopes lead to higher velocity flow as gravity works to pull water downslope. Changes to discharge rates also change the velocity as these two measures of water flow are interconnected.
Discharge is a measure of the volume of water moving past a point in the stream over a given time. As tributaries add more water into a stream system, the volume of water in a stream increases, i.e., the discharge increases. Increasing discharge corresponds to increasing velocity along the length of an entire stream. For example, at the headwaters of the Mississippi River in northern MN, the river is small and shallow with a discharge of 6 cubic feet per second (45 gallons/s or 170 liters/s) and a velocity of 1.2 miles per hour (1.9 km/h). At its mouth, the Mississippi River has reached a discharge of almost 600,000 cubic feet per second (4,488,000 gallons/s or 16,990,000 liters/s) and a velocity of 3 miles per hour (4.8 km/h) in a much, much wider and deeper channel.
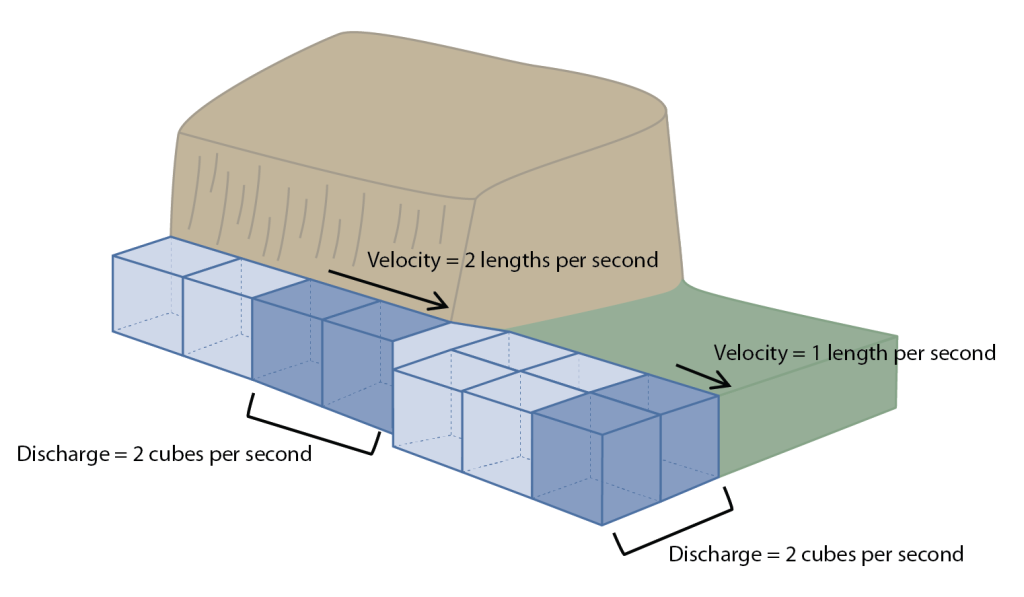
Intuitively, it makes sense that an increase in volume flowing downstream should lead to increased velocity. This is easily visible when rivers flood (increased volume) and those flood waters are seen rushing faster than the stream typically flows. But changing the volume of water is not the only way discharge affects velocity. Over shorter lengths of a stream, where tributaries are not introducing more water, the discharge is constant. With constant discharge, the volume of water moving past a point must stay the same regardless of the space (flow area) it has, which means the velocity of the stream must adjust up or down as the stream area decreases or increases, respectively. So, with equal discharge, a stream running through a narrow valley will flow faster than a stream in a broad flat plain. This is demonstrated in Figure 2B.2.3 showing a river flowing from a narrow valley on the left into a wider channel across a flat plain on the right. For ease of visualizing volume, the river is shown as a square cross section with volumes of water in cubes. The discharge of the river along its length is 2 cubes per second. In the narrow valley, the river channel is narrow, only 1 square in size, so to get 2 cubes through per second the water must flow at a pace of 2 cube lengths per second. On the wide plain, the river channel is wider, an area of 2 squares wide, so to get 2 cubes through this area per second, the water flows at a pace of 1 cube length per second, i.e., much slower than it has to in the valley to keep the same discharge. In this way, the shape of the stream channel itself affects velocity along lengths where discharge is constant.
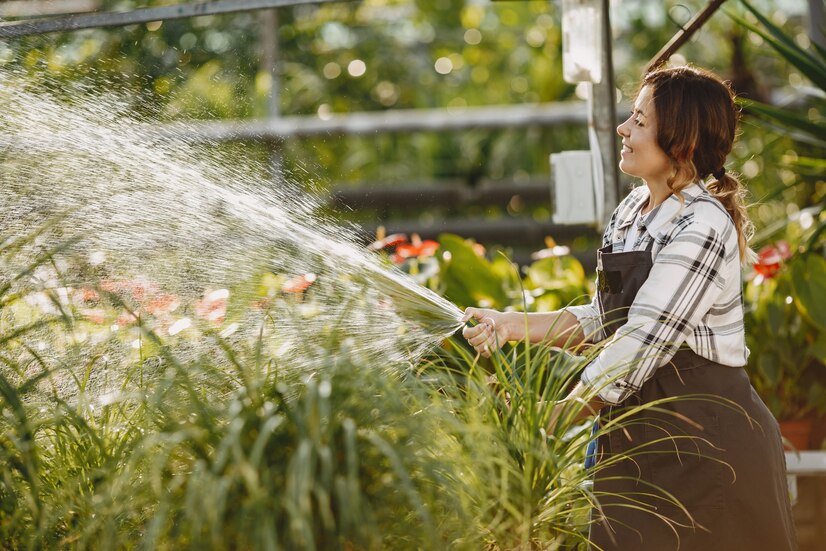
This is the same principle used as kids to spray siblings with the garden hose from across the yard by sticking a thumb over the end of the hose (Figure 2B.2.4). The volume of water coming out of the hose is the same (i.e., we haven’t touched the tap so we haven’t changed the discharge) but by putting our finger over the end, we make the same volume of water have to shoot through a narrower opening in the same amount of time, so the water comes out much faster and harder!
Check your understanding: Controls on erosion
References
National Park Service (2022). Mississippi River Facts. https://www.nps.gov/miss/riverfacts.htm
