5. Impacts of Groundwater Withdrawals for Irrigation
While it is easier to use surface water supplies for irrigation because surface water does not require deep wells to be drilled, if surface water supplies are insufficient for irrigation needs, then groundwater must be used. About 70% of all groundwater pumped globally is used for irrigation. In the U.S., 53% of all groundwater pumped is used for irrigation.
5.1 Groundwater Depletion
It is possible to pump groundwater out of the ground at a faster rate than natural processes can recharge the stored groundwater. This causes the water table height to drop as the groundwater stored in the aquifer decreases. In areas where groundwater pumping exceeds the recharge rate, the water table elevation will drop, and the amount of water stored in an aquifer will decrease. This is an unsustainable use of groundwater and effectively makes groundwater a non-renewable resource as it is being used up faster than it is being generated. This is called groundwater depletion or groundwater mining (Figure 2A.5.1).
Remember that groundwater flow rates are very slow, 1 foot per day down to 1 foot per decade. This makes recharge rates very slow and is the reason groundwater can be pumped out faster than it can be replenished. Recovery of depleted groundwater requires the withdrawal conditions to decrease, and other actions be implemented to help increase recharge from the surface. It can take decades for depleted groundwater to recover if it ever does.
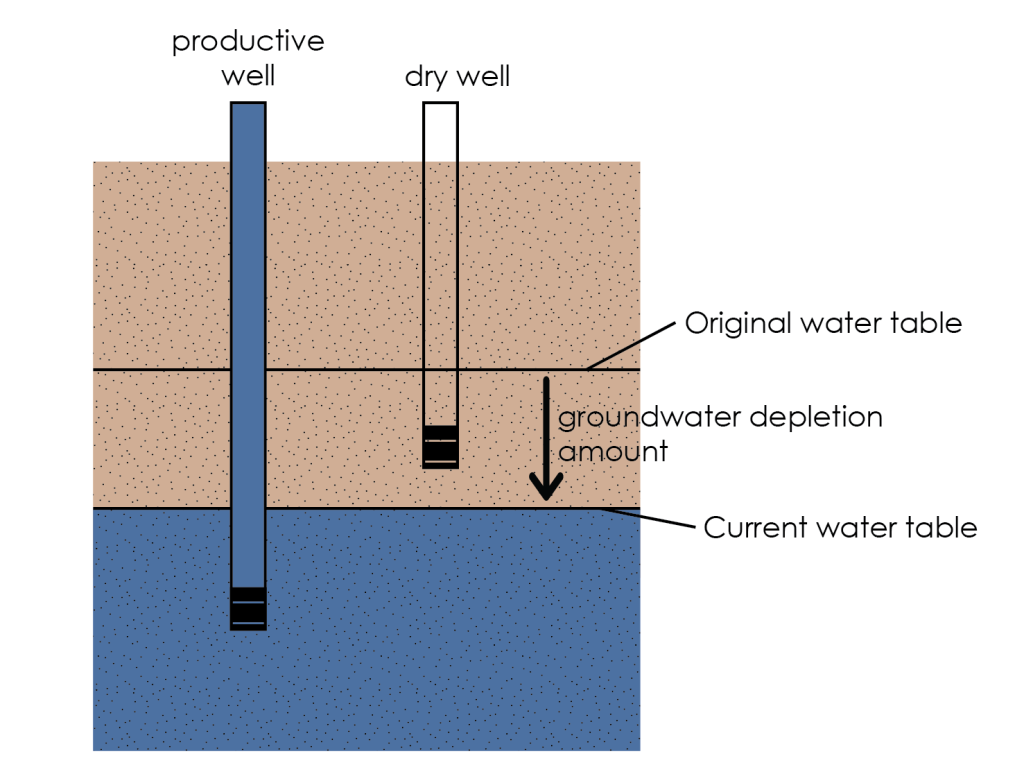
As the water table drops, it might cause some wells to be situated above the water table, such as seen with the well in Figure 2A.5.1. A well whose base is above the water table will no longer be able to pump groundwater, it will be a dry well. For farmers to access the depleted aquifer and withdraw water for irrigation again, a deeper well must be drilled. Drilling new wells is expensive, thousands to tens of thousands of dollars. In addition, deeper wells cost more to run because bigger pumps and more energy is needed to lift water up to the surface from deeper depths. Costs for deeper wells can be prohibitively high for individual farm owners and low-income communities/towns.
A lower water table also affects how groundwater flows. Much like the changes between a wet and dry season water table, a water table that has been lowered due to pumping can also affect lake and river water levels and create long-term lowering of the water levels in these surface water bodies.
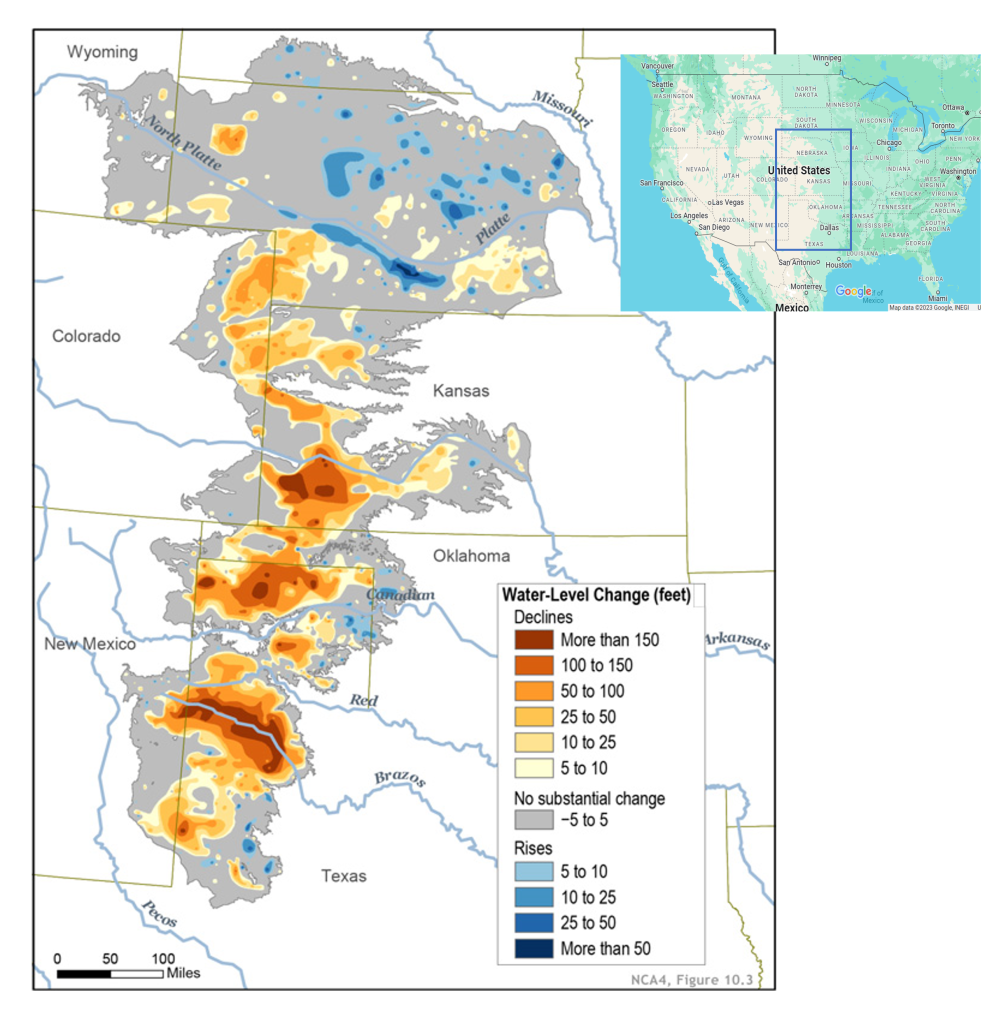
The largest aquifer in the world, the Ogallala Aquifer is situated in the middle of the United States. It underlies parts of Colorado, Kansas, Nebraska, New Mexico, Oklahoma, South Dakota, Texas, and Wyoming (Figure 2A.5.2). Being the largest aquifer in the U.S., the Ogallala Aquifer is a major provider of irrigation water (and other water uses) across the central U.S. Approximately 27% of all irrigated land in the U.S. overlies this aquifer, and 30% of all groundwater used for irrigation in the U.S. is water pumped from the aquifer.
The aquifer is at risk of over-extraction and pollution (from nitrates and other fertilizer compounds leaching down into the aquifer). Large-scale extraction for agricultural purposes started after World War II due partially to center pivot irrigation and to the adaptation of automotive engines for groundwater wells. These combined to allow for much easier (and therefore more) pumping of groundwater. Since 1950, agricultural irrigation has reduced the saturated volume of the aquifer by an estimated 9%. Once depleted, the aquifer will take over 6,000 years to replenish naturally through rainfall.
The map in Figure 2A.5.2 shows changes in Ogallala water levels from the 1940s (prior to any groundwater pumping) through 2015. Declining water levels are shown in red and orange, while rising water levels are shown in shades of blue, with darker colors indicating larger changes. Grey indicates no significant change. Water levels have risen in a few areas, notably Nebraska and some small, localized spots in Oklahoma and Texas, but most of the aquifer from Kansas south has shown a water table elevation lowering, with a decline of more than 150 ft in some locations.
Declining water levels through much of the aquifer resulting from excessive pumping combined with prolonged drought conditions have led to Dust Bowl-like storms throughout the region. Continued climate change is projected to make droughts across the Ogallala region more intense and longer lasting over the next 50 years.
Depletion of groundwater resources is becoming a global concern as aquifers are being pumped at unsustainable rates in the U.S. and all over the world. Enhanced irrigation efficiencies and conservation measures are being implemented when possible to prolong the life of some aquifers.
5.2 Ground subsidence
Excessive groundwater pumping leading to depletion causes more issues than just a persistently lowered water table. In some aquifers, the loss of water in the pore spaces also leads to compaction of the aquifer and subsidence of the ground surface.
As water is pumped from the pore spaces in the aquifer, the aquifer material loses some of its strength as the water itself provides pressure and resistance against being compacted. The loss of water allows the pore spaces to compress and this compression at depth in the aquifer is seen as a sinking of the ground at the surface (ground elevation decreases) (Figure 2A.5.3). This is termed subsidence. Subsidence from groundwater pumping is irreversible; once the pore space has been compressed, it cannot be expanded again. This means the aquifer can never be recharged and filled to the level it was previously.
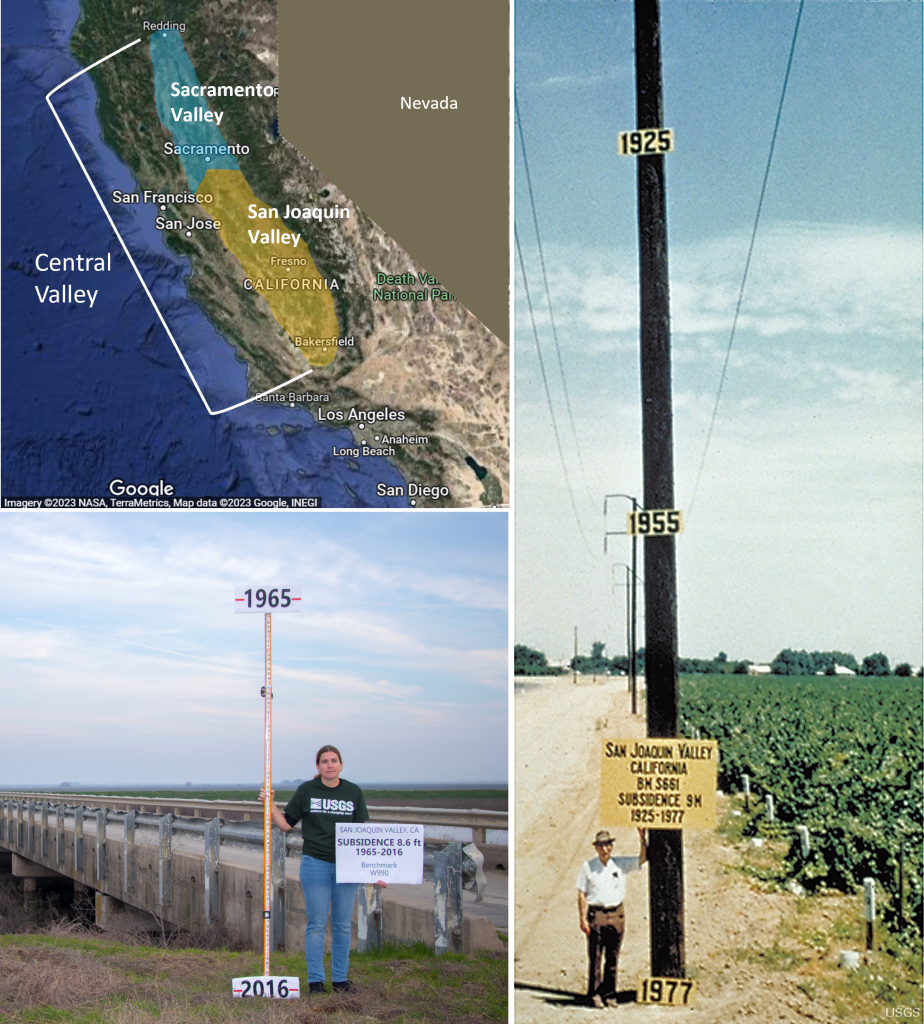
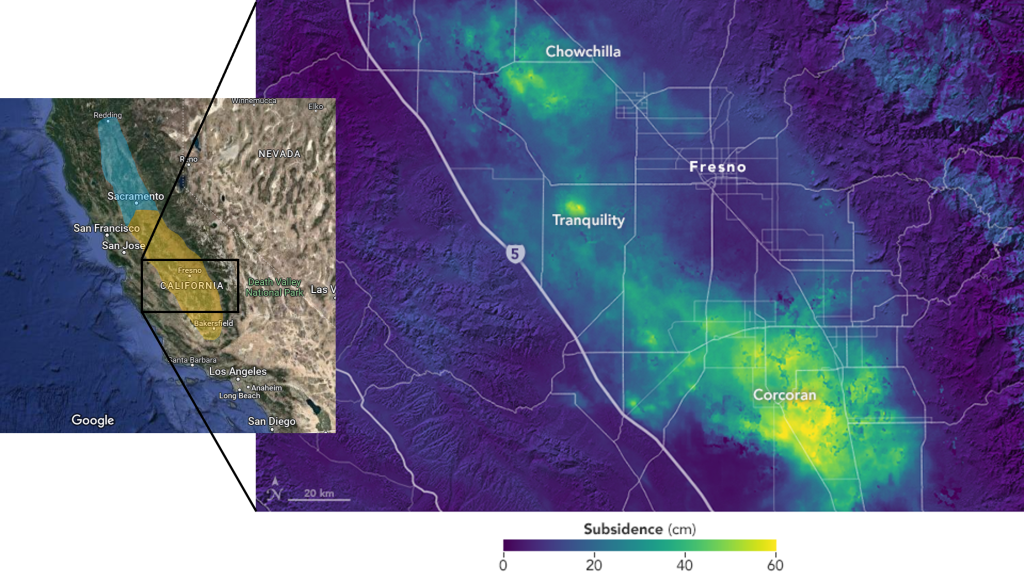
Excessive pumping of groundwater from thousands of wells throughout the San Joaquin Valley has resulted in major subsidence across the region. Since the 1920s, some sections of the valley have subsided more than 9 meters (29.5 feet) (Figure 2A.5.4). Drought conditions have persisted most years in the western U.S., including California, since the mid-2000s, which has exacerbated groundwater depletion and subsidence in this area. During droughts, farmers rely more heavily on groundwater to provide irrigation for this productive agricultural region. This additional pumping causes subsidence rates to increase.
Starting in 2015, California’s Department of Water Resources commissioned NASA’s Jet Propulsion Laboratory to help collect and analyze satellite data to determine the extent to which groundwater pumping through the drought years from 2006 through 2016 had led to ground subsidence. The map in Figure 2A.5.5 shows the total subsidence from May 2015 through September 2016 with the areas of most extensive subsidence in shades of yellow and bright green. Some of the most severe subsidence areas continue to subside at rates as high as 0.6 meters (2 feet) per year. Notably, in the winter months in the San Joaquin Valley, when precipitation more closely matched crop needs and therefore groundwater pumping decreased, NASA found that the rate of subsidence also decreased.
Inequitable Impacts of Groundwater Withdrawals for Irrigation
Long-term groundwater depletion and land subsidence has damaged thousands of public and private groundwater wells throughout the Central Valley. In some areas, due to long-term lowering of the water table, wells are no longer deep enough to reach groundwater. In other areas, wells are still deep enough to reach groundwater except during times of drought or overpumping by neighboring wells.
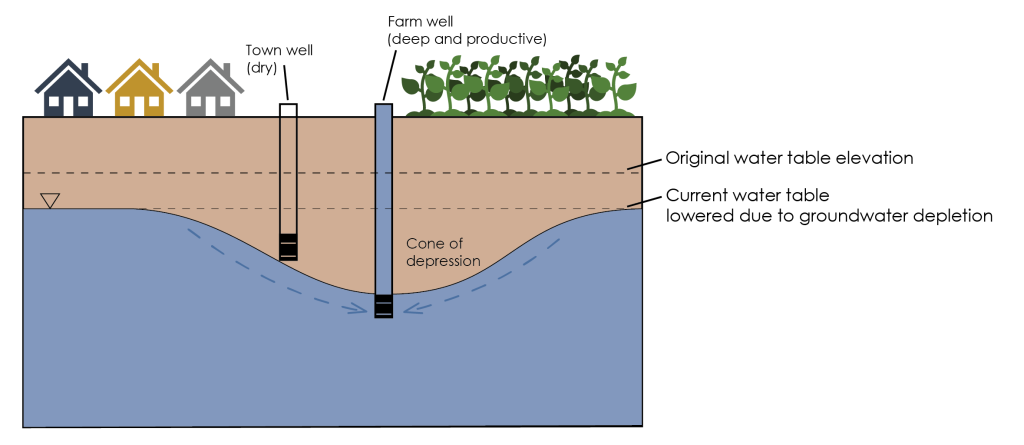
During drought conditions, the water diverted to the Central Valley via aqueducts for farms decreases, so farmers rely more heavily on pumping groundwater. Large farms and farms owned by large agricultural businesses have the economic resources available to install deep wells that reach far below the water table, ensuring the well will not run dry. These wells pump more groundwater than usual during a drought, which means the water table in the nearby area is artificially lowered in a cone shape as water is drawn into the pumping well (Figure 2A.5.6). This cone shaped depression in the water table is aptly named the cone of depression and if this affects nearby wells, they will run dry. Such is the case with many residential drinking water supply wells in the Central Valley.
The districts that control pumping allowances in these areas have largely set pumping restrictions that address what growers want, while failing to address how this affects residential water supplies. The areas hardest hit by these conditions are rural communities in the Central Valley. These are largely comprised of lower income and Latino farm workers.
5.3 Water Quality Issues
There are many ways that water quality can be affected, but a major water quality issue that results from excessive pumping of groundwater and is exacerbated by sea level rise as a result of climate change, is saltwater intrusion. This water quality issue affects most coastal aquifers in the U.S. and is problematic for coastal communities that rely on fresh groundwater for residential consumption or irrigation.
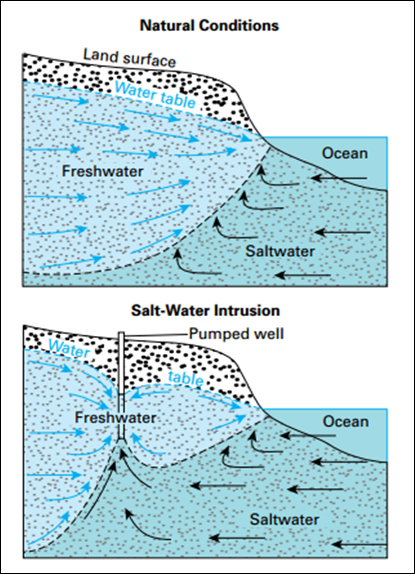
Under normal conditions, fresh groundwater flows through the aquifer towards the oceans. This flow of freshwater keeps the saltwater from pushing too far inland underground. In addition, freshwater is less dense than saltwater, so the freshwater lies in a distinct layer over top of any salt water that does encroach inland (Figure 2A.5.7, top). The density difference between these two waters means they remain in distinct layers with a small zone of mixing where they meet.
Excessive groundwater pumping can alter the flow of groundwater toward the coast and cause saltwater to be pulled up and into the freshwater zone in the aquifer (Figure 2A.5.7, bottom). This contamination into the well of saltwater can be reversed with proper water management and tight restrictions on pumping, however this can be hard to do and in extreme cases of saltwater intrusion, the well might have to be abandoned.
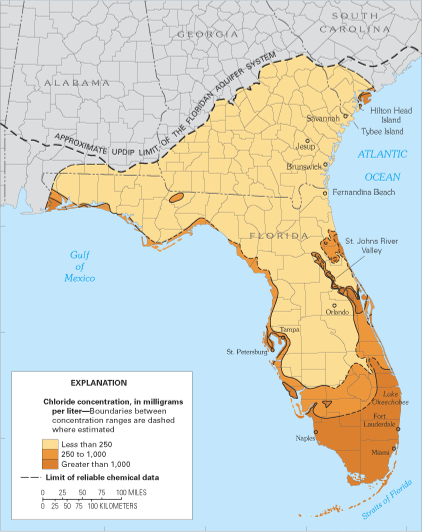
Saltwater intrusion is a problem in most coastal areas. Figure 2A.5.8 is a map of chloride content in the upper aquifer of Florida illustrating how Florida is affected by this issue. Chloride is a major component of saltwater and concentrations above 250 milligrams per liter (mg/L) are considered contaminated. The majority of the coastal areas of Florida have chloride levels above 250 mg/L that extend several miles inland. In the southern peninsula of the state, chloride levels reach concentrations over 1000 mg/L and the zone of contamination in the aquifer extends inland for close to 100 miles.
Check your understanding: Impacts from groundwater withdrawals
References
NASA Earth Observatory. (2017). San Joaquin Valley is Still Sinking. https://earthobservatory.nasa.gov/images/89761/san-joaquin-valley-is-still-sinking
Natural Resources Conservation Service (2011). Ogallala Aquifer Initiative: 2011 Report. U.S. Department of Agriculture. https://web.archive.org/web/20220502213245/https://www.nrcs.usda.gov/Internet/FSE_DOCUMENTS/stelprdb1048827.pdf
U.S. Global Change Research Program (2018). National Climate Assessment 4. Volume II: Impacts, Risks, and Adaptations in the United States. https://nca2018.globalchange.gov/
U.S. Geological Survey. (n.d.) California’s Central Valley. https://ca.water.usgs.gov/projects/central-valley/about-central-valley.html
