Rubino, M., Etheridge, D. M., Trudinger, C. M., Allison, C. E., Battle, M. O., Langenfelds, R. L., Steele, L. P., Curran, M., Bender, M., White, J. W. C., Jenk, T. M., Blunier, T., & Francey, R. J. (2013). A revised 1000 year atmospheric δ13C‐CO2 record from Law Dome and South Pole, Antarctica. Journal of Geophysical Research: Atmospheres 118, 8482–8499. doi:10.1002/jgrd.50668
1. Human Influence on the Climate
1.1 History of Human Influence on the Climate
Anthropogenic change in the Earth system is change caused by humans. Many discussions of anthropogenic climate change place the start of human impacts on the Earth system at the beginning of the industrial era, in the mid-18th century. The industrial era was when humans began to use fossil fuels, mostly coal at the time, on a much larger scale for activities such as manufacturing and trains.
However, some climate scientists place the first anthropogenic impacts much earlier during the first agricultural revolution, when humans transitioned from hunter-gatherer societies to agricultural and settlement societies where forested land was cleared to make agricultural land. This occurred at different times in different locations with the earliest agriculture being in Europe and the Middle East beginning 10,000 to 8,000 BCE. Clearing forests for crops forces climate as the CO2 storage capacity of the crops is generally lower than that of the trees they replace. In Asia, wetlands to grow rice were created around 5,000 BCE. The creation of wetlands is also a climate forcing as anaerobic bacterial decay of organic matter within wetlands produces methane.
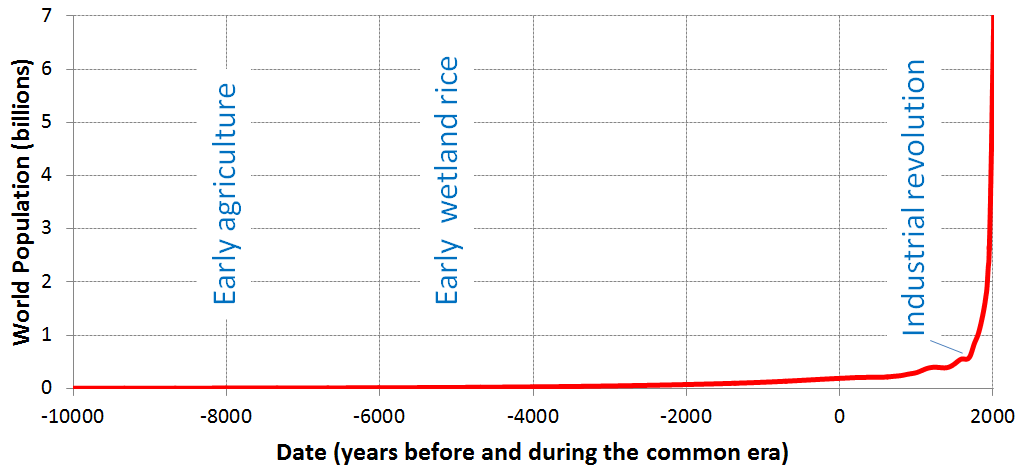
Whether anthropogenic climate change began with the Agricultural Revolution or the Industrial Revolution may be a matter for debate, but it is clear Earth-system change accelerated once the Industrial Revolution began. Partly this is because agricultural activities had to be scaled up to feed an ever-growing population during the Industrial Revolution. When humans first started growing crops, the world population was approximately 5 million (Figure 3D.1.1), which is about half the number of people in the Chicago metro area today. The world population rose to approximately 18 million when wetland rice cultivation began, which is fewer people than live in the New York metropolitan area today. At the start of the Industrial Revolution (1760), the world population was over 800 million. As of 2024, the world population is over 8,100 million (8.1 billion).
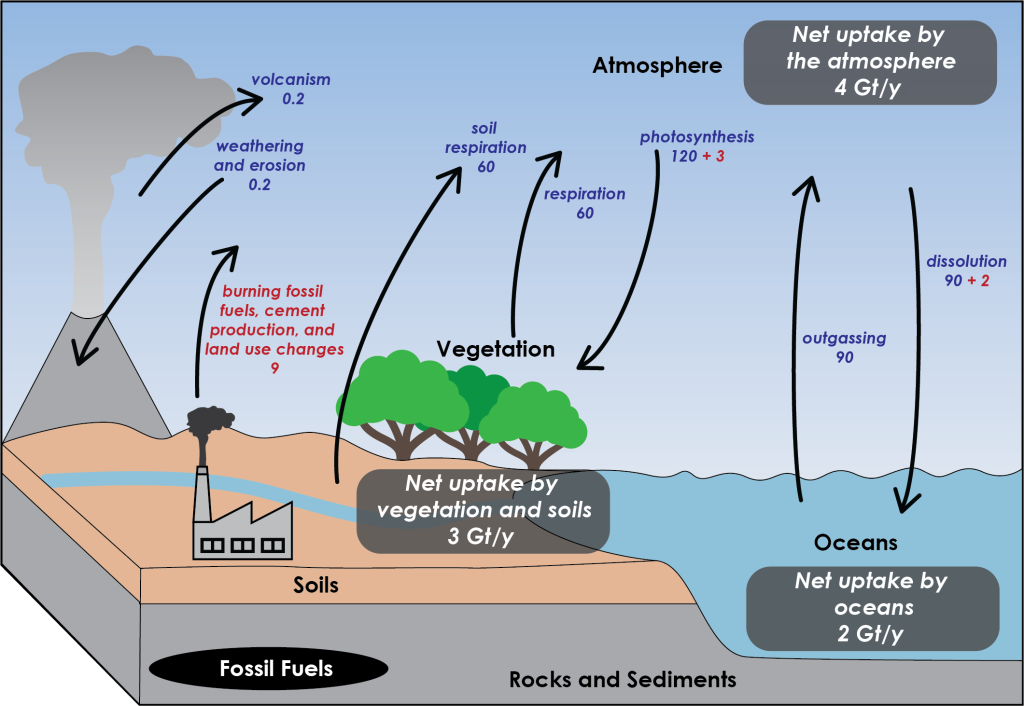
The other reason humans accelerated Earth-system change after the start of the industrial era is that human activities required a source of energy, and fossil fuels such as coal and oil were that source. Burning these fossil fuels rapidly released CO2 into the atmosphere that had been sequestered for millions of years. As discussed in Chapter 3A.4, (and included again as Figure 3D.1.3 below) the anthropogenic release of carbon from burning fossil fuels is not balanced in the carbon cycle, resulting in a net increase in atmospheric carbon.
1.2 Carbon Isotope Fingerprints in Fossil Fuels
Carbon isotopes provide insights into the extent to which fossil fuels have impacted the Earth system, because fossil fuels have a unique carbon isotope fingerprint that is detectable in the atmosphere and in geological materials. There are three isotopes of carbon: 12-carbon, 13-carbon, and 14-carbon. Of these, 14C is radioactive or unstable, and both 12C and 13C are stable isotopes.
Stable Carbon Isotopes (Carbon-12 and Carbon-13)
When plants transform CO2 into tissues, the process imparts a unique carbon-isotope signature to the resulting organic matter. Plants preferentially take in CO2 with the isotope 12C over CO2 with isotope 13C. They do so in a consistent way, giving plant matter a distinctive ratio of 13C to 12C. Fossil fuels are derived from plant materials, and so preserve this isotopic ratio.
The ratio of 13C to 12C is commonly expressed relative to a standard and expressed in “delta notation” (δ), just like how oxygen isotopes measured from seafloor sediments and ice cores are expressed this way. The notation δ13C refers to the ratio of 13C to 12C in a sample compared to the ratio in a standard and is expressed in parts per thousand (or per mil, ‰). The standard has a δ13C of 0‰ and carbon in plant matter/fossil fuels has a δ13C of -25‰ to -30‰, meaning it has a 13C to 12C ratio that is 25 to 30 parts per thousand lower than the standard. In other words, plant material is enriched in 12C, or isotopically very light compared to the standard. Burning fossil fuel releases CO2 with this ratio into the atmosphere.
The δ13C of volcanic emissions is isotopically much heavier than that of plants. Volcanic emissions have a δ13C of -2‰ to -6‰.
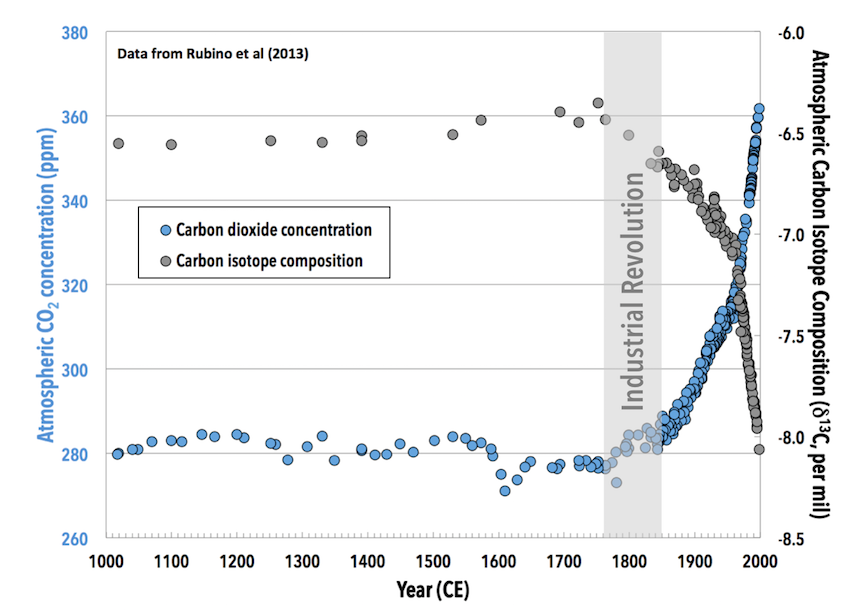
For most of the past 1000 years, the atmosphere has had a δ13C of approximately -6.5‰. The carbon isotope composition of plant matter and fossil fuels is much lower than that of the atmosphere, so the addition of carbon from fossil fuels causes the overall carbon isotope composition of the atmosphere to decrease. An analogy for mixing low δ13C CO2 into the atmosphere would be rapidly adding cold water to a hot bathtub. The faster the cold water is added, the faster the bathwater will cool and the colder the water being added, the faster the bathwater will cool. In this analogy, the atmosphere is the bathtub, and fossil fuels are the water being added. The low δ13C value of fossil fuels (-25‰ to -30‰) is like very cold water being added.
As expected, the carbon isotope composition of the atmosphere takes a sudden downward turn at the same time humans undertake the Industrial Revolution and begin burning large quantities of fossil fuels, adding CO2 to the atmosphere at an accelerating rate (Figure 3D.1.2). The δ13C of the atmosphere is relatively steady just below -6.5‰ for most of the last 1000 years, but at the start of the Industrial Revolution, in the mid-1700s, this starts to decrease and is followed by a more rapid decrease after the late 1800s during the second phase of the Industrial Revolution, which is characterized by a spread in industrialization to countries beyond Great Britain and parts of Europe and the advent of the mass production of steel. The increased fossil fuel usage required to sustain this industrialization decreased atmospheric δ13C to below -8‰, a change of more than 1.5‰.
Scientists who study past climates on Earth are familiar with carbon isotope records like this one, because such records are used to reconstruct major changes in the Earth system through their impact on the carbon cycle. In carbon isotope records from the distant past, a shift of more than 1.5‰ would be enough to catch the attention of a researcher and make them wonder what caused this change.
What is unusual about the 1.5‰ decrease following the Industrial Revolution compared to changes observed in the geological record is how rapidly it is happening. It is more common to see such changes happen over millions of years, not hundreds of years. The rate at which atmospheric CO2 δ13C is dropping is approximately 10 times faster than the carbon isotope shift seen at the PETM, which is the fastest isotopic shift documented in the rock record of the past.
Radioactive Carbon (Carbon-14)
The rate at which radioactive atoms decay is expressed as a half-life. This is the amount of time required for half of the original radioactive atoms (parent atoms) to decay into different atoms (daughter atoms). In other words, a material that had 100 parent atoms when it formed would have 50 parent atoms and 50 daughter atoms once it had gone through one half-life, i.e., half of the parent atoms would have decayed. After another half-life had passed (two half-lives in total), half of the remaining 50 parent atoms would have decayed into daughters, leaving the material with 25 parent atoms and 75 daughter atoms. Each radioactive element has a different known rate of decay, or different half-life.
As carbon-14 radioactively decays, it turns into nitrogen-14, so 14C is the “parent”, and 14N is the “daughter”. The half-life for this decay is 5,370 years. Half-life measurements are commonly used to determine ages of rocks or other materials in the geologic record. By knowing the half-life and measuring how much parent and daughter are present, the age of the material can be calculated.
However, for analyzing anthropogenic climate change, the decay half-life and resulting 14C fingerprint from fossil fuels is not used to calculate an age, it has a different use. Carbon-14 is naturally produced in the atmosphere from the interactions of cosmic rays with nitrogen and this heavy carbon becomes incorporated into plant material and then fossil fuels just like 12C and 13C. Because the half-life of 14C is short (at least in geologic terms), at the age of fossil fuels, millions to hundreds of millions of years old, there is no measurable 14C remaining. This means CO2 emissions from burning fossil fuels have a very different 14C fingerprint than the general makeup of the atmosphere, and this can be measured and analyzed to track fossil fuel additions to the atmosphere. Much like how δ13C is compared to a standard value, so is 14C. The notation used is Δ14C, and scientists have determined there is a decrease in Δ14C of 3‰ for every 1 part per million of atmospheric CO2 added from fossil fuels.
1.3 The Carbon Cycle and Climate Change
Climate change is strongly driven by Earth’s carbon cycle, of which carbon in the atmosphere is just one part. In the carbon cycle today, natural processes as a whole comprise far more of the flow in the carbon cycle than human activities do (Figure 3D.1.3).
The fossil fuels added by humans are particularly problematic because burning them means releasing hundreds of millions of years worth of plant-stored carbon that would otherwise not have been an active part of the carbon cycle today. Contrast this with cutting down a tree and burning the wood. Burning the wood also releases CO2 from carbon that was stored in plant tissues, but the difference is in timescale and quantity. If a tree grows for 50 years before it is used as fuel, then over a century there is effectively no change in atmospheric CO2. What carbon the tree took out of the atmosphere decades before, burning and decomposition have returned.
For fossil fuels, on the other hand, the carbon was removed from the atmosphere tens or even hundreds of millions of years ago. Trees draw down CO2 before we burn them, balancing out the equation, but with fossil fuels there is no initial draw-down from our present atmosphere. Releasing the carbon stored in those fuels results in a net addition to the atmosphere. What makes this even worse is that because fossil fuels have been accumulating for so long, there is an enormous quantity that can be burned. Trees can only be burned as fast as they replace themselves, but with fossil fuels it is like accumulating trees for millions of years, then burning them all at once.
Check your understanding: Carbon isotope fingerprints
References
Earth System Research Laboratory, Global Monitoring Division, NOAA (n.d.). The data: What 14C tells us. https://www.esrl.noaa.gov/gmd/outreach/isotopes/c14tellsus.html
Roser, M., & Ortiz-Ospina, E. (2018). World population growth. https://ourworldindata.org/world-population-growth
