3. Eruption Products and Hazards
The many hazards that can be deadly to human life and damaging to the landscape because of volcanic eruptions are the result of three main volcanic products: lava flows, gases, and pyroclastic materials.
3.1 Lava Flows
Lava flows are the molten rock moving over the ground and then solidifying. How quickly and how far these flows will travel depends on the viscosity of the magma. As discussed in the previous section on explosivity, basaltic magma will be the least viscous, andesitic magma more viscous, and rhyolitic magma is the most viscous.
As the least viscous magma, basaltic lava flows move at the highest speeds, travelling as fast as 10 km per hour/~6 miles per hour, although can move over 30 km per hour/~20 mph under the right conditions, and can flow for long distances, up to several hundred kilometers. Much like water flowing over a landscape, this flow will be controlled by topography and will accumulate and flow farther in low lying landscapes like river valleys.
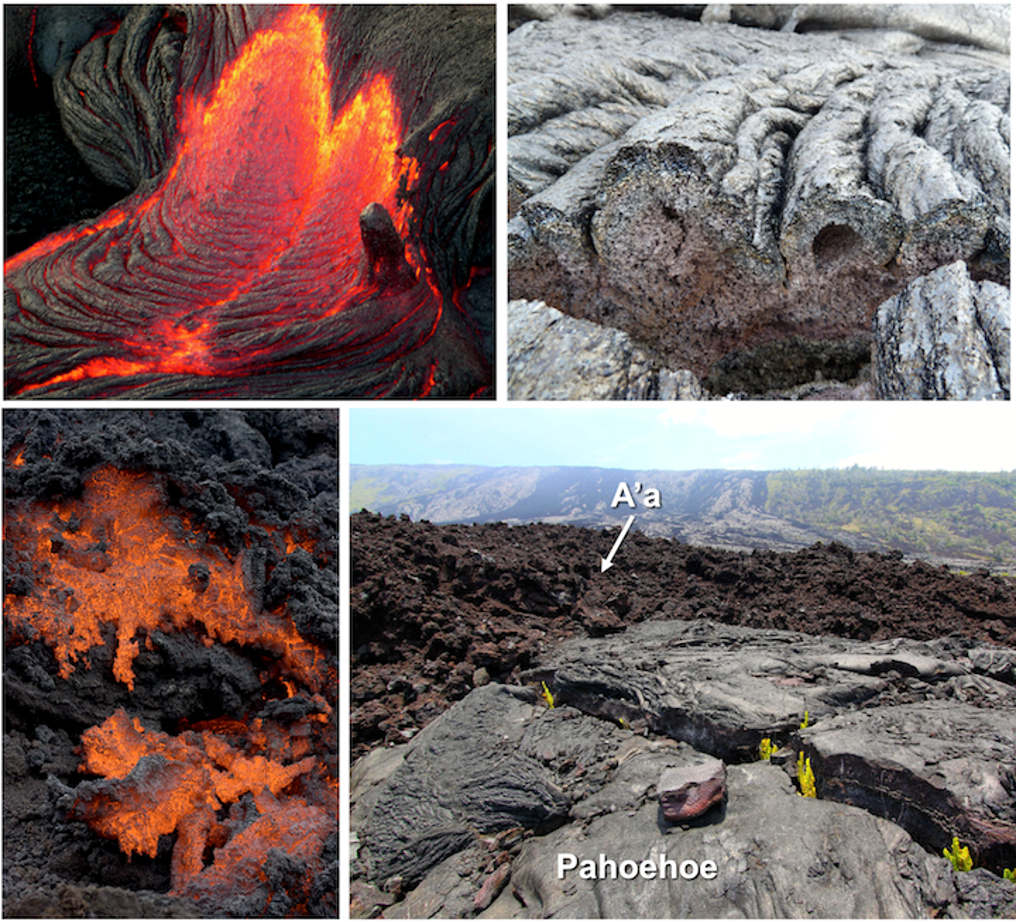
As the basaltic lava cools, it forms various structures and textures. As the lava cools down it forms a skin of cooler, stiffer lava that overlies the hotter, runnier lava. If flow is relatively slow under this skin, the cooled surface is pushed into a distinctive ropy texture called pahoehoe (pa-hoy-hoy; Figure 1C.3.1 top images). The top right picture is a close-up view after a cut has been made to show the internal structure of a wrinkled lava flow. Notice the many holes, or vesicles, within the lava, formed when the lava solidified around gas bubbles.
If the underlying flow is more rapid, the cooled surface is instead broken into sharp, blocky chunks in a texture call a’a (pronounced ah-ah; Figure 1C.3.1 bottom images). The bottom left image shows a close-up view of the advancing front of an a’a lava flow (the flow is moving toward the viewer), and the bottom right image shows an older cooled a’a lava flow viewed from the side. This picture also has an area of pahoehoe lava flow in the foreground. Both words are Hawaiian in origin.
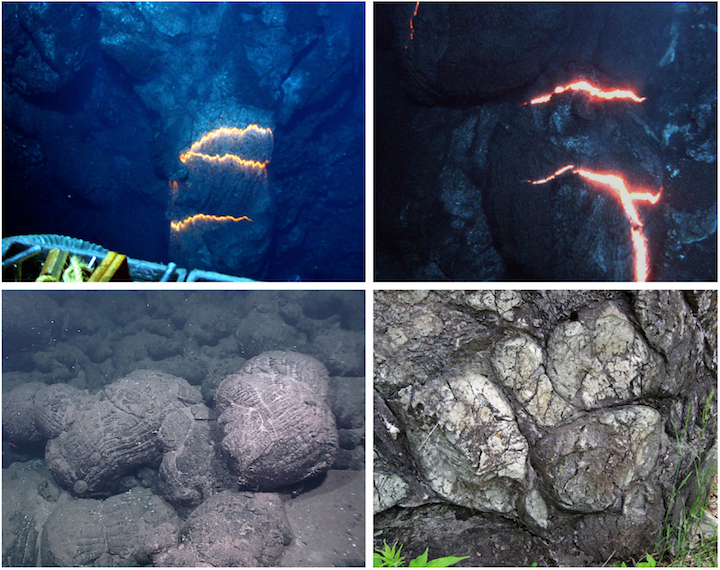
When lava flows into water a structure called pillows will form. These can occur if lava erupts under water or if lava flows across the land and into the water such as is seen in some coastal areas on Hawaii. As lava enters the water, the outside of the lava cools quickly, making a tube (Figure 1C.3.2 top left). Blobs of lava develop at the end of the tube (Figure 1C.3.2 top right) forming pillows. The bottom left of Figure 1C.3.2 shows pillows covering the sea floor, and the bottom right shows the distinctive rounded shape of pillows in an outcrop of rock on land. Because pillows always form underwater, finding them in the rock record gives us information that the environment was underwater when that lava cooled.
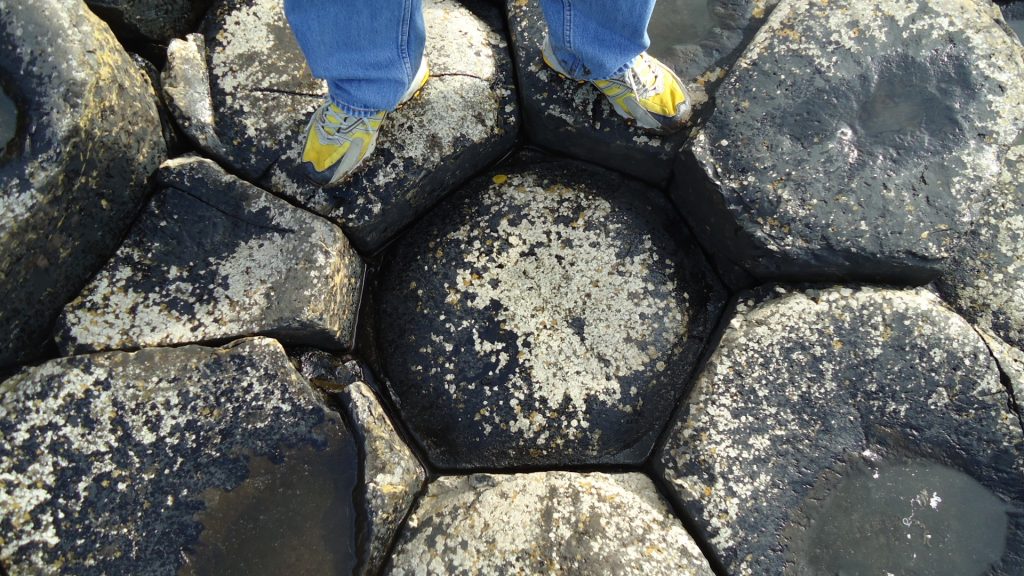
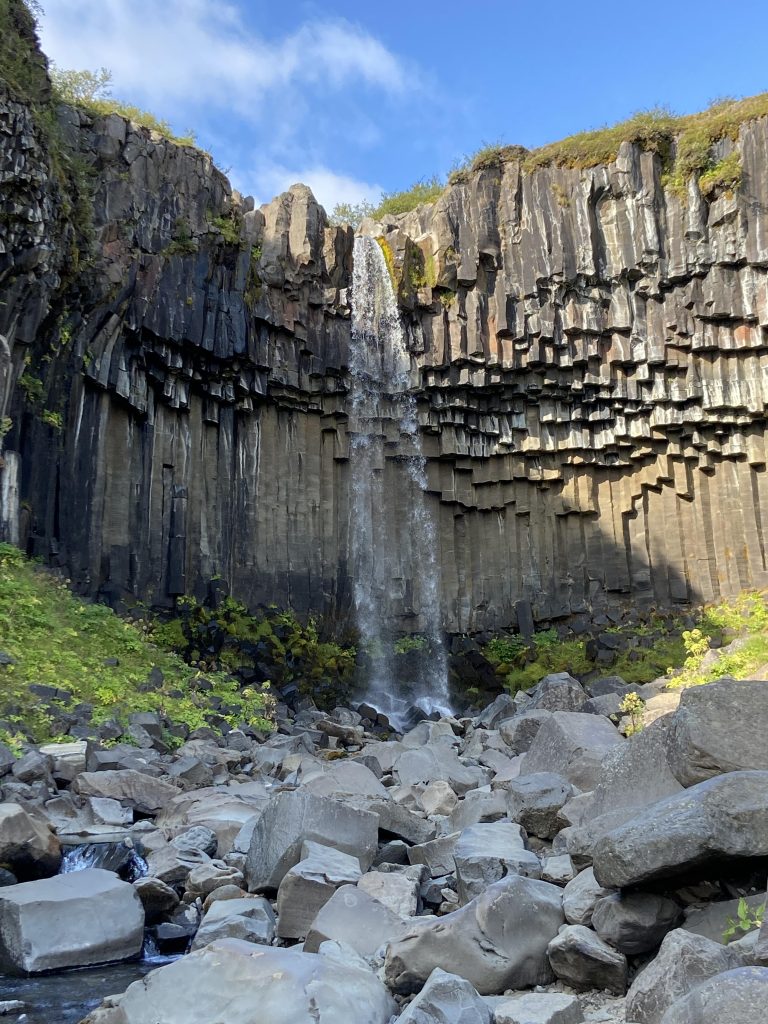
As thick lava flows cool on land they contract and crack into distinct hexagonal columns called columnar jointing. This feature is commonly seen in basalts but can be found in other compositions as well. The joints form 5, 6, or 7 sided polygons (Figure 1C.3.3), as these shapes allow for efficient packing with the minimal wasted space or material. This is seen throughout nature – such as in honeycombs, turtle shells, and when lava cools! Famous examples of columnar jointing include the Giant’s Causeway in Ireland (Figure 1C.3.3), Devil’s Tower in Wyoming, and Svartifoss in Iceland (Figure 1C.3.4).
As andesitic magma is higher viscosity than basaltic magma, these lava flows do not flow as rapidly or as far – typically only a few kilometers per hour/couple feet per second and rarely more than 8km/~5 miles from the vent. Rhyolitic magma, being the most viscous, does not flow much at all, but instead piles around the vent creating a lava dome. These sticky flows move less than a few meters per hour.
Hazards from lava flows
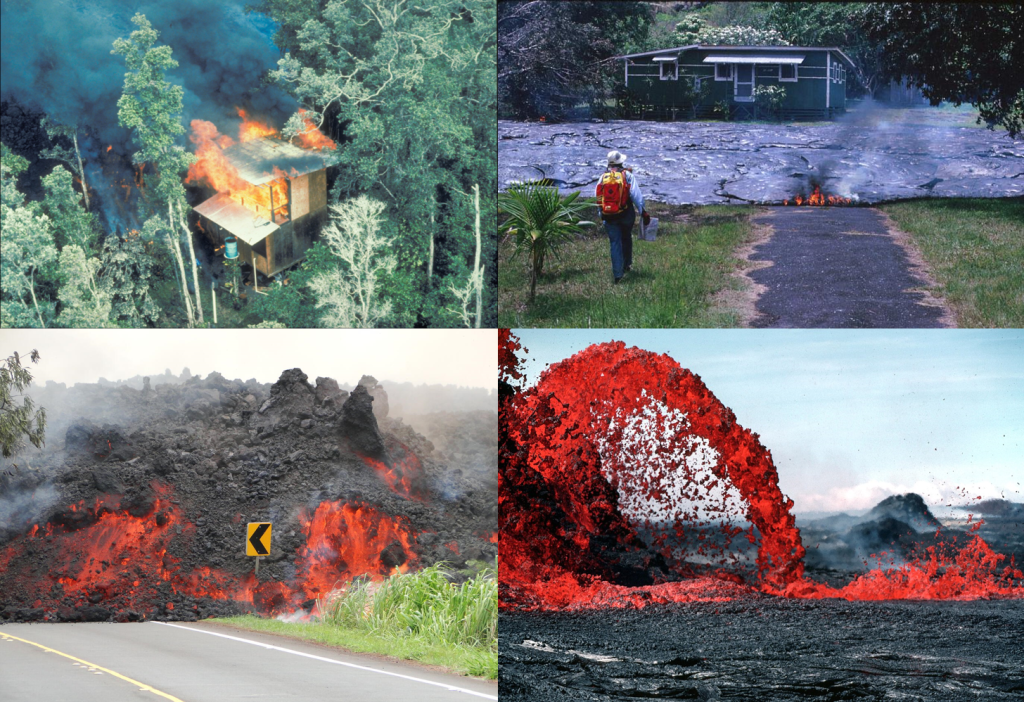
Given the speeds at which lava flows travel, death caused directly by a lava flow is very rare as most people are able to move out of the way of an oncoming flow. Even though there is low risk to human life from lava flows, everything in the path of an advancing lava flow will be knocked over, surrounded, buried, or ignited by the extremely hot temperature of lava. Lava flows therefore affect populations by burning homes, burying farm fields, and destroying infrastructure (Figure 1C.3.5).
The extent of indirect effects of lava flows on populations can be seen by looking at what happened following the May 2021 eruption of Mt. Nyiragongo in the Democratic Republic of the Congo. This was an effusive eruption of basaltic lava that resulted in more than 30 fatalities, including:
- Two people who did not have the assistance they needed to leave their homes to escape the lava.
- Fatalities from collisions as people tried to flee in vehicles.
- Fatalities from asphyxiation when people tried to walk to safety over cooled lava flows but were suffocated by gases still rising from the lava.
There were additional complications with adverse outcomes that will not likely be fully assessed for some time:
- Approximately 230,000 people were displaced without adequate supplies—including food or clean drinking water—resulting in outbreaks of cholera.
- Water supply was cut off for most of the city of Goma (pop. 670,000) because of lava flows
- 1400 children were separated from their parents.
All this disruption happened with lava flows that only barely crossed into the official city boundary of Goma.
Check your understanding: Lava flow structures
3.2 Volcanic Gas
Magma contains gas. Most of the gas emitted by volcanoes is water, but carbon dioxide (CO2), carbon monoxide (CO), sulfur dioxide (SO2), and hydrogen sulfide (H2S), in order of decreasing abundance, are also emitted.
At high pressures, the gases are dissolved in the magma, but if the pressure decreases (such as when magma moves closer to the surface or when a volcano is erupting), the gas comes out of solution, forming bubbles, similar to what happens when opening a bottle of pop. Pop is bottled under pressure, forcing carbon dioxide gas to dissolve into the fluid. As long as the bottle is closed and the pressure remains high, there will be few to no bubbles in the pop. But as the bottle is opened, the pressure is released allowing the dissolved gas to rush out. The pop will begin to fizz as carbon dioxide gas comes out of solution and forms bubbles.
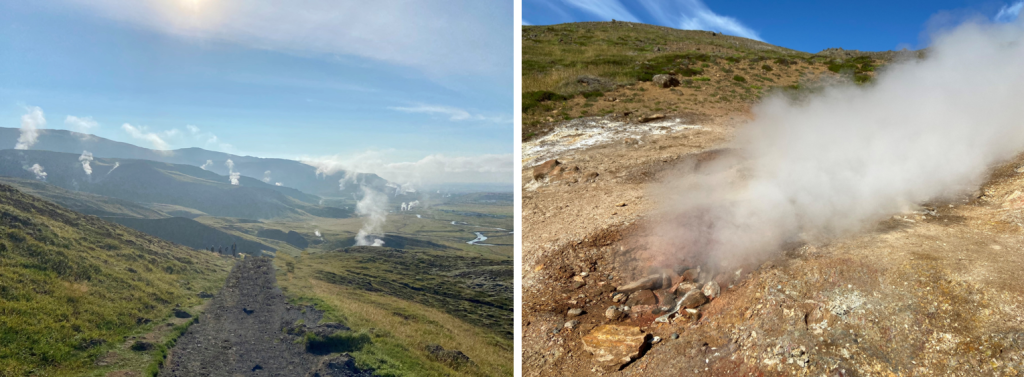
Small vents on the ground through which volcanic gases escape are called fumaroles. Figure 1C.3.6 shows photographs taken in Reykjadalur Valley, Iceland, which is a highly active geothermal area full of fumaroles powered by the underground magma in the region. The clouds rising from the ground are mainly steam (water) but also contain other volcanic gases and give the area the distinct smell of hydrogen sulfide (rotten eggs).
Hazards from volcanic gases
The threats to humans from volcanic gases are varied and can cause short term immediate illness/death or create longer term changes to the climate thereby affecting crops, ecosystems, and human health. The section on pyroclastic material will discuss the combined effects of gas and ash on the climate.
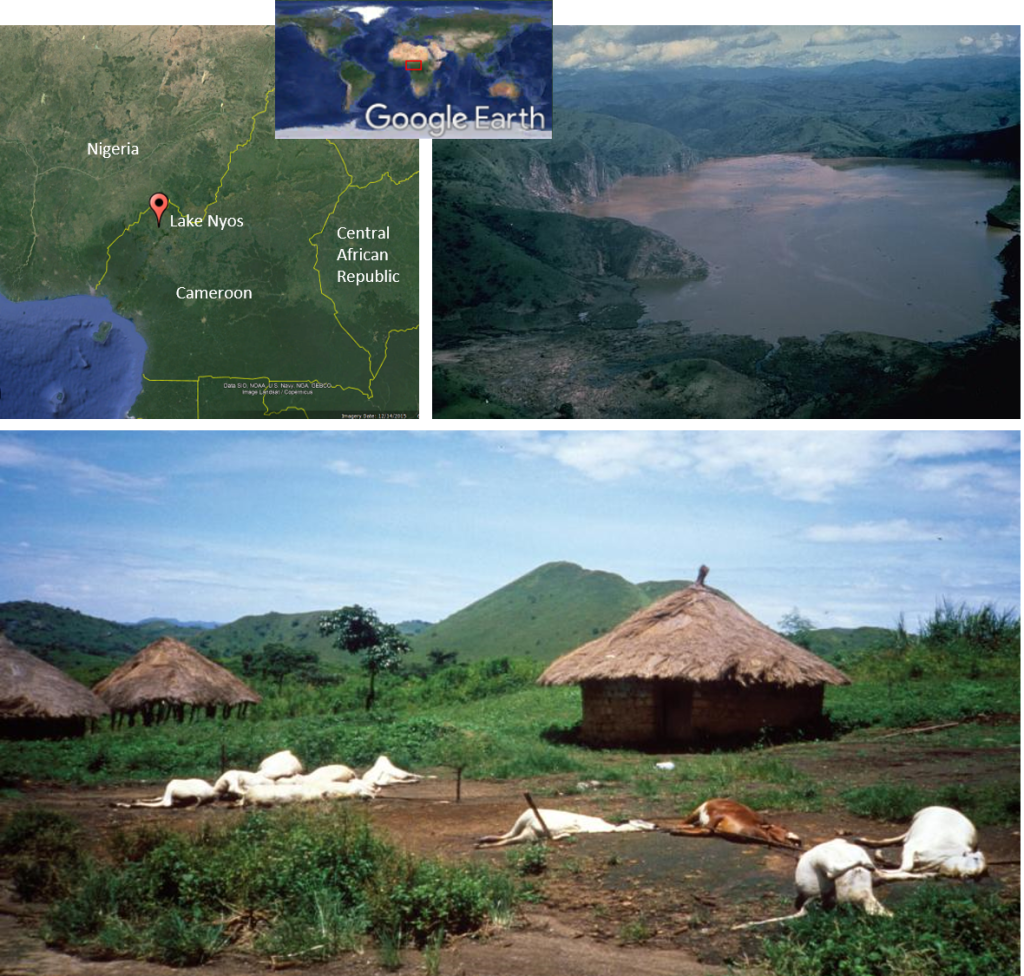
Acute respiratory illnesses or death can result from the release of volcanic gases as many of them are poisonous at low concentrations. A sudden release of volcanic gases on August 21, 1986, from Lake Nyos, Cameroon resulted in the deaths of over 1700 people and over 3000 cattle. Lake Nyos is a lake occupying a volcanic crater created several hundred years ago. The volcano itself was not active, nor actively erupting, but the volcanic conduit was still slowly outgassing (mostly carbon dioxide) from deep inside the Earth into the lake. The carbon dioxide built up in the bottom waters of the lake over a prolonged period and for an unknown reason was catastrophically released in one large pulse (studies suggest various triggers including a landslide or overturning of the lake water). As carbon dioxide is denser than air, this created a large cloud of almost pure carbon dioxide that hugged the ground and flowed downhill from the lake through valleys passing through various villages. This cloud was 50-100 m (160-320 ft) thick and covered an area of approximately 29 km2 (11 sq mi). Carbon dioxide is lethal at concentrations above 8-10% and the people and cattle caught in this cloud suffocated (Figure 1C.3.7).
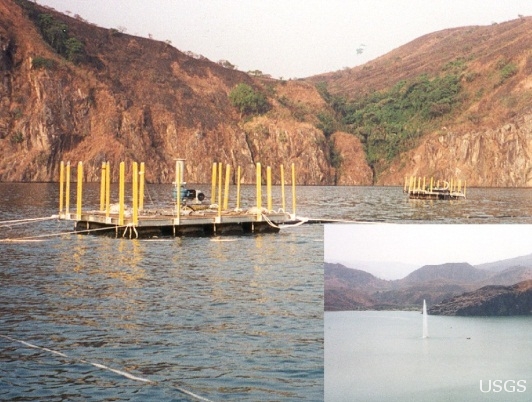
The scale of this disaster and the potential for future similar disasters led to the installation of degassing pipes in Lake Nyos starting in 2001. These allow CO2 to slowly release from the bottom waters at a safe level and prevent a large build up and future disaster from occurring (Figure 1C.3.8).
Excerpt from the 1986 USGS report on the Lake Nyos tragedy:
On Thursday evening, 21 August 1986, tragic events occurred at this idyllic lake that made it known throughout the world as a “killer lake.” The early part of the evening began with heavy rains and thunderstorms typical of the rainy season. By 9:30 P.M., however, the weather was calm, the air temperature cool, and most people were engaged in their usual evening activities. This tranquil scene was suddenly disturbed by a series of rumbling sounds lasting perhaps 15-20 seconds. Many people in the immediate area of the lake came out of their homes, experienced a warm sensation, smelled rotten eggs or gunpowder, and rapidly lost consciousness. Other individuals either became unconscious without preliminary symptoms, or never awakened from their sleep. One observer, who was on high ground above Lake Nyos, reported hearing a bubbling sound. Walking to a better vantage point, he saw a white cloud rise from the lake, accompanied by a large water wave that washed up onto the
southern shore. None of the survivors in the valley saw a visible cloud.
Survivors of the incident awakened 6 to 36 hours later, and many found that their oil lamps had gone out while still containing oil, their animals and members of their family were dead, and they themselves were weak and confused. About 1,700 people and 3,000 cattle died near the lake and along drainages up to 10 km north of the lake. The pattern of death within this
region was definitely not uniform. For example, in the Nyos area there was a pen with four of the five goats dead, and nearby a home where only four of the nine family members survived. Cattle in the lower lying areas perished, while those at the higher elevations were still grazing normally. Many small animals died, but many others were still alive. The bird and insect populations were significantly reduced for at least 48 hours, but the plant life remained essentially unaffected. As best as could be determined, however, the humans and animals that did not
survive died very quickly with no signs of panic or discomfort.
3.3 Pyroclastic Materials
As gas bubbles escape, they can violently propel lava and other materials from a volcano. The particles ejected from a volcano are called pyroclasts, which leads to the general collective names of pyroclastic materials or pyroclastic debris. Pyroclasts can be ejected as high as troposphere (up to 20 km) or even stratosphere (up to 50 km) altitudes where it can be transported great distances by the wind. Once this material settles on the ground it is called tephra (although in practice the terms tephra and pyroclastic material/debris often get used interchangeably despite the subtle difference in definition).
While effusive and explosive eruptions can both produce pyroclastic materials, the volume and type of pyroclastic material produced, the altitude to which pyroclasts are ejected, and the area that is affected by pyroclastic material are all typically much greater with explosive eruptions.
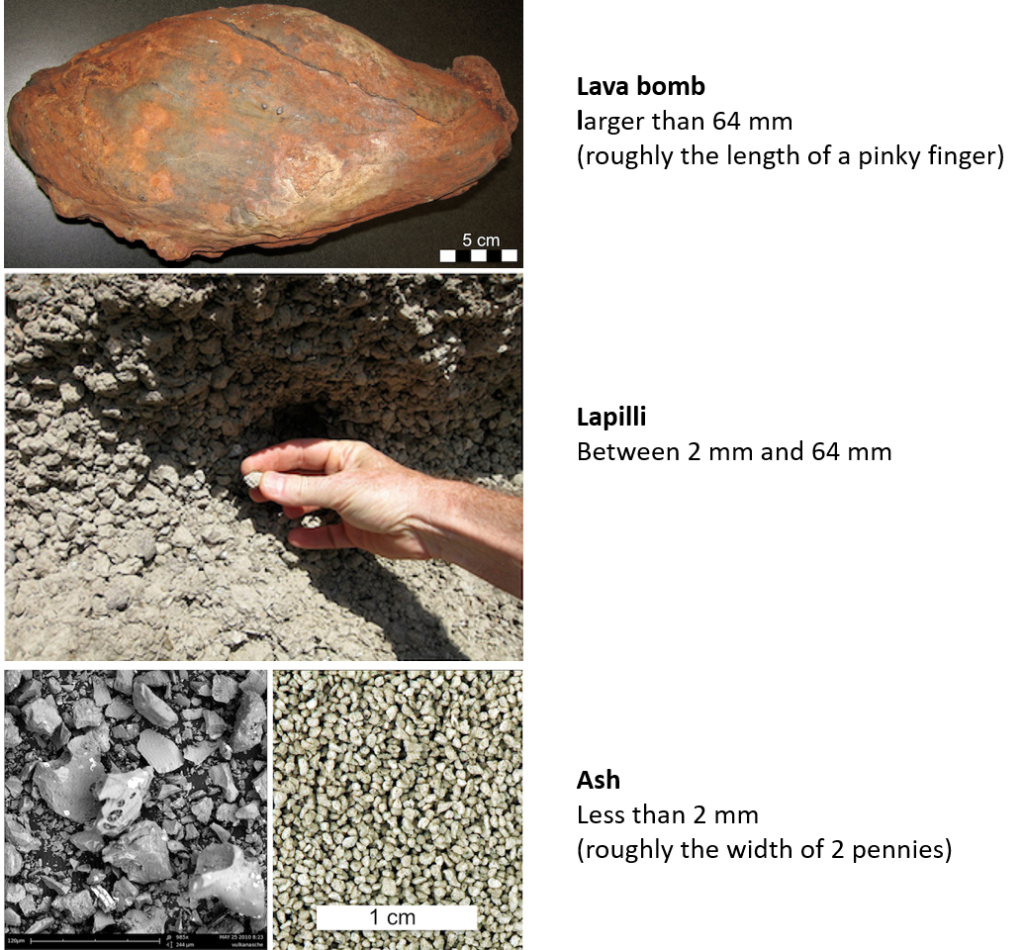
Pyroclasts are classified according to size (Figure 1C.3.9):
Largest: Lava blocks and bombs (greater than 64 mm). Blocks are made when solid parts of the volcano shatter and are thrown during an explosive eruption. Bombs are large blobs of lava that are ejected and cooled as they travel through the air, causing many to take on streamlined shapes.
Medium sized: Lapilli (2 mm to 64 mm) are droplets of lava that cool in the air. These can take on glassy teardrop shapes (called Pele’s tears), get pulled out into thin glassy strands (called Pele’s hair), or form small gravel-like pieces.
Smallest: Ash (less than 2 mm) can range from microscopic to visible at its largest. These are small mineral grains and volcanic glass.
Hazards from pyroclastic materials
Given the increased volume and violence with which pyroclastic materials are expelled from a volcano during an explosive eruption, the threats associated with these materials are dominantly associated with explosive eruptions. There are 4 major hazards related to pyroclastic material: ash falls, pyroclastic flows, lahars, and climate disruptions (this last one is a result of volcanic gas as well). The eruption of Mt. St. Helen’s, Washington in 1980 can be used as a case study to learn about all of these.
Background on 1980 eruption of Mt. St. Helen’s
Prior to 1980, Mt. St. Helen’s had sat dormant since 1857. On March 16, 1980, the first signs of Mt. St. Helen’s waking up began with small earthquakes. These continued with steam blasts and small eruptions also occurring over the next 2 months. Over this time, the north side of the volcano began to bulge as magma and pressure built up inside. On May 18 at 8:32 an earthquake triggered a massive landslide and the bulged area on the north side of the volcano slid off releasing the built-up pressure. This resulted in a lateral blast (volcano blew out sideways) that flattened over 600 km2 of forest – trees were knocked over like toothpicks.
The hazards that resulted from this eruption (pyroclastic flows, lahars, and ashfalls) were the deadliest and costliest in U.S. recorded history, killing 57 people and destroying 200 homes, 47 bridges, 24 km (15 mi) of railways, and 298 km (185 mi) of highway.
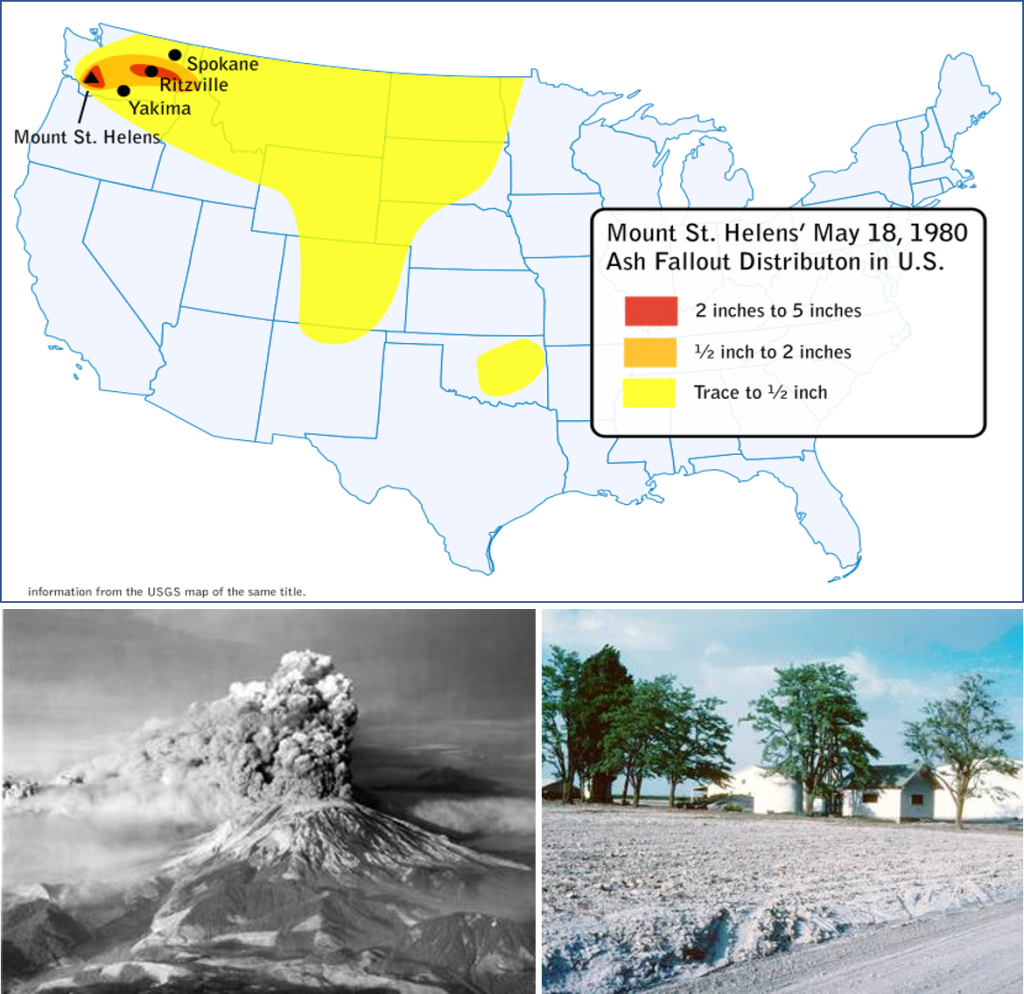
Ash Falls
As ash is ejected from an explosive eruption it creates a large cloud of ash with the larger, heavier particles (greater than 0.1mm) falling out close to the volcano and smaller particles being transported greater distances by the wind. When Mt. St. Helen’s erupted on the morning of May 18, 1980, a volcanic ash cloud filled the sky rising 24 km (15 mi) into the atmosphere, blocking the sun and turning the morning to darkness (Figure 1C.3.10 bottom left). The ash drifted with the wind for hundreds of miles falling and covering areas across eastern Washington, Idaho, and western Montana with thicker layers of ash. Thinner layers of ash extended far beyond this. (Figure 1C.3.10 top map). The buildup of ash caused officials to close highways for a week and airlines canceled more than 1,000 flights. Roads, telecommunications, electrical power systems, and water treatment facilities were all affected. The thick coating of ash over farm fields led to the destruction of many crops (Figure 1C.3.10 bottom right). In addition to these effects, thick accumulations of ash are heavy and can overload roofs causing structural damage or even collapse – this is particularly true if the ash becomes wet from later rainfalls.
The other serious threat to human health from ash comes from inhaling the fine particles. The very fine particles of ash are a combination of crystalline silica and volcanic glass which are dangerous to inhale as they can lead to chronic lung diseases such as silicosis. Following eruptions, the levels of particulate matter can rise to unhealthy levels making it dangerous for everyone, and particularly dangerous for people with asthma and other lung issues. Following the 1980 eruption of Mt St Helen’s, the number of hospital attentions related to asthma increased during the weeks after the eruption and also aggravation in people suffering chronic respiratory disease.
Pyroclastic Flows
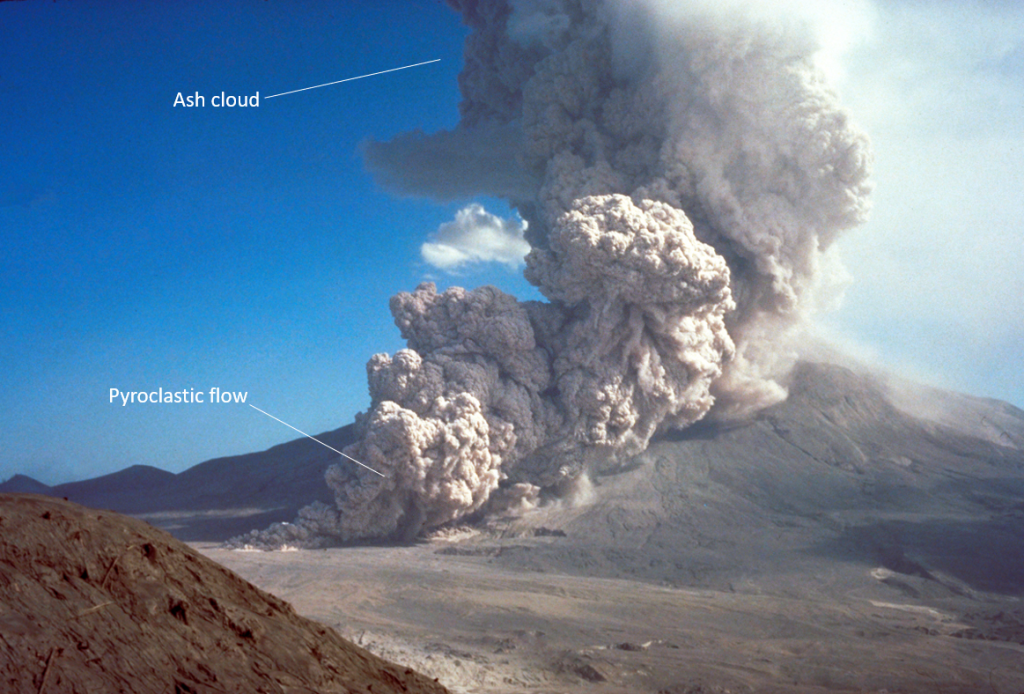
Pyroclastic flows are turbulent mixtures of gas and pyroclastic material that flow down the sides of the volcanoes at speeds averaging 100 km/h (60mph), although can be much faster if the conditions are right. They are powerful enough to knock down, shatter, bury, or carry away nearly everything in their path and leave behind deposits up to 200 m (700 ft) thick. They are extremely hot with temperatures greater than 500o C (930o F), and capable of igniting fires and melting snow and ice. These are one of the most dangerous of all volcanic hazards and are a result of explosive eruptions, but luckily, they typically only travel about 5 km (3 mi) from the vent.
Mt. St. Helen’s erupted from a bulge that had developed on the north flank, near the top of the volcano. As a result, instead of erupting straight up, much of the eruption activity was focused northward, including the pyroclastic flow. Figure 1C.3.11 shows a photograph taken from a peak about 8 km (5 mi) north of Mt. St. Helen’s during the eruption. The pyroclastic flow is visible as the cloud of material moving downslope on the ground surface. This flow extended approximately 8 km (5 mi) from the vent.
Lahars
Lahar is the term given to a volcanic mud flow or debris flow (in official categorizations mud is smaller in size than debris). They are given this special name to distinguish them from a typical mud or debris flow because the mud is not just any old type of mud, it is specifically a wet slurry of pyroclastic debris (mainly ash, but larger material as well). Given the requirement for lots of pyroclastic material, these are commonly associated with stratovolcanoes, but do also occur less commonly at shield volcanoes.
Lahars are like fast flowing rivers of wet concrete – very dense and very powerful. They can move at speeds around 75 km/h (45 mph) up to 200 km/h (120 mph) on steep terrain and can pick up and entrain everything they move past: soil, trees, rocks, even buildings and bridges. These flows get funneled into low lying areas on the landscape, such as river valleys, and depending on the size of the lahar and the shape of the landscape, it is possible for them to travel several hundred kilometers before they eventually stop. Along this path, as the lahars lose speed in the flatter river valleys, they leave behind thick deposits of muddy material.
Unlike the other volcanic hazards, lahars do not need a volcanic eruption to occur. While the heat from an erupting volcano can melt ice and snow to provide the water source for a lahar, it is also possible to have lahars without an eruption. Heavy rainfalls or breakout floods from crater lakes can supply the needed water, which can occur without any eruption at all. But this also means they can occur without the warning that imminent eruptions provide.
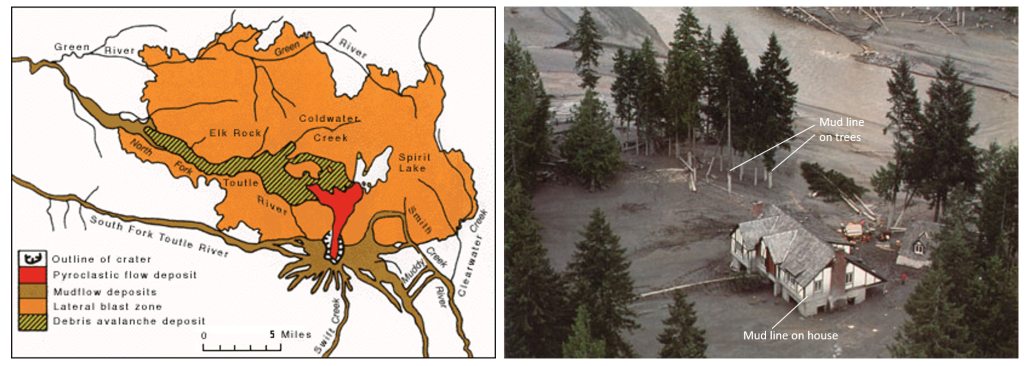
In the case of Mt. St. Helen’s, the eruption led to the rapid melting of snow, ice and large glaciers on the volcano. This water combined with tephra on the volcano’s slopes to create massive lahars that funneled into the river valleys (Figure 1C.3.12). These lahars were 10-20 m (33-66 ft) deep in places. So much sediment was moved and deposited that the bed of the Columbia River rose by nearly 30 ft in some areas causing shipping traffic to be halted.
Rivers in this area continue to transport about ten times more sediment downstream than they did pre-eruption. The enormous amount of extra sediment continues to pose challenges for flood protection and fisheries today, decades later.
Given the distance lahars can travel, and therefore the number of people that can be affected, they are considered the deadliest hazard associated with volcanoes in the Pacific Northwest, particularly in communities living in river valleys.
Climate disruptions
Large volumes of gas and ash ejected from volcanoes can lead to changes in the climate system which can be quite drastic even though they are relatively short lived (days to weeks to a couple of years).
Immediately following the 1980 eruption of Mt. St. Helen’s, nearby areas were up to 8o C (~16o F) cooler during the daytime hours as volcanic dust (fine grained ash particulates) blocked out solar radiation (heat from sunlight). Overnight, temperatures stayed roughly 8o C (~16o F) warmer as the dust acted like a blanket keeping radiation in.
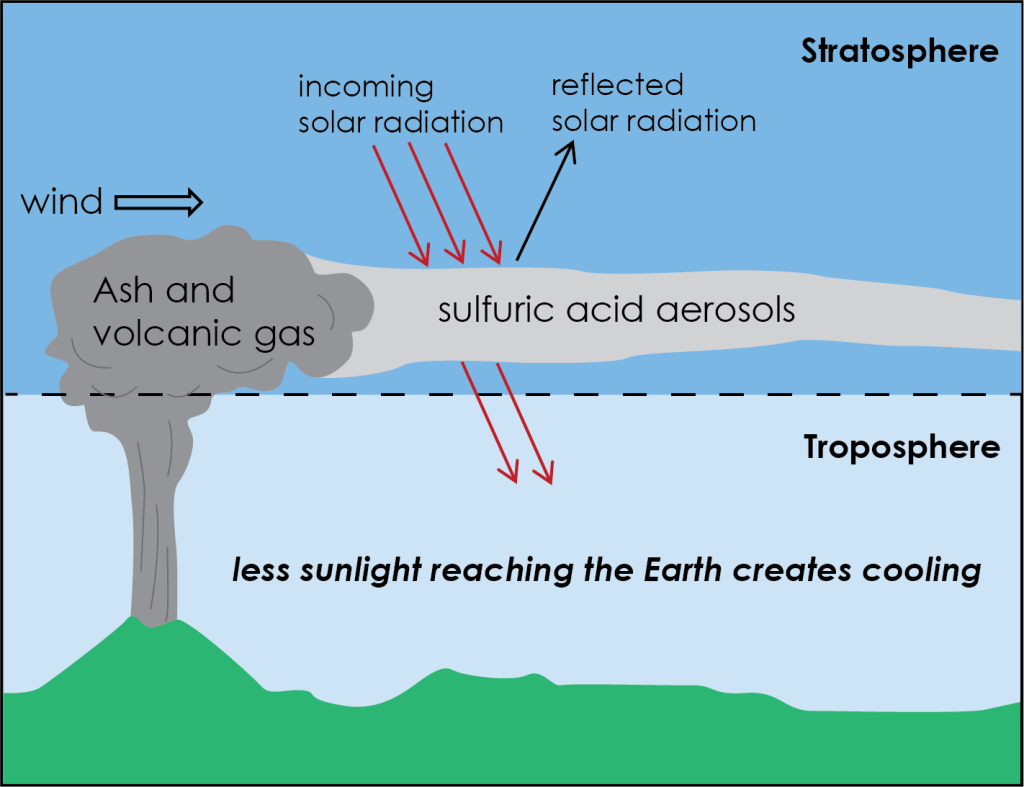
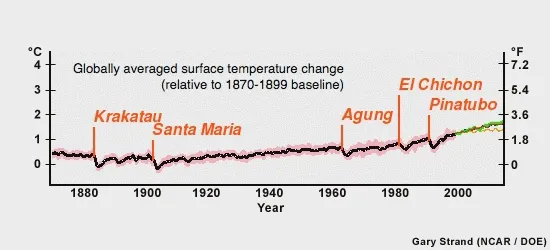
Fine ash particles settle out of the atmosphere relatively quickly, so the climate effects from dust last only days to weeks. The longer-term effects to climate are a result of volcanic gases, which can last several years. Large eruptions can emit sulfur dioxide to stratospheric levels (20-50km altitudes). At these altitudes, instead of behaving like a greenhouse gas and warming climate like it does at lower altitudes, it combines with water to make sulfuric acid aerosols that create a mist of sulfuric acid water droplets that reflect solar radiation leading to cooling (Figure 1C.3.13). These droplets can be transported around the globe by winds and remain in the stratosphere causing cooling for one to two years (Figure 1C.3.14).
Carbon dioxide (CO2) is another major gas emitted during volcanic eruptions. It is the primary gas discussed in terms of climate change and, unlike sulfur dioxide, causes warming regardless of atmospheric level. While detectable global cooling has resulted from volcanic sulfur dioxide emissions, the carbon dioxide released from contemporary volcanic eruptions has not caused detectable global warming. Studies of global volcanic carbon dioxide emissions show that present day volcanoes release less than one percent of the carbon dioxide released currently by human activities. An ongoing topic of scientific debate and research is studying if the volcanic release of carbon dioxide from ancient flood basalts (which would be many times more CO2 than a regular volcanic eruption) contributed to global warming and some mass extinctions in the geologic past.
The 1980 eruption of Mount St. Helen’s vented approximately 10 million tons of CO2 into the atmosphere in 9 hours. This is a significant amount of CO2; however, it currently takes humanity about 2.5 hours to put out the same amount. Large explosive eruptions like this are rare and an eruption of this size occurs approximately once every 10 years on the planet. Human emissions on the other hand are continuous and increasing yearly.
Check your understanding: Volcanic products and hazards
References
U. S. Geological Survey (2023). 10 Ways Mount St. Helen’s Changed Our World. https://www.usgs.gov/news/featured-story/10-ways-mount-st-helens-changed-our-world
U. S. Geological Survey (n.d.) Lava Flows Destroy Everything in Their Path https://www.usgs.gov/programs/VHP/lava-flows-destroy-everything-their-path
U. S. Geological Survey (1986). Open File Report 87-97. The 21 August 1986 Lake Nyos Gas Disaster, Cameroon. https://pubs.usgs.gov/of/1987/0097/report.pdf
U. S. Geological Survey (n.d). Volcanoes can affect climate. https://www.usgs.gov/programs/VHP/volcanoes-can-affect-climate

.jpg)