6. Earthquake Hazards
Earthquakes can have direct impacts, such as shaking and ground displacement, but the more dangerous impacts occur because of the shaking and displacement: structural damage to buildings, liquefaction, landslides, fires, and tsunamis. The types and extent of the hazards affecting an area will depend on local conditions where the earthquake strikes such as the geological materials in the area, the type of terrain, and whether the region is near the coast or not. The extent of impact and type of damage will depend on whether the area is urban or rural, densely or sparsely populated, highly developed or underdeveloped. It will also depend on whether the infrastructure has been designed to withstand shaking.
6.1 Ground shaking
Ground shaking describes the vibration of the ground resulting from seismic waves, both body and surface, generated during an earthquake. This vibration is stronger both closer to the epicenter and with higher magnitude earthquakes.
As discussed in section 3 on seismic waves, the waves arrive in a specific order: first P-waves arrive and cause the ground to vibrate, then S-waves arrive causing more pronounced back and forth/up and down motion, finally the surface waves arrive with Love waves causing the ground to undulate strongly from side to side and the Rayleigh waves causing the ground to roll like waves. P-waves and S-waves cause high frequency vibrations, which are efficient at causing low buildings to vibrate, but buildings are far more easily damaged by the horizontal swaying produced by S-waves compared to the vertical vibrations of P-waves. L-waves and R-waves cause low frequency vibrations that are efficient at causing tall buildings to sway. These lower frequency waves also maintain their energy more strongly at distances further from the epicenter, as a result, tall buildings located relatively far (60 miles) from an epicenter can still be damaged by surface waves.
6.2 Surface displacement
Surface displacement refers to the movement of the ground surface on either side of the fault because of an earthquake (Figure 1B.6.1). Not all earthquakes will result in the ground surface visibly shifting. The amount of displacement and the length and width of the displaced ground vary widely. Displacements can range from less than an inch to more than 20 feet and seen along a length of less than a mile to more than 200 miles.

6.3 Building damage and collapse
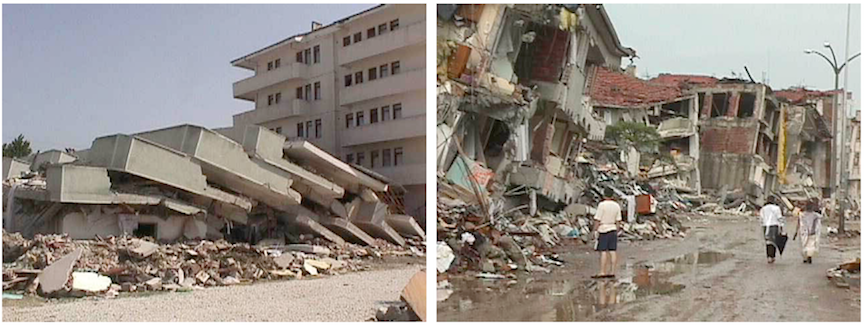
There is a saying in the earthquake community, “Earthquakes don’t kill people; buildings do”. The biggest cause of deaths and damage during an earthquake is not because of the ground itself shaking or being displaced, but because of the effect the shaking and displacement have on buildings. Ground shaking can cause buildings (infrastructure broadly) to sway and crack or even collapse. Displacement can damage the foundations of buildings, tunnels, bridges, canals, etc., leading to anything from minor to very severe damage.
Large, multi-story buildings, particularly ones with large open floor plans on lower levels, tend to be more seriously damaged than smaller, lower buildings as entire stories can collapse or “pancake” on themselves (Figure 1B.6.2). Buildings made from unreinforced masonry or minimal steel reinforcement are also more prone to damage. Many earthquake-prone regions have building codes in place to minimize damage; however, these are only good if they are followed. Older buildings made prior to technological advances that make construction safer need to be retrofitted to meet current building codes. This takes time and money. In addition, making new buildings that meet earthquake building codes also takes more time and money and if unregulated, new buildings may not meet the required standards of safety either. Unfortunately, this results in building inequality across the world, with overall richer countries having buildings more equipped to withstand earthquakes than poorer countries, but also regionally, with wealthier areas and communities having better access to higher quality construction.
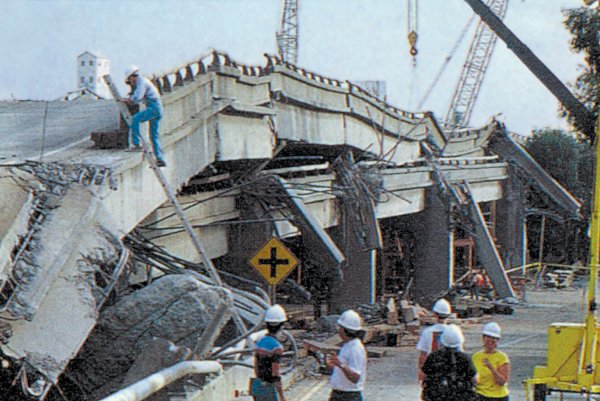
The type of soil or rock in an area also plays a significant role in how much damage there will be. Hard, solid rock will not shake as much as softer sediments, which absorb and amplify seismic waves. This is demonstrated in the video clip below (Source: IRIS. Public Domain. Found here).
It is therefore quite common to see much worse earthquake damage in areas underlain by soft sediments than in areas of solid rock. During the 1989 Loma Prieta earthquake, parts of a two-layer highway in the Oakland area near San Francisco collapsed where they were built on soft sediments (Figure 1B.6.3).
6.4 Liquefaction
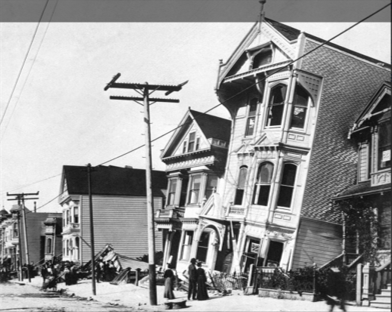
Structures underlain by sediments may be at risk of another hazard, called liquefaction, in which sediment is transformed into a fluid. When water-saturated sediments are shaken, the grains may lose contact with each other, and no longer support one another. Water between the grains holds them apart, causing the sediment to turn to mud and flow. The loss of support for building foundations can lead to the collapse of buildings or other structures that might otherwise have sustained only minor damage. Parts of San Francisco, particularly those near the water, are built on water saturated sediments where liquefaction is a hazard during earthquakes. The video clip below from IRIS (Public Domain, found here) shows an animation of liquefaction that caused the house in Figure 1B.6.4 to partially sink during the 1906 M7.9 San Francisco earthquake.
Experiment with Liquefaction
To see liquefaction for yourself, go to a sandy beach and find a place near the water’s edge where the sand is wet. While standing in one place on a wet part of the beach, start moving your feet up and down at a frequency of about once per second. Within a few seconds the previously firm sand will start to lose strength, and you’ll gradually sink in up to your ankles.
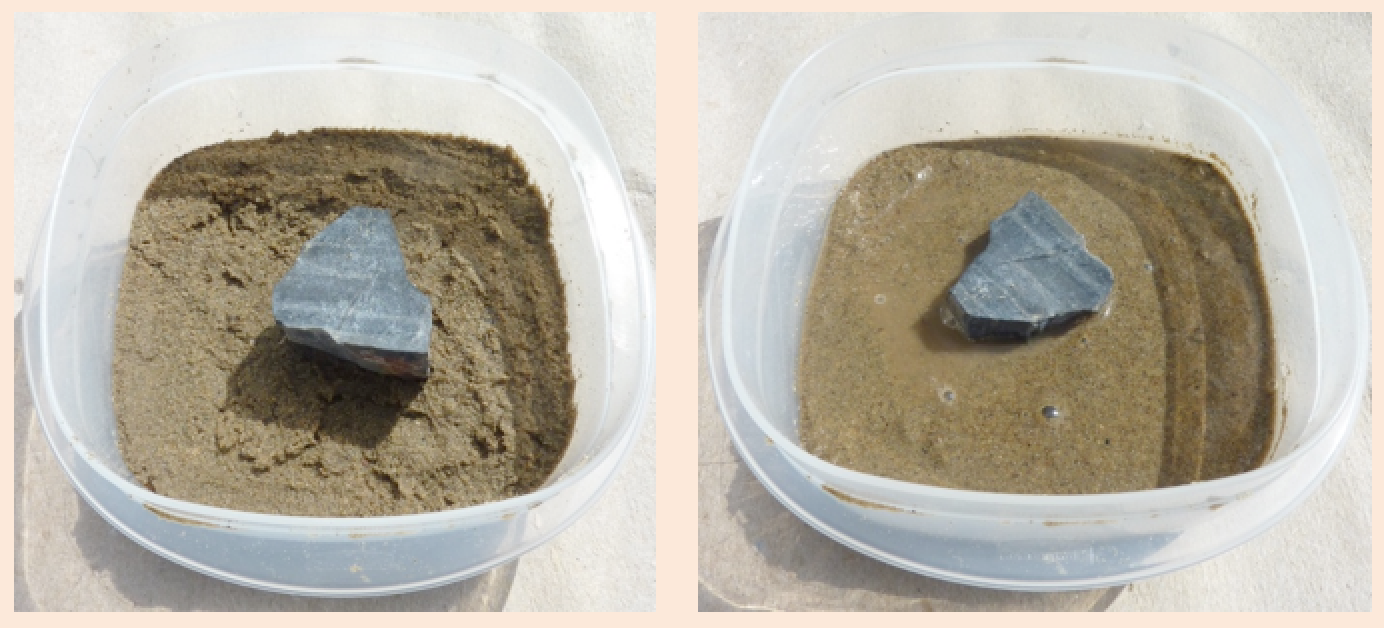
Alternatively, if you cannot get to a beach, put some sand into a small container, saturate it with water, and then pour the excess water off. Shake the container gently to get the water to separate and then pour the excess water away. You may have to do this more than once – you want the sand wet, but not soupy. Place a small rock on the surface of the sand. It should be able to sit there for hours without sinking in (that’s the consistency of sand you should have). Now, holding the container in one hand gently thump the side or the bottom with your other hand, about twice a second. The rock should gradually sink in as the sand around it becomes liquefied.
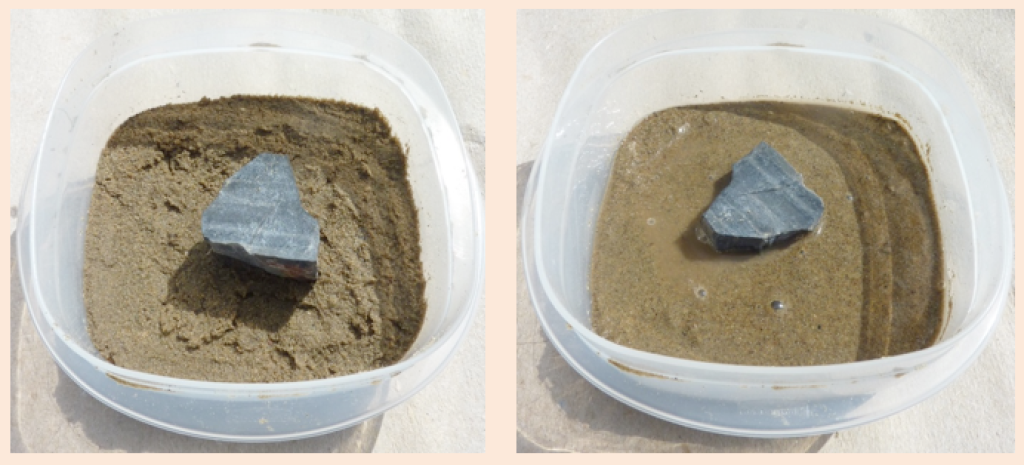
As you were moving your feet up and down or thumping the container, it is likely you soon discovered the most effective rate for getting the sand to liquefy. Stepping up and down as fast as you can (several times per second) on the wet beach would not have been effective, nor would you have achieved much by stepping once every several seconds. The body of sand vibrates most readily in response to shaking that is close to its natural harmonic frequency, and liquefaction is also most likely to occur at that frequency.
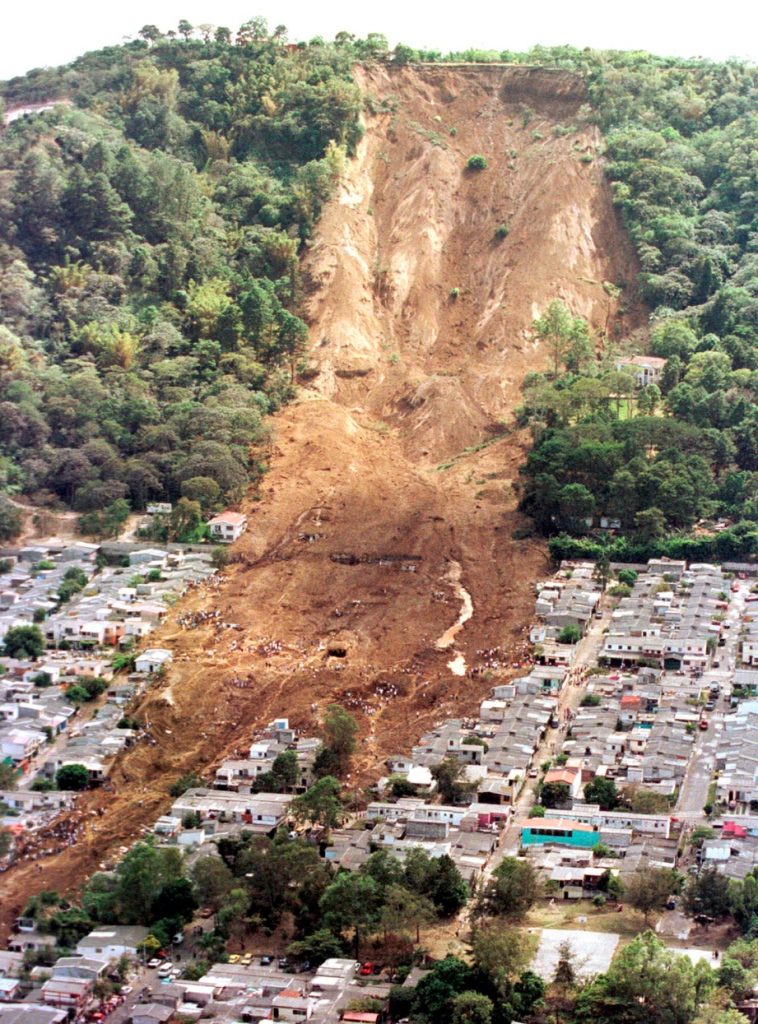
6.5 Landslides
Ground shaking during an earthquake can be enough to weaken rock and loose materials to the point of landslides. The most abundant type of earthquake induced landslides are rock falls (shaking rocks loose off of cliffs) or slides on steep slopes. Slides on moderate to shallow slopes also occur but are less abundant. In January of 2011, a M7.6 earthquake offshore of El Salvador triggered slope failures that killed nearly 600 people (Figure 1B.6.5).
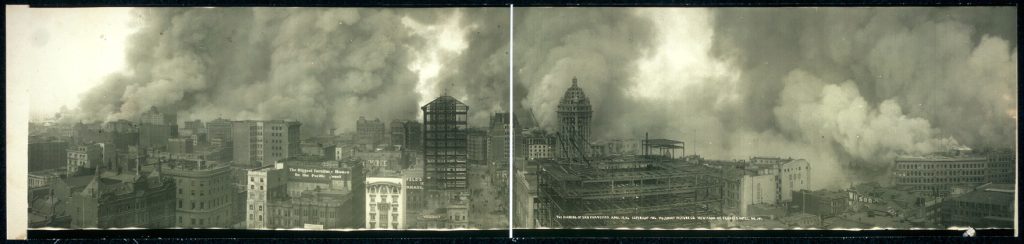
6.6 Fires
Fires are commonly associated with earthquakes because gas lines rupture and electrical lines are damaged when the ground shakes. Most of the damage in the great 1906 San Francisco earthquake was caused by massive fires in the downtown area of the city (Figure 1B.6.6). Some 25,000 buildings were destroyed by those fires, which were fueled by gas leaking from broken pipes. Fighting the fires was difficult because water mains had also ruptured. Today the risk of fires can be reduced through P-wave early warning systems if utility operators can decrease pipeline pressure and break electrical circuits.
6.7 Tsunamis
Large earthquakes that take place beneath the ocean have the potential to displace large volumes of water. In a subduction zone, for example, the overriding plate becomes distorted by elastic deformation. It is squeezed laterally and bent upwards. When an earthquake happens, the plate rebounds over an area of thousands of square kilometers. This rapid displacement of the ocean floor moves enormous amounts of water and generates waves – this is the tsunami. This process is depicted in the animation below from IRIS (Public Domain. Found here). These waves spread across the ocean and in the deep ocean can travel as fast as airplanes at velocities over 700 kilometers per hour (500 mph).
Tsunami waves gain their height as they travel through shallower waters. In the deep ocean, tsunami waves are spread out and have a height of only about 1 meter (3 feet) and with such a gentle rise up and down from the crest that they may go undetected by ships. As they approach shore, they are slowed down by friction with the ocean floor (slow to velocities of 50 km per hour/30 mph), which allows the waves to build in height. Tsunamis are not a single wave, but rather a series of waves that can wash onshore over a period of several hours.
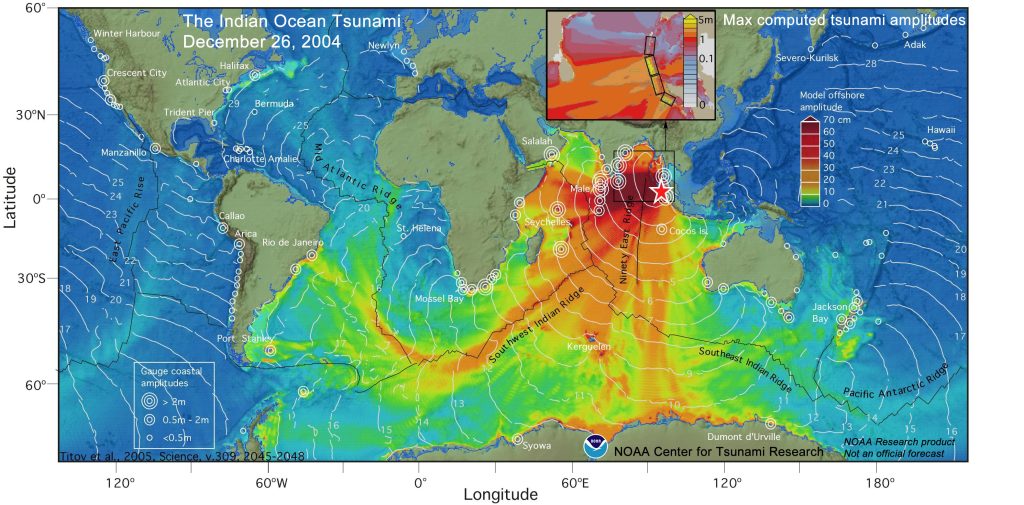
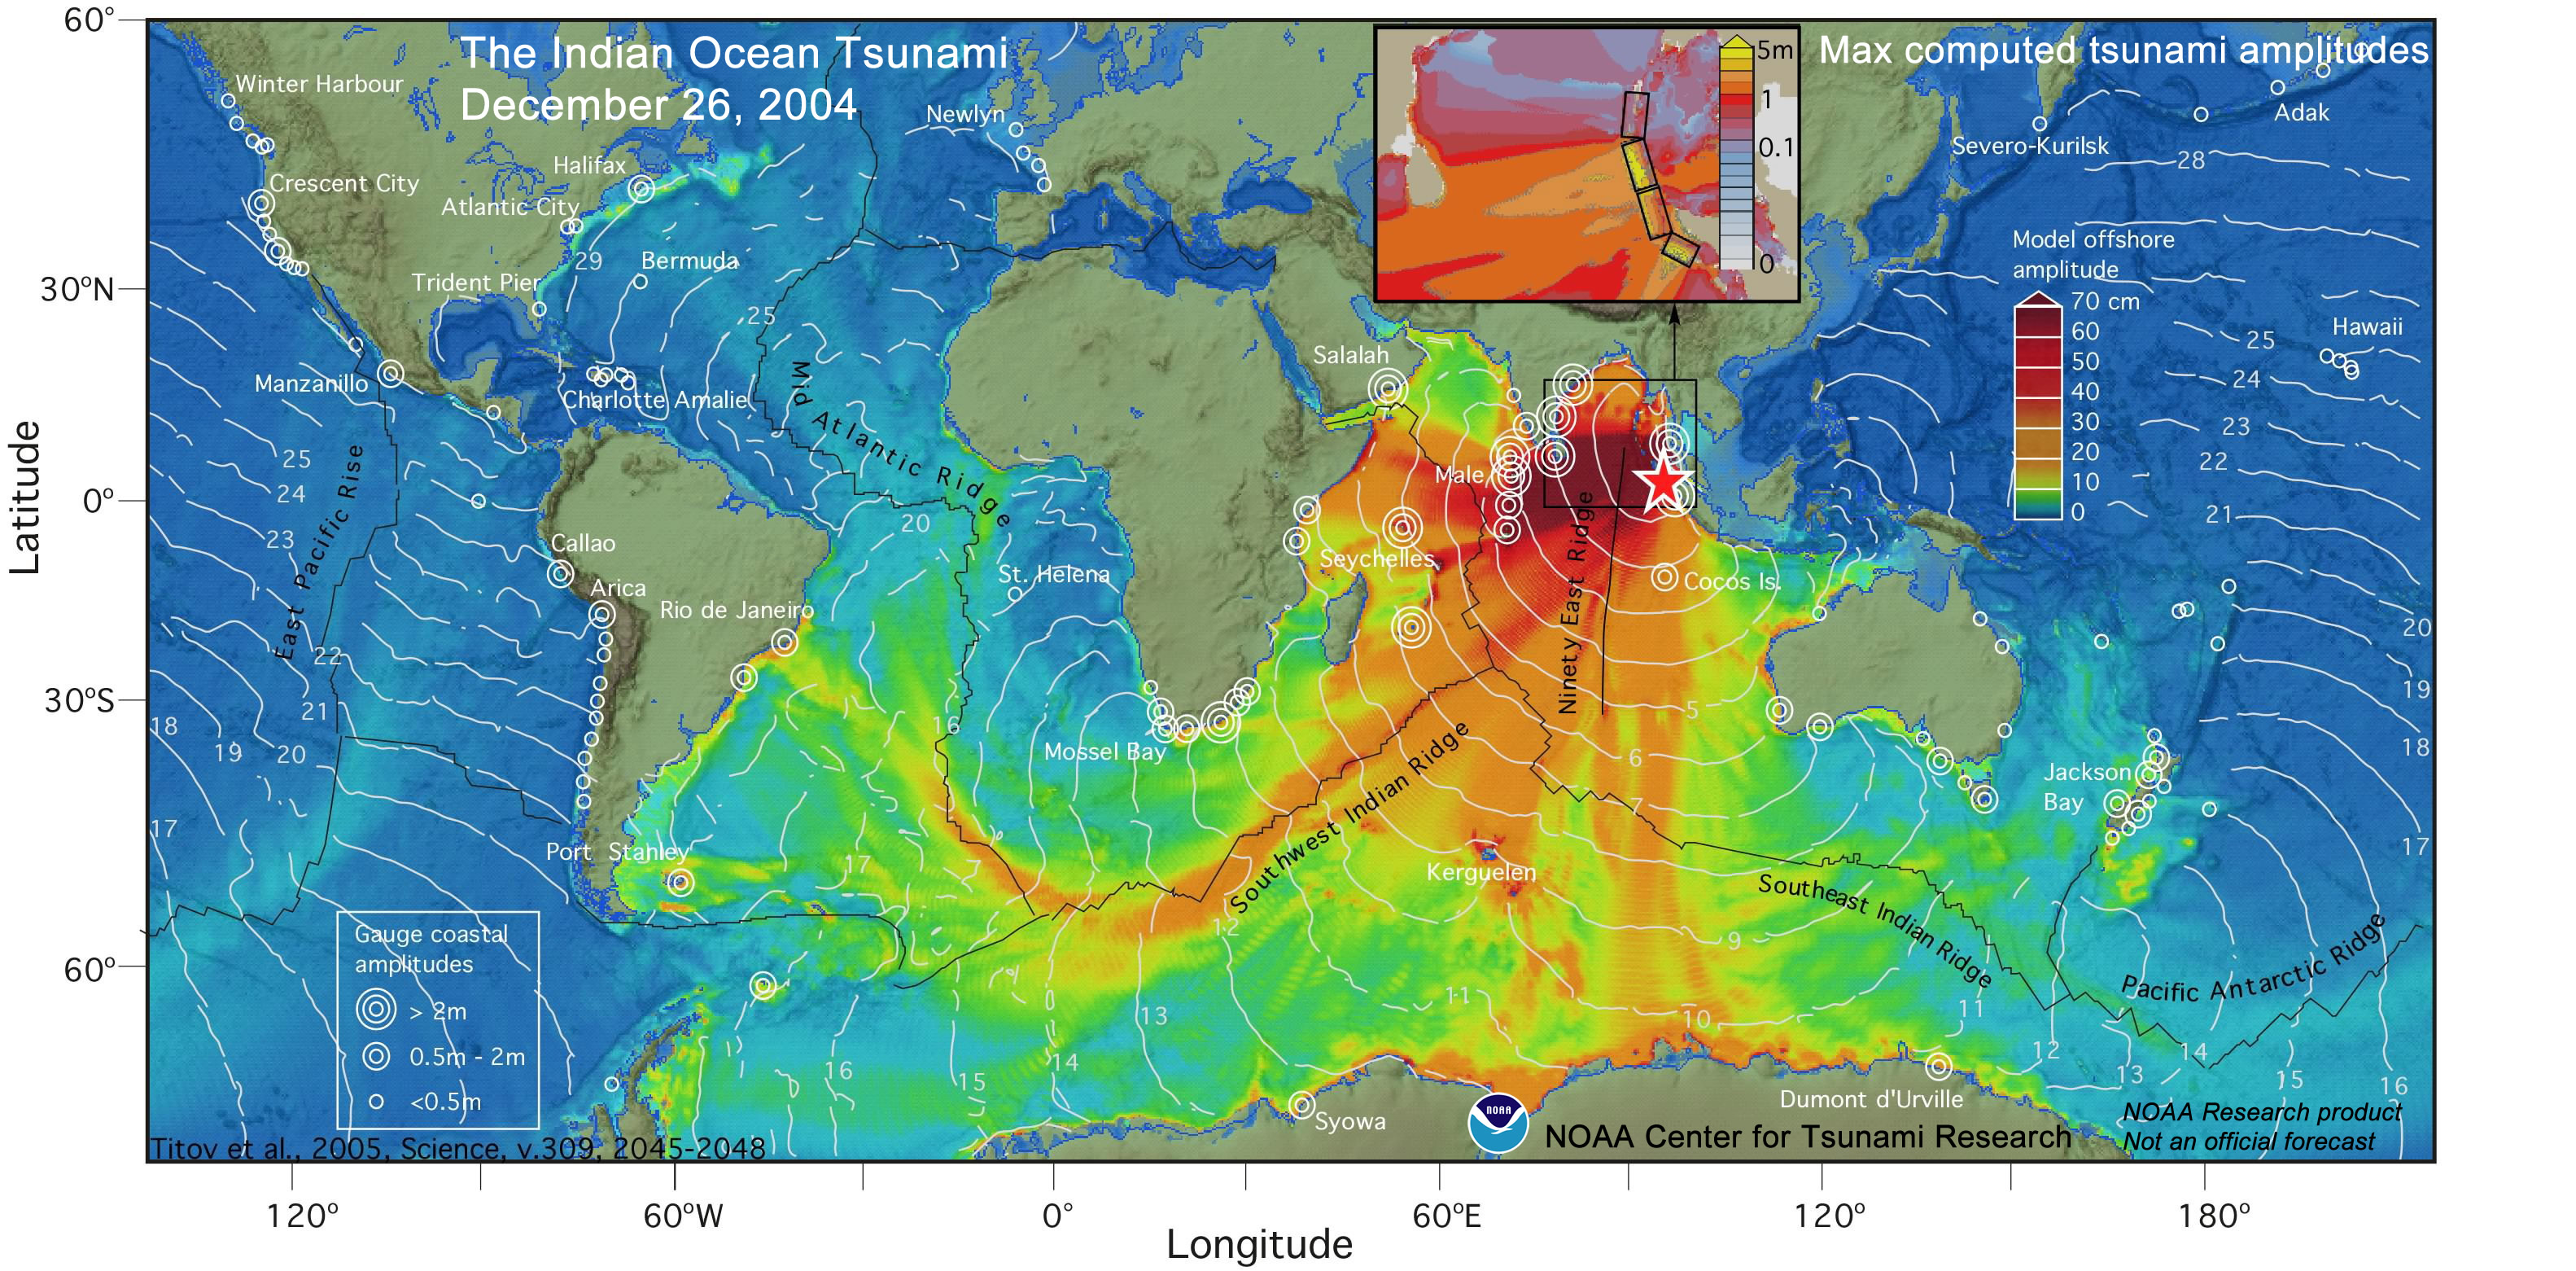
The tsunami following the 2004 Sumatra-Andaman earthquake (colloquially known as the Boxing Day Tsunami because it happened on Dec. 26, i.e., Boxing Day), was a result of an earthquake generated at the convergent boundary where the Indian Plate is subducting down to the east under the Burma Plate, which is part of the Eurasian Plate (Figure 1B.6.7). It had a magnitude of 9.1 and ruptured a length of fault over 1300 km (810 miles in length) with displacement of up to 15 meters (50 ft) in places. This earthquake ranks within the top three of the most powerful earthquakes ever recorded.
The rapid vertical displacement of the ocean floor displaced a huge amount of water, which spread out across the ocean and affected coastlines globally. In areas nearest the epicenter, wave heights were largest, reaching over 50 meters (167 feet) and flooding areas for miles inland as those waves came ashore. Farther from the epicenter wave heights diminished as energy was slowly lost. Even as far away as North America, the tsunami was measurable, albeit small (<0.5 meters/1.5 ft), when it came onshore anywhere from 30 to over 40 hours later depending on location (Figure 1B.6.8).
Subduction earthquakes must be large to generate significant tsunamis. Earthquakes with magnitude less than 7 do not typically generate significant tsunamis because the amount of vertical displacement of the sea floor is minimal. Seafloor transform earthquakes, even large ones (M7 to M8), do not typically generate tsunamis either because the motion is mostly side to side, not vertical.
While tsunamis are most commonly generated by underwater earthquakes, they can be generated by any phenomena that displaces substantial amounts of ocean water very quickly. This includes large underwater volcanic eruptions and large pieces of glacier that break off (calve) and fall into the ocean.
Check your understanding: Tsunamis
References
Nalbant, S. S.; Steacy, S.; Sieh, K.; Natawidjaja, D.; McCloskey, J. (2005). Seismology: Earthquake risk on the Sunda Trench. Nature 435 (7043): 756–757. https://doi.org/10.1038/nature435756a
National Oceanographic and Atmospheric Administration (2023). Jetstream Max: 2004 Indian Ocean Tsunami. https://www.noaa.gov/jetstream/2004tsu_max
