3. Divergent Boundaries
Divergent boundaries are where plates are moving away from each other, or spreading apart. The stress type at these locations is extension (stress is a force acting over an area) – the “pulling apart” stress. The terms spreading centers and rift zones refer to divergent boundaries.
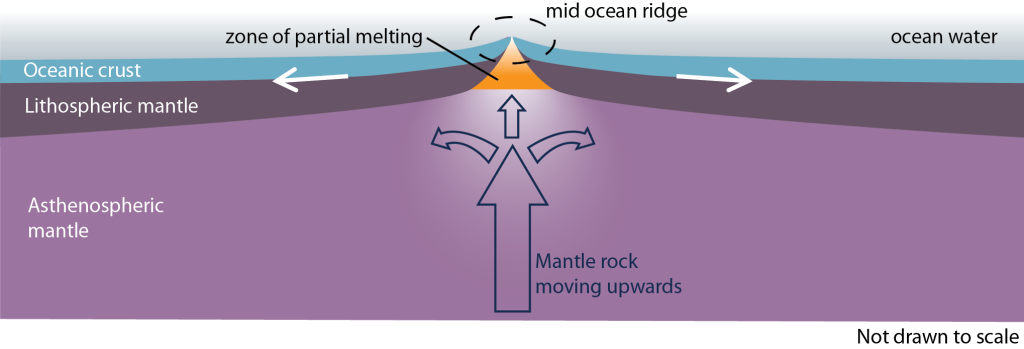
At these boundaries new crust is created from magma derived from partial melting of the mantle (Figure 1A.3.1). As the lithosphere is stretched and thinned, the asthenosphere gets closer to the surface where pressure is lower. This lowered pressure allows the asthenosphere to partially melt creating magma (molten rock) that is mafic in composition. This magma rises and essentially “fills in” where the lithosphere was stretched apart and then solidifies as it cools to make new crust. This happens through large eruptions of basaltic (mafic) lava.
3.1 Topographic Features
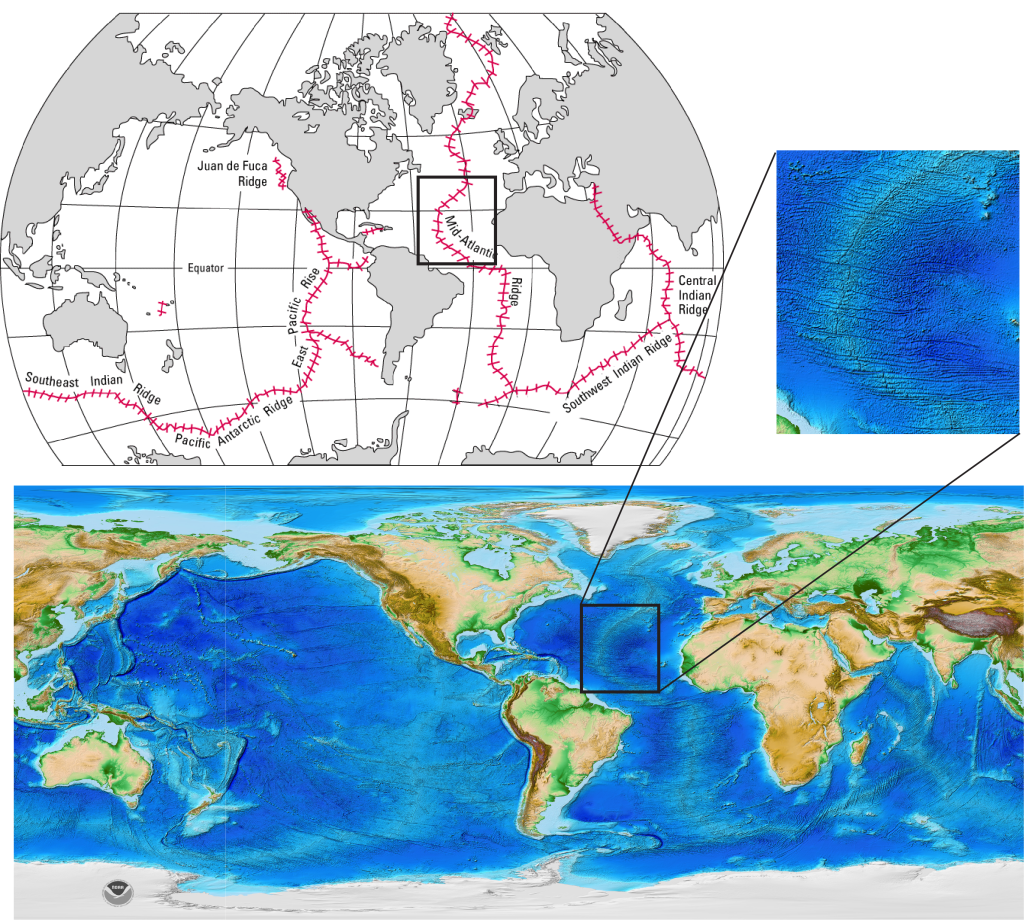
Along the spreading center, the newly formed oceanic crust is still quite hot and therefore more buoyant than older oceanic crust located farther away from the divergent boundary. Because of this, these areas of the ocean floor are topographically higher (although still below sea level) and create long, high ridges of shallower ocean called mid-ocean ridges (MORs). The mid ocean ridges are connected across the planet and this mid ocean ridge system creates the longest continuous mountain belt on the planet (Figure 1A.3.2). On either side of the mid ocean ridges, the seafloor gets progressively deeper as the oceanic crust cools off and becomes denser and less buoyant.
Partial melting explained
Partial melting happens because the minerals in rocks have different melting temperatures. So as temperature starts to rise (or a pressure release occurs, which also affects melting temperatures), minerals will start to melt, but not all minerals melt at once.
Think of it like chocolate chip ice cream. When you leave the tub of ice cream out on the counter (raise the temperature) the ice cream and the chocolate chips do not both melt, just the ice cream does. You would have to heat the chocolate chips up higher than room temperature to get them to melt. The slurry of melted ice cream with solid chocolate chips demonstrates partial melting.
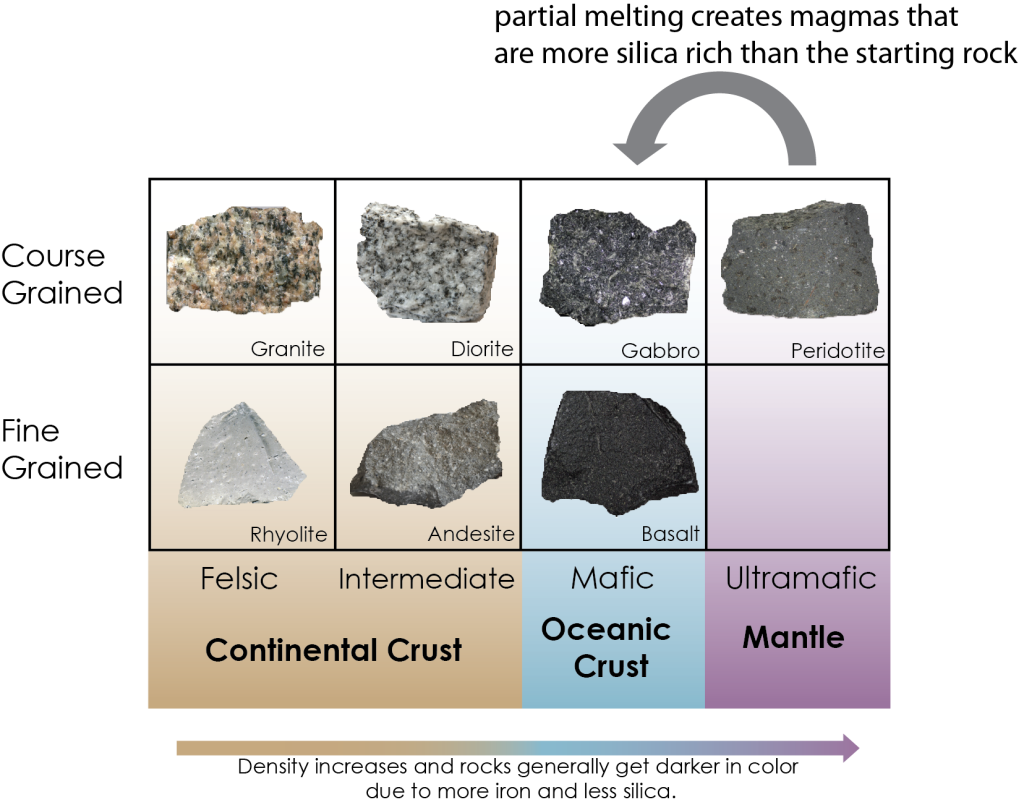
Essentially, partial melting of ultramafic rocks (mantle composition of peridotite/chocolate chip ice cream) leads to a magma that has more slightly higher silica content and is mafic in composition (ocean crust composition of basalt and gabbro/just the ice cream)*. This is how melting of mantle rocks can create a different composition that is solidified into crustal rocks!
When this process occurs where continental crust is rifting, the mafic magma rises through continental crust compositions (felsic and intermediate) melting and incorporating some of that material to become less mafic/more intermediate and felsic.
*This same principle applies regardless of the starting composition of the rock. So partial melting of mafic rocks creates a magma that is more silica rich than the mafic rocks, i.e., an intermediate magma composition. Partial melting of intermediate rocks creates a felsic magma composition.
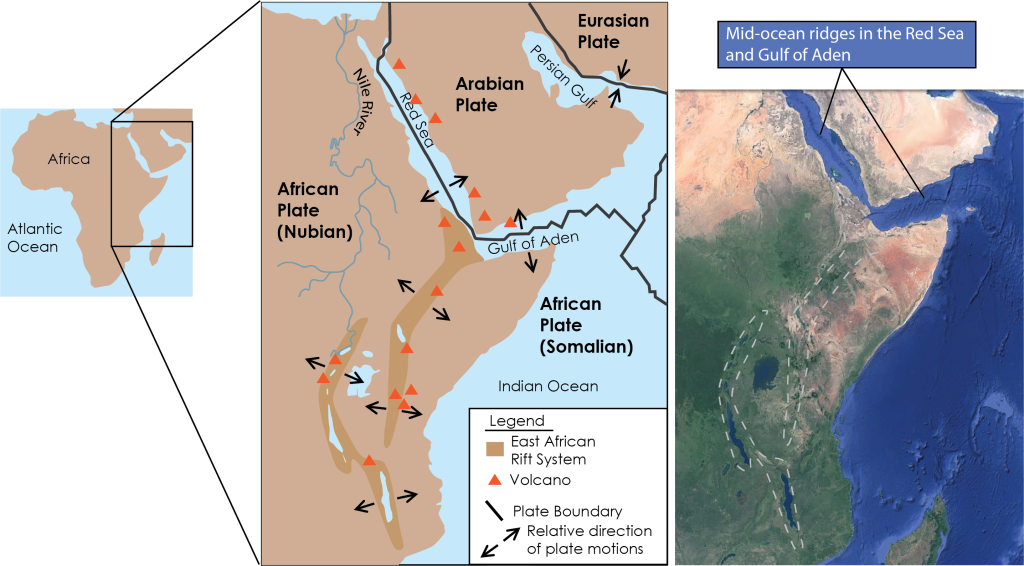
Divergent boundaries can exist on land or in the oceans. The vast majority of them are in the oceans – and for good reason! As continental landmasses pull apart, eventually they are located far enough from each other that the new crust created between them (which remember is thin oceanic crust) creates a long, low basin that fills with ocean water and a new ocean is created. The Atlantic Ocean is an old example of this. North and South America have been pulling apart from Europe and Africa for approximately 200 million years as the Atlantic Ocean has slowly gotten wider. But if we could move backward through time, we would see the Atlantic Ocean get progressively narrower until these landmasses were all together again with no ocean between them. The Red Sea dividing Africa from the Arabian Peninsula is the youngest example of this on the planet, which is why the Red Sea is so much narrower than the Atlantic Ocean.
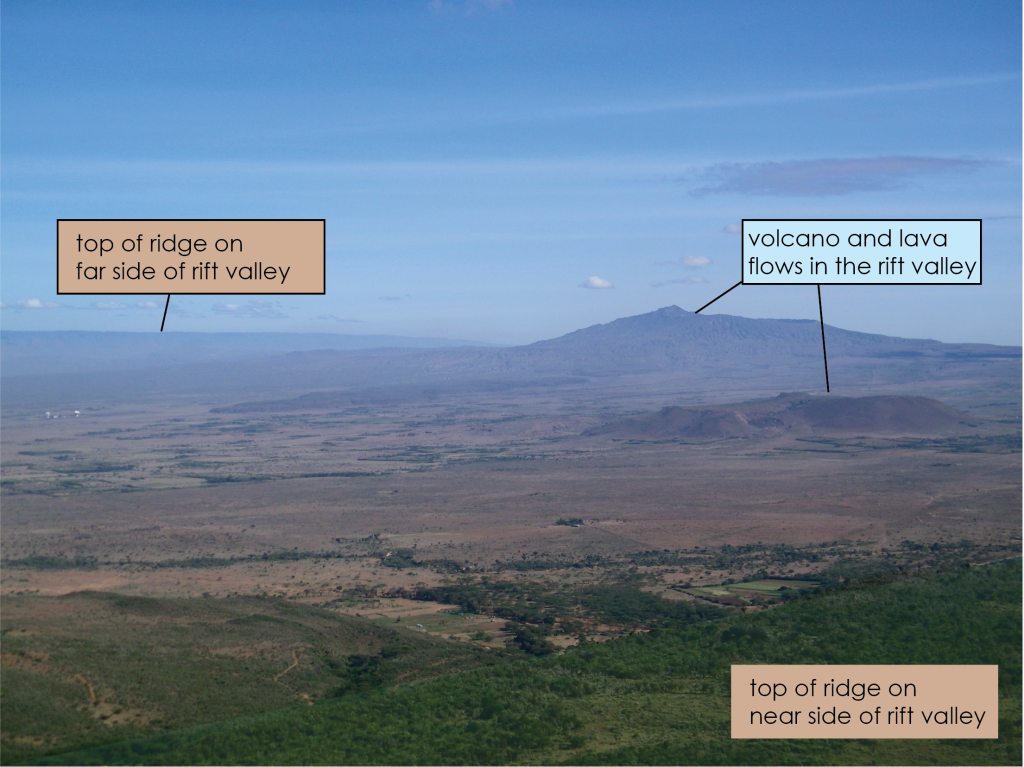
While most divergent boundaries on the planet exist in the oceans, there are a couple of locations where continents are rifting apart through the same process. The two main locations on the planet where there are well defined divergent boundaries on land are in the East African Rift System (Figure 1A.3.3 and 1A.3.4) and in Iceland (Figure 1A.3.5). Instead of mid-ocean ridges, divergent boundaries on land have topographic features called rift valleys. This is seen as a deep valley with high ridges on either side.
3.2 Volcanic activity
Iceland is the other location on the planet where a divergent boundary is located on land. However, the details of the divergent boundary in Iceland are different as Iceland is not part of a large piece of continental crust being pulled apart like in east Africa. Iceland lies directly over part of the North Atlantic Ridge. At this location, a mantle plume coincides with the divergent boundary (see explanation box on mantle plumes below). The increased volcanic activity and heat associated with the mantle plume create a volcanic island (i.e., land is above sea level) in contrast to the volcanic activity below sea level typically found at mid ocean ridges. This makes Iceland an excellent location to study divergent boundary activity, but in a much more accessible place than the ocean floor!
Figure 1A.3.5 below, shows a simplified map of Iceland with the divergent boundary/rift zones marked (left) and a photograph of the rift zone (right). The rift zones on the map mark where the North American Plate on the west is splitting apart from the Eurasian Plate on the east. The diverging plates have split to create large rift valleys as seen in the photo, and these valleys are filled with young volcanic rocks.
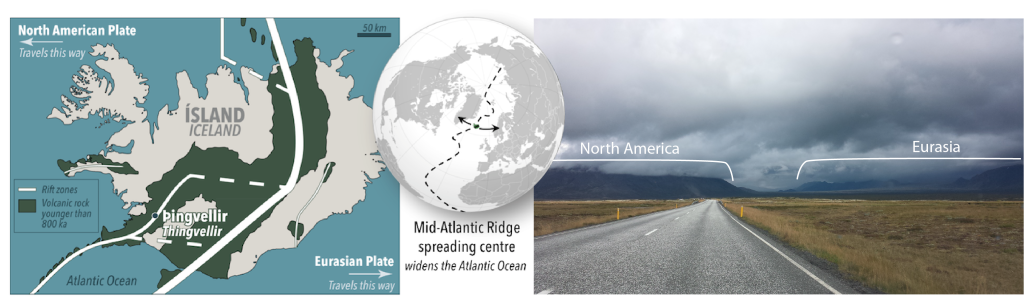
Volcanic activity is present all along divergent boundaries. This is exemplified on the map in Figure 1A.3.5 by the young volcanic rocks noted as the wide green band surrounding the white rift zones and filling the rift valleys. The abundance of volcanic activity at divergent boundaries makes sense if you think about it. Remember, plates are pulling apart at these locations and they cannot just leave a gaping hole that goes all the way down into the asthenosphere – something has to fill that space, and that something is upwelling magma from the mantle (refer back to Figure 1A.3.1). When that magma reaches the surface to cool, it does so in the form of volcanic activity all along the mid ocean ridge.
Seeing underwater volcanic eruptions in action is much harder than seeing them on land – you would have to be in the right place at the right time and have all the equipment to get to the ocean floor. While we can take samples of ocean floor rocks and determine when and where volcanic eruptions have happened in the past, an easier (and still accurate) way to find the volcanic activity on the seafloor is to look at the hydrothermal activity as this is a bit more constant than active volcanic eruptions. Based on the rock types at MORs and the eruptions we have been lucky enough to see, we know volcanic eruptions happen at MORs, but obviously they are not as plainly visible as eruptions on land!
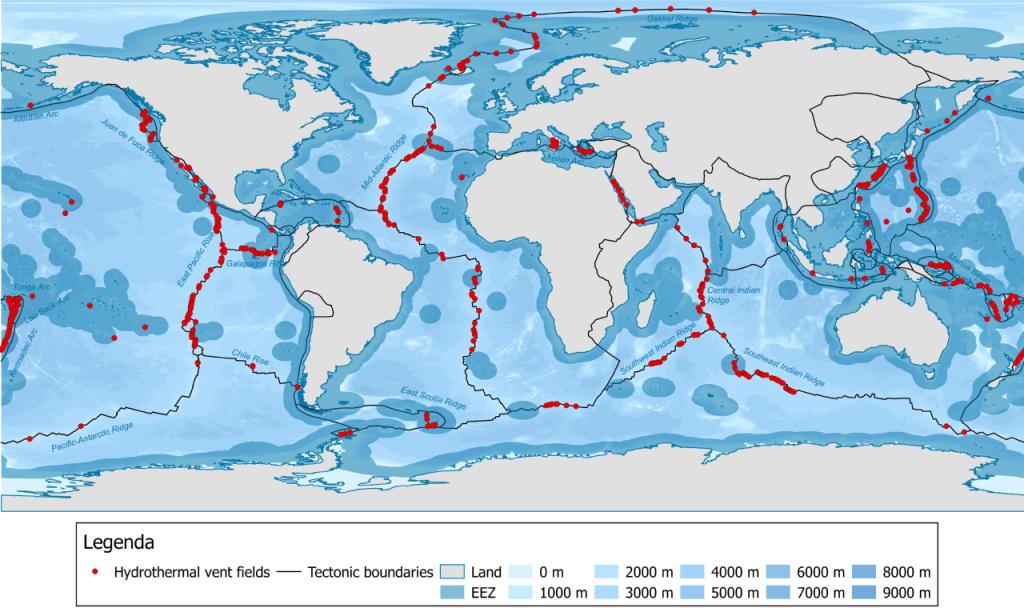
The map below shows active hydrothermal vent fields (Figure 1A.3.6). This hydrothermal activity, which is a result of volcanic activity, follows closely to the plate boundaries with a lot of activity present along the MORs – although not exclusively as convergent boundaries and hotspots also have hydrothermal activity. One thing to note, which will be revisited when discussing convergent boundaries, is that the hydrothermal (and volcanic) activity along divergent boundaries is directly on the boundary, whereas the hydrothermal (and volcanic) activity along convergent boundaries is located off to one side of the boundary.
Mantle Plumes Explained
A mantle plume, or hot spot, is a location where hot magma, generated deep within the mantle, rises through the lithosphere. Mantle plumes are stationary and semi-permanent and
create chains of volcanoes, known as hot spot volcanoes.
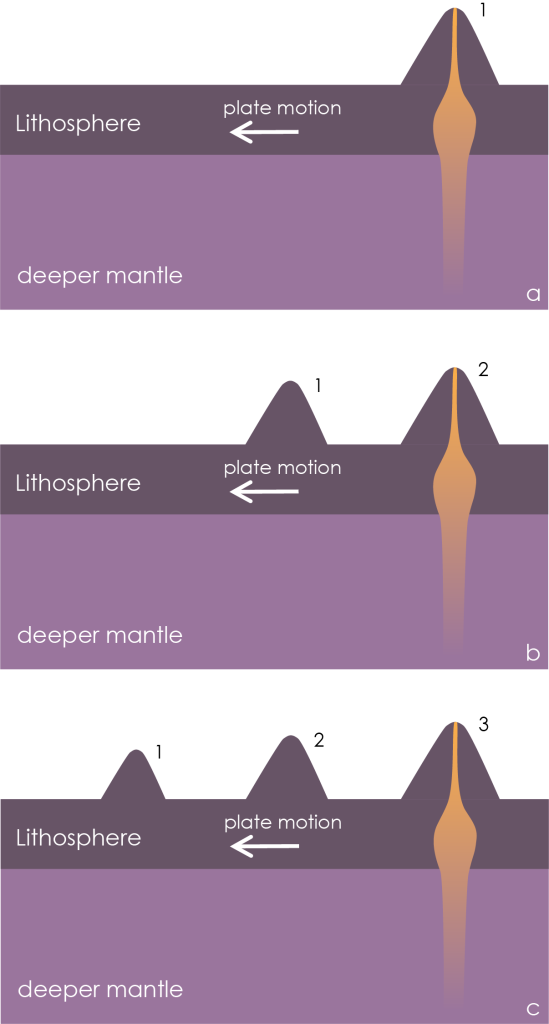
This occurs as the stationary plume “feeds” a volcano on the surface, and eventually that volcano is carried off the plume by the motion of the tectonic plate. At this point, the plume starts to create a new volcano.
Figure 1A.3.7 on the right shows this through three steps of time from diagram a through diagram c, where volcano 1 is the first one formed, volcano 2 forms second, and volcano 3 forms last.
Mantle plumes can coincide with plate boundaries, as is the case in Iceland, but they do not need to. This is how intraplate (i.e., not associated with a plate boundary) volcanoes are formed. Well known examples of intraplate volcanoes and hot spot chains of volcanoes are the Hawaiian Islands (in the middle of the Pacific Plate) and the Yellowstone hot spot track (in the middle of the North American Plate). This volcanic activity is discussed in more detail in chapter 1C.4.
3.3 Earthquake Activity
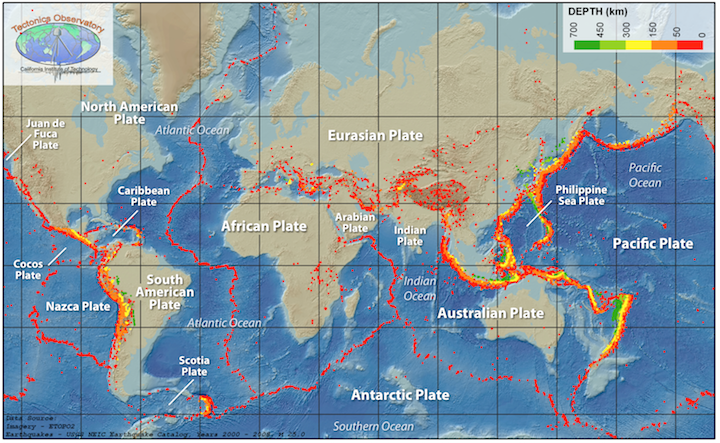
Bands of earthquakes trace out plate boundaries. In fact, every plate boundary on the planet can be delineated on a map just using the location of earthquakes, although earthquakes alone cannot be used to determine the exact type of plate boundary at that location. The depths of earthquakes and the width of the band are specific to the type of plate boundary.
Divergent boundaries have shallow earthquakes (anything less than about 70km depth is considered a shallow earthquake), in narrow bands on plate boundaries. Continental rifts, like in eastern Africa, have wider swaths of scattered earthquakes that are still shallow. Divergent boundaries have shallow earthquakes because for an earthquake to occur, brittle rock needs to break. This means earthquakes happen in the brittle layer of the lithosphere, not the weak, slow flowing asthenosphere. Oceanic lithosphere is quite thin, 70km thick on average, which means the earthquakes here cannot be anything but shallow! The details of how earthquakes happen are presented in chapter 1B.
The map below shows the distribution of earthquakes around the planet (Figure 1A.3.8). The earthquakes are color-coded by depth, NOT magnitude. The strength of an earthquake is not dependent on its depth. Note that along mid ocean ridges, like in the middle of the Atlantic Ocean, the earthquakes are all red dots (less than 50km deep – see legend in the top right corner of the map) and sit in a tight line that matches up exactly with the mid ocean ridge topographic feature, which delineates the divergent boundary. A wider swath of shallow earthquakes (red dots) can be seen in the East African Rift System.
3.4 Seafloor Age
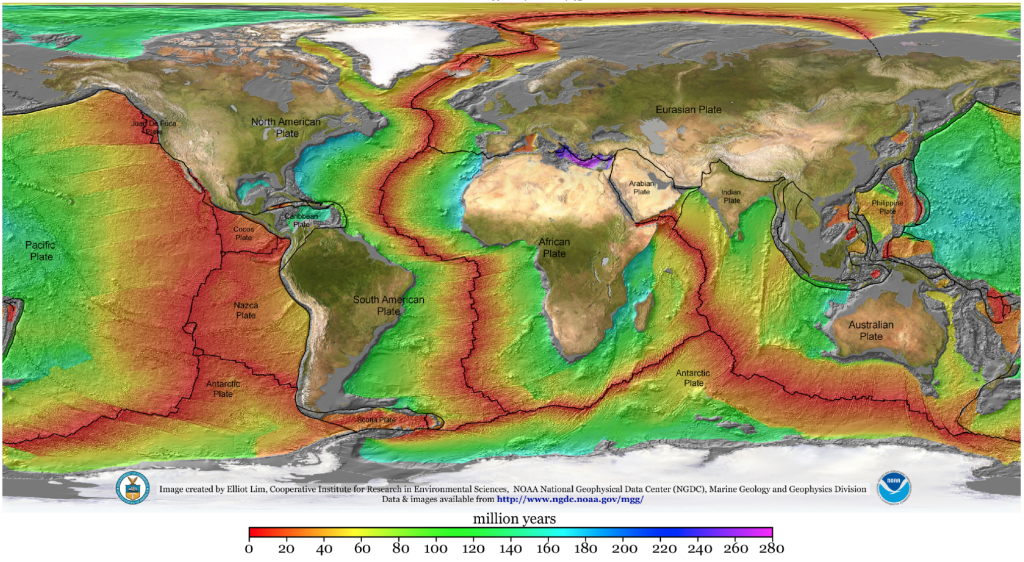
A defining principle of divergent boundaries is that they are locations where new crust is being created. Remember that as the plates pull apart, magma upwelling from the mantle solidifies to build new plate material. This means that divergent boundaries in the oceans are where the youngest ocean floor rocks are located. On the map below, the youngest ocean floor is shown in deep red (Figure 1A.3.9). This deep red band marks out the divergent boundaries. The ocean floor rocks become symmetrically older to either side of the divergent boundary.
This pattern of seafloor age is a useful way to locate divergent boundaries in the ocean.
Check Your Understanding: Seafloor age at divergent boundaries
The image below is an enlarged view of the Mid Atlantic Ridge, a divergent boundary. Three zones are indicated in black boxes on this diagram. Match the label for seafloor age (youngest, middle, oldest) with the correct box to indicate relative seafloor age at each of the three locations.
