4. Colorado River and Irrigation
4.1 Where is Irrigation Used?
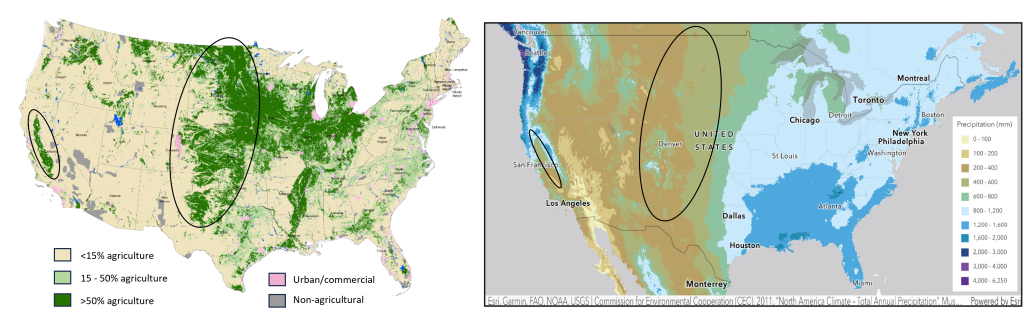
The central U.S., parts of California and Washington, and the corridor along the Mississippi River are highly agricultural regions, where more than 50% of the land is dedicated to agriculture (Figure 2B.4.1 left). Many of the agricultural areas west of the Mississippi River receive less precipitation than is required to dryland farm most crops (Figure 2B.4.1, right). The crops grown in these regions (circled areas) require anywhere from 400 mm to 800 mm of water, up to 1200 mm of water if growing alfalfa, over the growing season. The central U.S. receives 200 mm to 600 mm of precipitation (although not necessarily in the growing season), but the major agricultural areas in California can receive less than 100 mm per year in the driest areas.
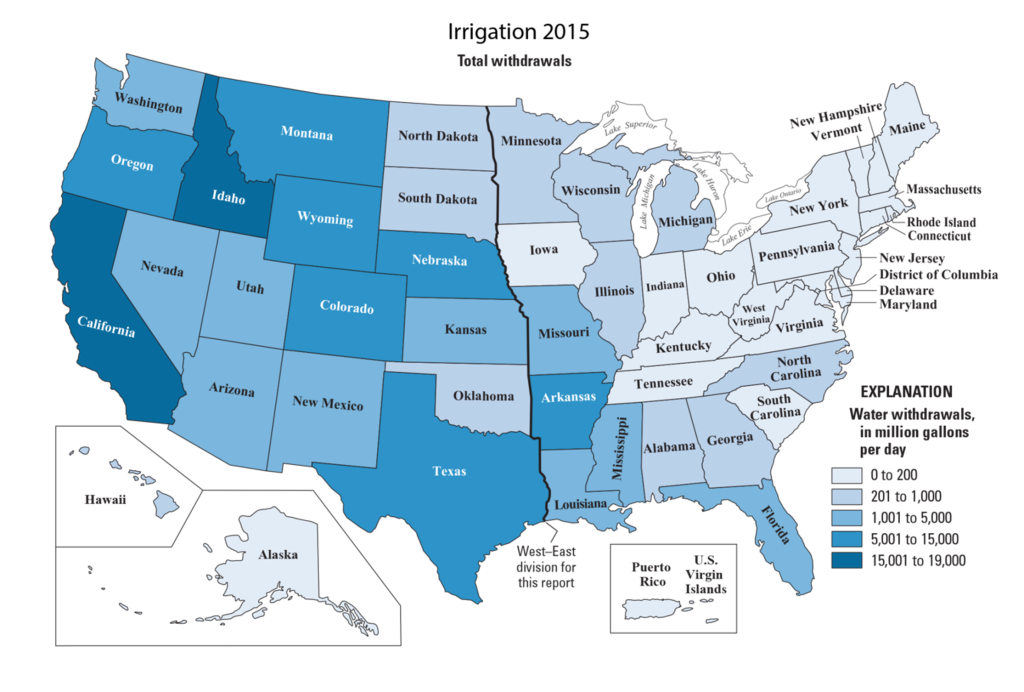
It seems logical that states with more agricultural land would use more irrigation water, however, this is not necessarily the case as precipitation is not spread evenly across the country. California and Idaho are the two largest irrigation water users (Figure 2B.4.2), despite having the 16th and 24th largest acreage of farmland in the country. Iowa on the other hand, has the 10th largest acreage of farmland yet is one of the smallest users of irrigation water.
4.2 Controls on Precipitation in the U.S.
The western U.S. (west of the line that extends south from the western border of Minnesota with the Dakotas, as indicated on Figure 2B.4.2) gets very little precipitation, while the eastern U.S. is wet. These changes in precipitation can be seen on the right-hand side map in Figure 2B.4.1. This change across the country is due to the orographic effect.
The orographic effect occurs when air masses are forced to rise over tall mountains where they cool at high altitudes and the moisture in them condenses into rain or snow. This precipitation is concentrated on the windward sides of the mountains, and as the air mass continues over to the backside (leeward side) of the mountains, it is both dry and warms up as it descends. This creates a rain shadow on the leeward side of the mountains as these areas receive minimal precipitation and the dry, warm air increases evaporation rates (Figure 2B.4.3).
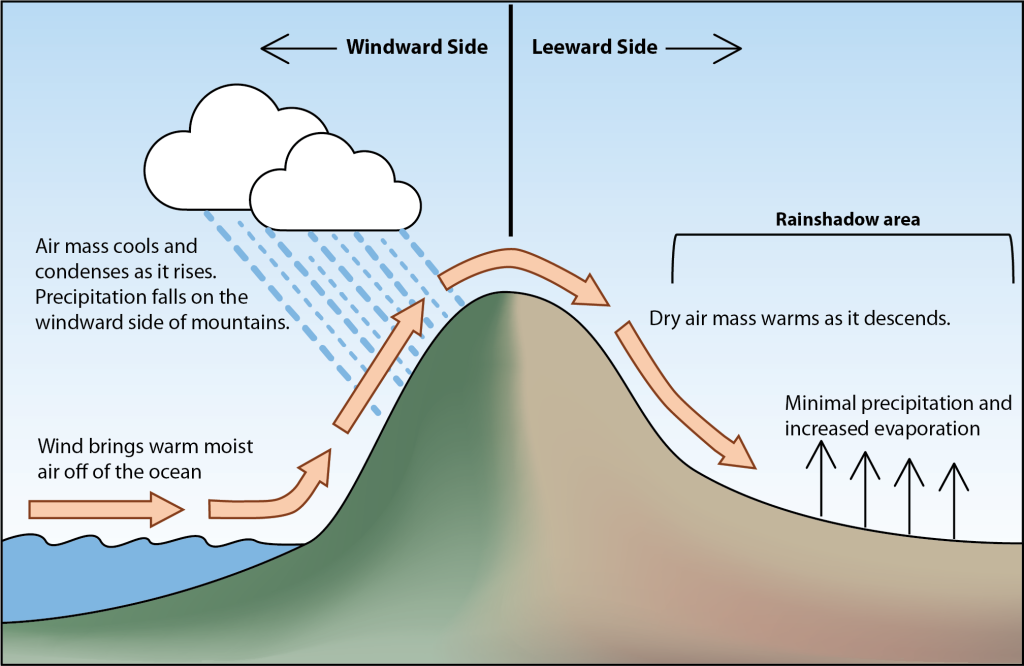
The wind direction across the planet at the latitude of the U.S. is from west to east (these are called the Trade Winds). These winds pick up moisture from the Pacific Ocean and carry it onto the west coast of North America where the winds rise the tall west coast mountains. As the air mass rises, it cools and condenses, dropping precipitation on the windward side (i.e., the Pacific Ocean side) resulting in the narrow band of high precipitation along the west coast (Figure 2B.4.1, right). As this air mass continues east over the mountains it descends and warms. This warm, dry air mass leads to minimal rainfall and increased evaporation on the leeward side. Given the location of the mountain belt along the entire western edge of North America, this creates an extensive rain shadow inland across the continent.
This air mass continues to be dry as it blows east across the U.S. until it encounters warm moist air circulating inland from the Gulf of Mexico. This addition of warm, moist air from the gulf in the central part of the U.S. and warm, moist air from the Atlantic Ocean in the eastern U.S. creates increased precipitation across the eastern half of the country.
Check your understanding: Orographic effect
In addition to the orographic effect, climate change has exacerbated the dry conditions in the west by causing increased temperatures across the globe and altering aspects that control precipitation such as ocean temperatures and changes in the jet stream. In addition, landscape and land use changes because of human activity can contribute to reduced precipitation as this alters flow through the hydrologic cycle.
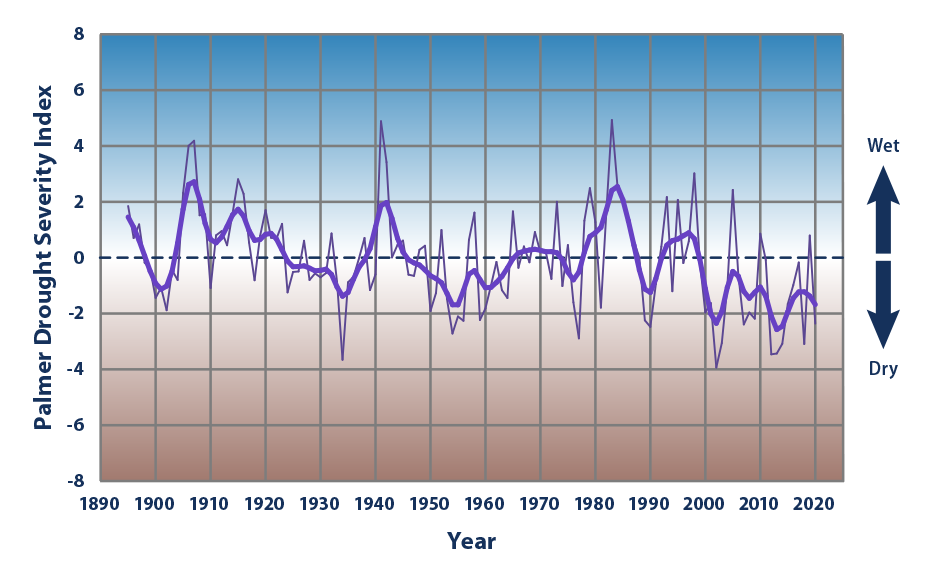
The western U.S., particularly the southwest states that are part of the Colorado River basin (Arizona, California, Colorado, Nevada, New Mexico, and Utah), has been in drought conditions since 2000. Drought is a prolonged period of abnormally low rainfall leading to a shortage of water. Continuing dry conditions pushed the drought in the western U.S. into megadrought status (drought lasting several decades). In 2022 this megadrought broke the record set in the 1500s to become the worst megadrought since at least 800 CE, which is as far back as the drought record has been determined using tree ring data. While these drought conditions would have been present even without human induced climate change, the conditions would have been 40% less severe than what is currently happening.
Over the past two decades there have been intense rainfall events in the area, such as the late December 2022 “atmospheric river” that causes major flooding along the Pacific coast, and years where precipitation was relatively high such as in 2005, 2010, 2017, and 2019 (Figure 2B.4.4, thin line). However, these have not been enough to increase long term soil moisture to normal conditions (Figure 2B.4.4, thick line)
4.3 Colorado River Water
As a result of low precipitation and worsening drought conditions across the region, the western U.S. is far more reliant on irrigation water than the eastern U.S., and in the southwest, a major source of irrigation water is the Colorado River. The Colorado River is one of the longest rivers in the western United States. It begins in the Rocky Mountains of Colorado and flows southwest into Utah and then Arizona, where it forms the border between Arizona and Nevada and between Arizona and California before flowing into Mexico and out into the Gulf of California (Figure 2B.4.5). The Colorado River Basin (CRB) in the U.S. is divided into the Upper Basin (in Wyoming, Colorado, Utah, New Mexico) and the Lower Basin (Nevada, Arizona, California). The division between these two basins occurs close to the Arizona-Utah border, where the waters collect in Lake Powell upstream of the Glen Canyon Dam.
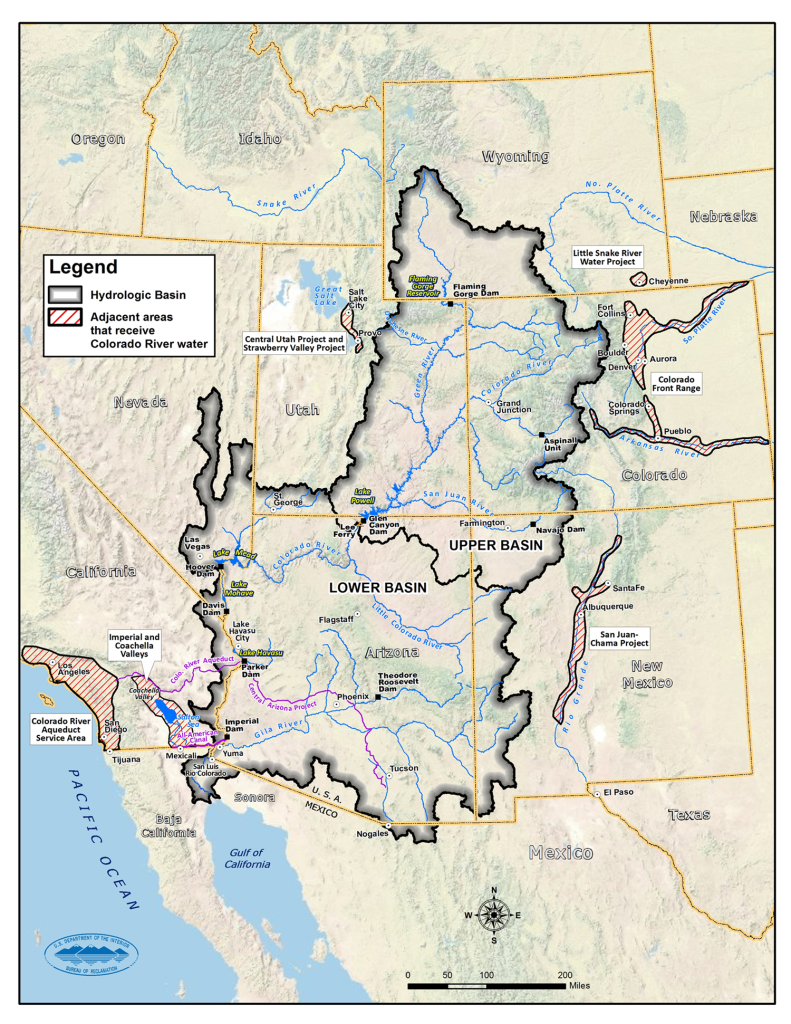
The CRB supplies close to 40 million people with water (including major cities like Los Angeles and Denver that are not within the basin) and irrigates 5.5 million acres of farmland. In addition, it is home to at least 30 federally recognized tribes, 7 National Wildlife Refuges, 4 National Recreation Areas, and 11 National Parks. It is important economically, culturally, and environmentally.
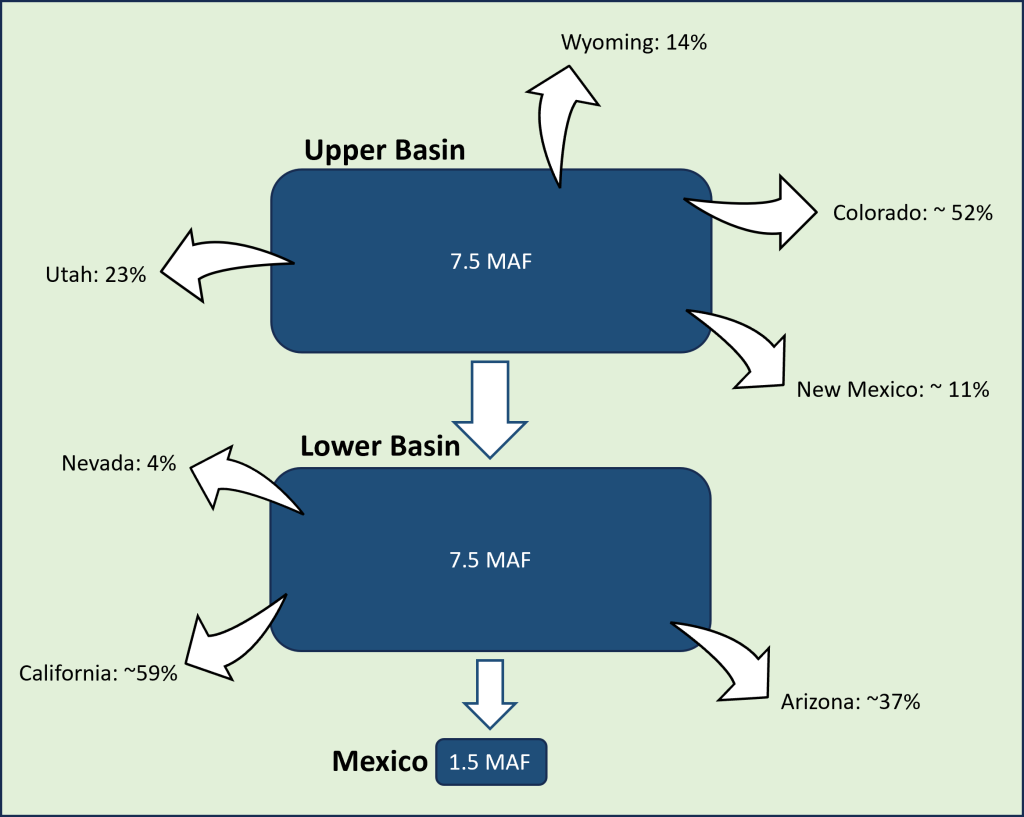
In 1922, negotiations over how water in the Colorado River would be allocated for use between the Upper and Lower Basins led to the creation of the Colorado River Compact. This compact stated that the Upper Basin would get 7.5 million acre-feet (MAF; an acre-foot is the volume of water required to cover one acre of land with a one foot thick layer of water) and the Lower Basin would also receive 7.5 MAF (Figure 2B.4.6). In 1944, it was officially recognized that Mexico also relied on this water, and so Mexico was allocated 1.5 MAF. This is a total of 16.5 MAF, and any remaining water in the river empties into the Gulf of California.
To ensure all segments of the river receive their allotment of water, a series of major dams were built along the river. The locations of these are marked on Figure 2B.4.5 in black squares. Many of these dams generate hydropower, however, their primary function is to control the flow of the Colorado River. Lake Powell is the large reservoir of water that has collected behind the Glen Canyon Dam, which sits on the boundary between the Upper and Lower Basins. This reservoir, which can hold approximately 2 years’ worth of Colorado River flow when it is full, serves as a safeguard to ensure the Upper Basin can access the full 7.5 MAF of water even if actual river flow for the year is below normal. Glen Canyon Dam regulates releases of water from the reservoir to comply with the Colorado River Compact and ensure the Lower Basin and Mexico receive their shares. The remaining dams and associated reservoirs throughout the Lower Basin serve similar roles, ensuring there is a reservoir of water to draw from even if river levels are below average. For example, the primary function of the Imperial Dam and reservoir is to make sure there is enough water for the All-American Canal, which transports water from the CRB all the way to the Imperial Valley of California to grow a large share of the country’s vegetables.
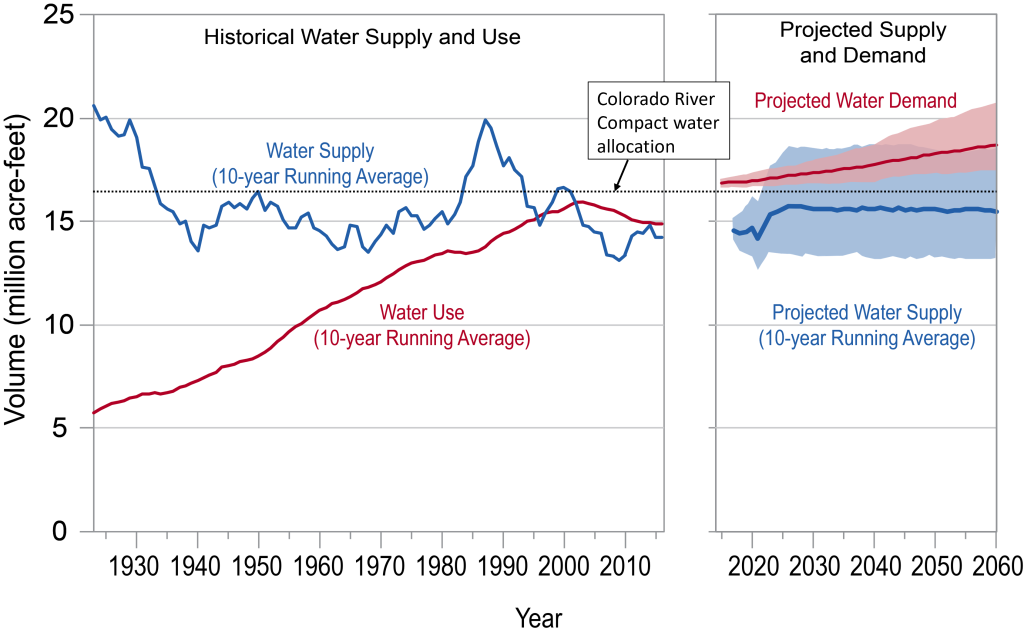
The volumes allocated in the Colorado River Compact were based on flow data at the time which indicated an average annual flow of about 16.4 MAF. This was also a time when the environmental impacts associated with allocating all the river’s water were not considered. As shown in Figure 2B.4.7, water volumes (blue line) declined shortly after the compact was signed to levels below the required 16.5 MAF for the compact (black dashed line). Only for about a decade starting in the early 1980s have volumes in the river been sufficient for what was laid out in the compact. This was historically not a problem as water usage (red line) was far below water supply.
Practice graph reading regarding water supply and demand in the CRB
Since 2000, flow volumes in the Colorado River have averaged almost 20% lower than flow volumes from 1900-1999. The Colorado River is dependent on melting winter snowpack in the Upper Basin to supply water, but the amount of snowpack has been steadily decreasing due to higher temperatures. Higher temperatures are also driving increased evapotranspiration in the basin, which means less water is finding its way into the river. In this way, higher temperatures, as a result of climate change, are driving about one third of the flow loss along the Colorado River. The larger issue leading to declining water is overconsumption. Human water usage grew steadily over the last century and since about 2000 more water has been removed than the river can sustainably supply (Figure 2B.4.7).
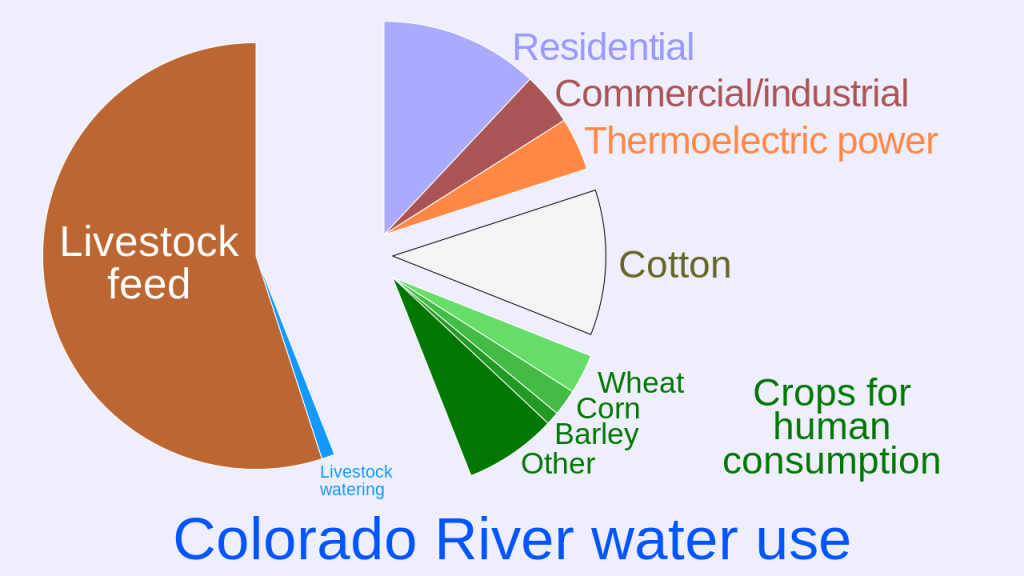
Much of the reason for overconsumption comes down to irrigation. Eighty percent of CRB water is used for agriculture. This breaks down into 56% for livestock feed (growing alfalfa, hay, feed corn, etc.) and livestock watering, 13% for human consumption crops, and 11% for cotton (Figure 2B.4.8). The 20% of remaining water consumption is residential (12%), commercial/industrial (4%) and thermoelectric (4%).
The most extensively grown crop throughout the CRB is alfalfa. As shown on Figure 2A.3.1, alfalfa is the most water intensive crop grown in the region, and this is crop is dominantly a feed crop (used to feed cattle for beef and dairy production). As the largest consumer of beef in the world, the demand for cattle is particularly high in the United States compared to other countries, which drives the dominance of alfalfa crops. However, this has come at a cost to CRB water as drought conditions have meant increased reliance on irrigation to feed this thirsty crop. The single largest user of CRB water is the Imperial Valley of California, whose main crop is alfalfa. As the climate continues to warm, the need for irrigation is expected to increase further. As the second largest user of CRB water, increasing residential populations throughout the area have also played a role in the overconsumption, albeit to a lesser degree.
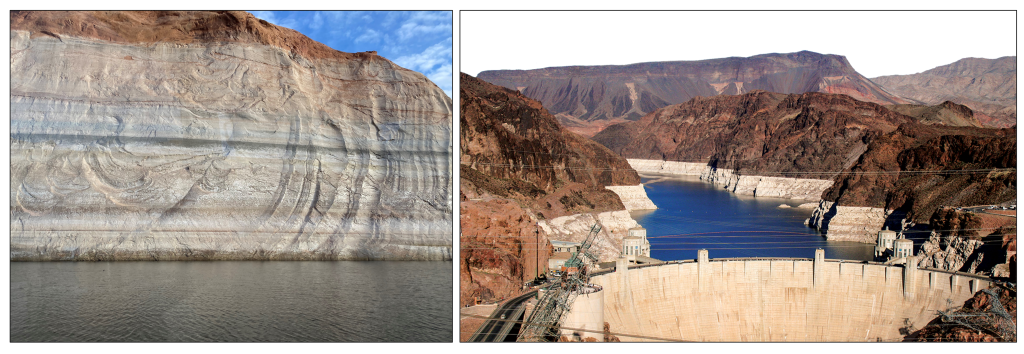
The result of this overconsumption is that water flow in the Colorado River is lower, but more importantly, water levels in the various reservoirs meant to buffer water losses in the river itself, have shrunk. In 2021, for the first time ever, a water shortage was declared as Lake Mead (the major reservoir in the Lower Basin) as it had dropped almost 40 feet from the year before and was down to only 35% of its capacity. Lake Powell, the major reservoir for the Upper Basin, has seen major drops in its water level as well. Visually this can be seen in photographs by the distinctive “bathtub rings” on the shores of the lakes (Figure 2B.4.9). The bathtub rings are areas where calcium carbonate and salts have attached themselves to the lake bottom, and as the water levels drop these white deposits are exposed showing a distinct line or ring around the lake from what used to be underwater (white rocks) vs. what was above water level (red rocks).
Declining water levels in Lake Powell and Lake Mead triggered agreements and contingency plans regarding water usage in the CRB. This has led to better water conservation practices in agriculture and residential areas, which has resulted in water usage levelling off and starting to decline (Figure 2B.4.7). However, usage remains above the level the river can support, which will mean continuing declines in the reservoirs into the future unless larger changes are made.
References
NASA Earth Observatory, (2021). Lake Mead drops to a record low. https://earthobservatory.nasa.gov/images/148758/lake-mead-drops-to-a-record-low
Richter, B.D., Bartak, D., Caldwell, P. et al. (2020). Water scarcity and fish imperilment driven by beef production. Nat Sustain 3, 319–328. https://doi.org/10.1038/s41893-020-0483-z
Udall, B. and Overpeck, J., (2017). The twenty-first century Colorado River hot drought and implications for the future. Water Resources Research. 53(3), 2404-2418. https://doi.org/10.1002/2016WR019638
United Stated Department of Agriculture, (2022). Farms and Land in Farms 2021 Summary. https://www.nass.usda.gov/Publications/Todays_Reports/reports/fnlo0222.pdf
U.S. Department of the Interior Bureau of Reclamation, (2012). Colorado River Basin
Water Supply and Demand Study Technical Report B-Water Supply Assessment https://www.usbr.gov/lc/region/programs/crbstudy/finalreport/Technical%20Report%20B%20-%20Water%20Supply%20Assessment/TR-B_Water_Supply_Assessment_FINAL.pdf
Williams, A.P., Cook, B.I. & Smerdon, J.E., (2022). Rapid intensification of the emerging southwestern North American megadrought in 2020–2021. Nat. Clim. Chang. 12, 232–234. https://doi.org/10.1038/s41558-022-01290-z
