5. Climate Feedback Loops
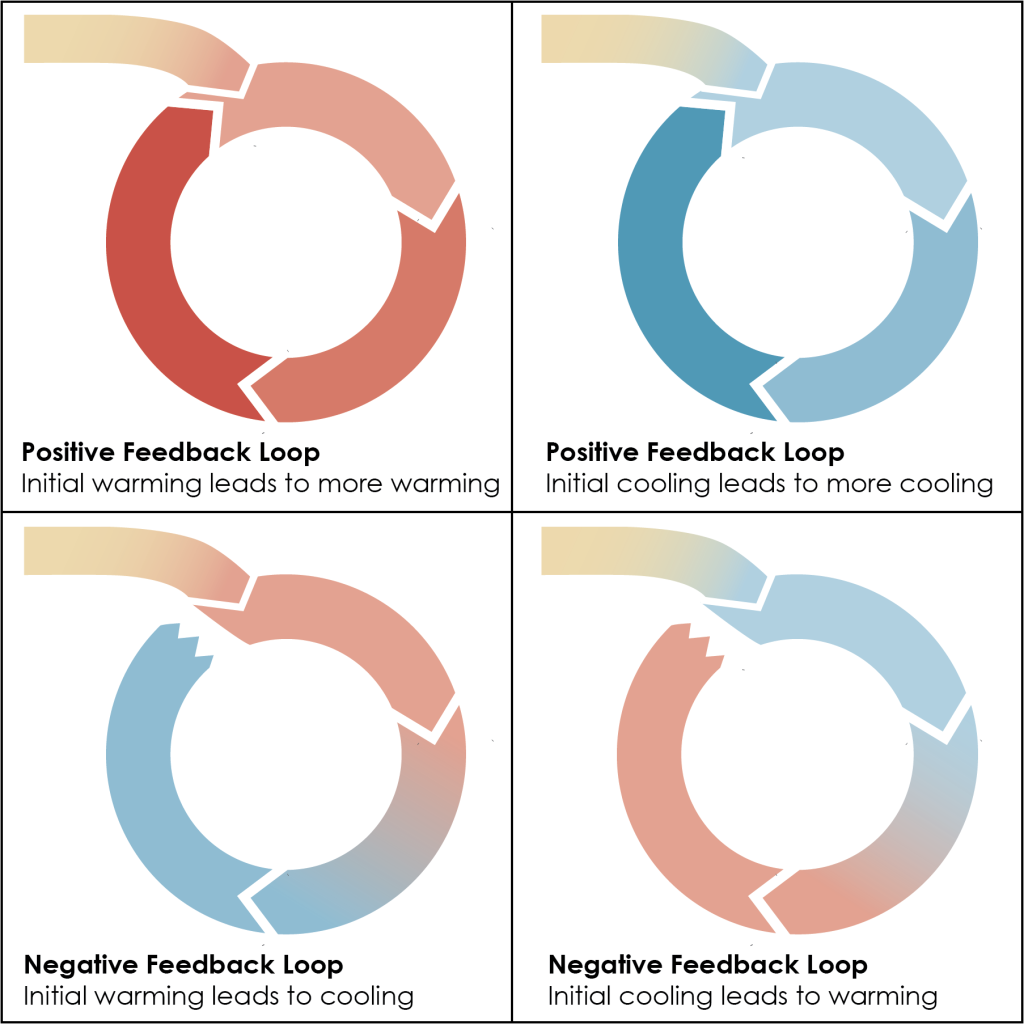
The climate forcing mechanisms can be highly interconnected, for example the location of continents as a result of plate tectonics can put land at a latitude more susceptible to growing ice sheets during certain times in the Milankovitch cycle, or the opening of a new ocean basin as plates diverge can alter thermohaline circulation changing the transfer of heat globally. But once the forcing mechanism has established a climate response of warmer or cooler temperatures, this starts a chain reaction of changes which circle around to further influence the initial climate response (Figure 3A.5.1). This chain reaction of changes is a feedback loop.

Climate feedback loops are classified as positive if they continue or amplify the initial climate response. If climate initially warmed, like the current state of climate on the planet, then positive feedback works to keep climate warming. If climate initially cooled, which has been the case in the past going into ice ages, a positive feedback loop works to keep climate cooling. In a negative feedback loop, the result of the loop would be to diminish or stop the initial climate response, i.e., if climate initially warmed a negative feedback loop would circle around to make climate cooler. Positive feedback loops are self-perpetuating, whereas negative feedback loops are not (Figure 3A.5.2).
Feedback loops are important for modelling climate. They provide a mechanism for analyzing the possible consequences of human actions on the climate system. Human actions cannot directly affect forcing mechanisms such as Milankovitch cycles or plate tectonics, but they can affect albedo and the carbon cycle, and therefore the greenhouse effect. These two aspects are also of particular importance because they affect climate on time scales of concern to societies: the next decades to century.
Feedback Loop Example: Arctic Sea Ice and Albedo
Let’s look at the example of changing albedo in the arctic and the climate response.
Polar regions are particularly susceptible to increasing global temperatures. For hundreds of years explorers searched for a Northwest Passage that would allow trips to travel between the Atlantic and Pacific Oceans through the Arctic Ocean north of Canada. This would have significantly reduced shipping times between Asia and Europe compared to navigating all the way around South America (prior to building the Panama Canal).
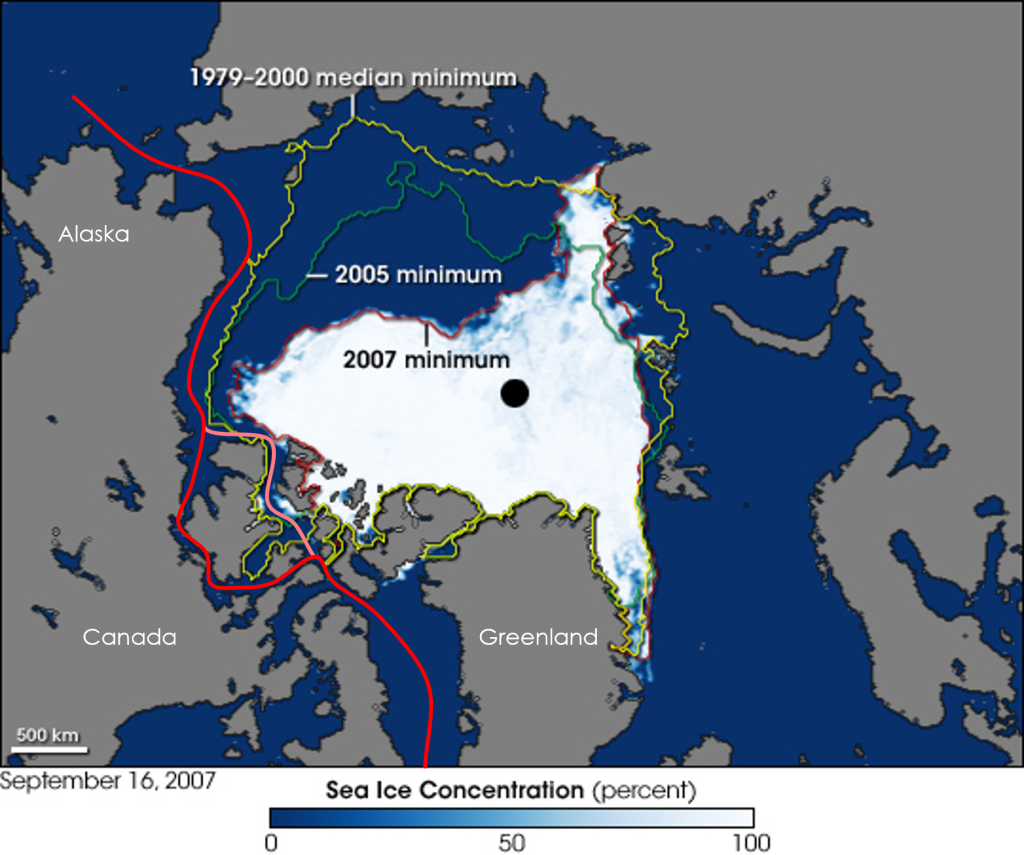
Robert McClure discovered the route for the Northwest Passage in 1850, however did not navigate it by boat as his boat got stuck in the closing sea ice. The record of the first passage by boat was made in 1903-1906 by Roald Amundsen, but the passage was not clear of ice for long enough to complete in one summer season. Until recently, the passage has only been clear of sea ice for limited and unpredictable amounts of time, not allowing for regular shipping to take place. As a result of warming, since 2007 the southern route of the Northwest Passage has been navigable in late summer when sea ice is at its minimum, with the northern route being navigable some of those years as well (Figure 3A.5.3). The northern route is not as sheltered and more prone to sea ice pushing into it from the more open ocean farther north.
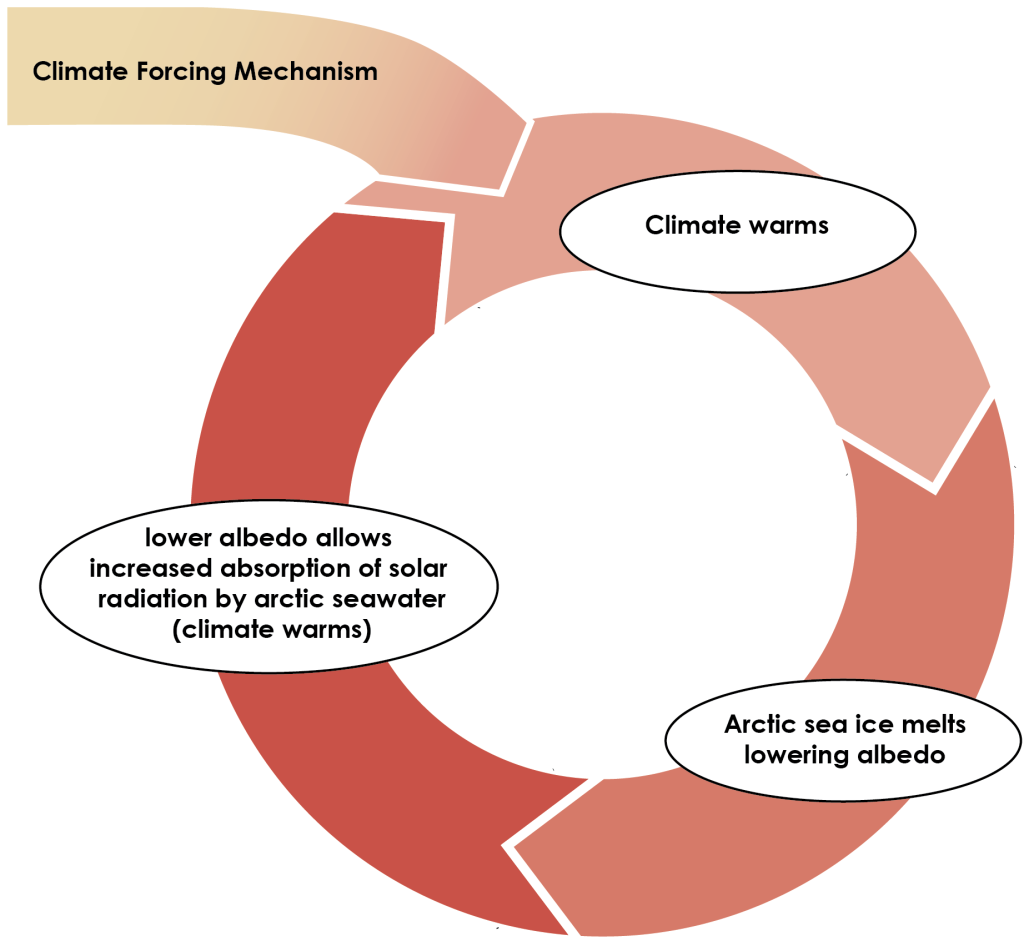
A warming climate has decreased sea ice extent over time, and this has created a feedback loop as a result of changing albedo. The albedo of sea ice is 0.5-0.7 whereas the albedo of ocean water is far lower at 0.06. As climate warms it causes sea ice to melt, which means the amount of open ocean increases. With more open ocean and less sea ice, the albedo of the area decreases. This means less solar radiation is reflected and more is absorbed by the ocean. This heats up the ocean water which causes sea ice to melt even more, and the cycle continues (Figure 3A.5.4). So, while warming temperatures caused the sea ice to melt initially, allowing the Northwest Passage to open, this set off a positive feedback loop in the climate that has led to the continued diminishing of sea ice.
Connecting this to the Earth System
Don’t forget these feedbacks are taking place in the Earth system. Use the question below to practice picking out spheres and components in the Earth system that are involved in this feedback loop.
The example feedback between albedo and sea ice is just one of many climate feedbacks. This feedback is fairly straightforward, but not all feedbacks are. The role of cloud cover has been the area of greatest uncertainty in climate models because of their ability to cool through increased reflection of solar radiation (high albedo) and their ability to trap heat through enhancing the greenhouse effect. Which of these effects is dominant depends in part on where the clouds are located: low thick clouds reflect and emit radiation to space while high clouds act as a blanket trapping heat in the atmosphere. The short-lived nature of clouds and non-uniformity across the planet makes calculating the overall effects of them very difficult. Older climate models had these opposing effects causing some warming but mostly cancelling each other out. Newer research has suggested that a warming climate will actually thin the low, reflective cloud cover more drastically than previously thought setting up a stronger positive feedback loop of warming leading to reduced cloud cover and lower albedo which in turn leads to more warming (Zelinka et al., 2020). Uncertainties in climate models such as cloud cover, are not because scientists do not understand or are unable to model what will happen to climate, but rather that complexity of how climate factors interact mean there is a range of possible outcomes that can make a particular feedback loop behave more strongly or more weakly to affect climate.
Use the question below to practice making a feedback loop for the cloud dynamics described above by dragging and dropping the text boxes into their correct position on the feedback loop diagram. Note that not all text boxes will be used. A neutral green color has been used for the feedback loop arrows so as not to influence text choices.
References
NASA Earth Observatory. (n.d.). Ice persists in the Northwest passage. https://earthobservatory.nasa.gov/images/148802/ice-persists-in-the-northwest-passage
NOAA. (2016, September 16). Northwest Passage clear of ice again in 2016. https://www.climate.gov/news-features/event-tracker/northwest-passage-clear-ice-again-2016
Zelinka, M. D., Myers, T. A., McCoy, D., Po‐Chedley, S., Caldwell, P., Ceppi, P., Klein, S. A., & Taylor, K. E. (2020). Causes of higher climate sensitivity in CMIP6 models. Geophysical Research Letters, 47(1). https://doi.org/10.1029/2019gl085782
