7. Assessing Seismic Risk
Geologists and public safety officials would love to be able to accurately predict the location, magnitude, and timing of earthquakes on time scales that would be useful for minimizing danger to the public and damage to infrastructure (e.g., weeks, days, hours). Many methods of prediction have been explored including using observations of warning foreshocks, changes in magnetic fields, episodic tremor and slip, changing groundwater levels, strange animal behavior, patterns in the timing between earthquakes, and how stress is transferred after a rupture. So far, none of these has provided a reliable method. Although there are some reports of successful earthquake predictions, they are rare, and many are surrounded by doubtful circumstances.
There was great hope for earthquake predictions late in the 1980s when attention was focused on part of the San Andreas Fault at Parkfield, approximately 200 km south of San Francisco, California. Between 1881 and 1965 there were five earthquakes at Parkfield. They were spaced at approximately 20-year intervals, all confined to the same 20 km-long segment of the fault, and all close to M6. Both the 1934 and 1966 earthquakes were preceded by small foreshocks exactly 17 minutes before the main quake.
The U.S. Geological Survey recognized this as an excellent opportunity to understand earthquakes and earthquake prediction, so they armed the Parkfield area with a huge array of geophysical instruments and waited. The next earthquake was expected to happen around 1987, but it never did. The “1987 Parkfield earthquake” finally struck in September 2004. Fortunately, all of the equipment was still there to record the earthquake, but it was no help from the perspective of earthquake prediction. There were no significant precursors to the 2004 Parkfield earthquake in any of the parameters measured, including tremors, changes in rock deformation, the magnetic field, the electrical conductivity of the rock, and creep (motion along the fault that is not accompanied by earthquakes). There was no foreshock. In other words, even though every available technique was used to monitor it, the 2004 earthquake came with no warning whatsoever.
7.1 Earthquake Probabilities
To be useful to the public and governments, earthquake predictions must be accurate most of the time, not just some of the time. If a prediction method is only accurate 10% of the time (and even that is not possible with the current state of knowledge), the public will lose faith in the process very quickly and then will ignore all of the predictions. The hope for earthquake prediction is not dead, but it was hit hard by the missed prediction in Parkfield.
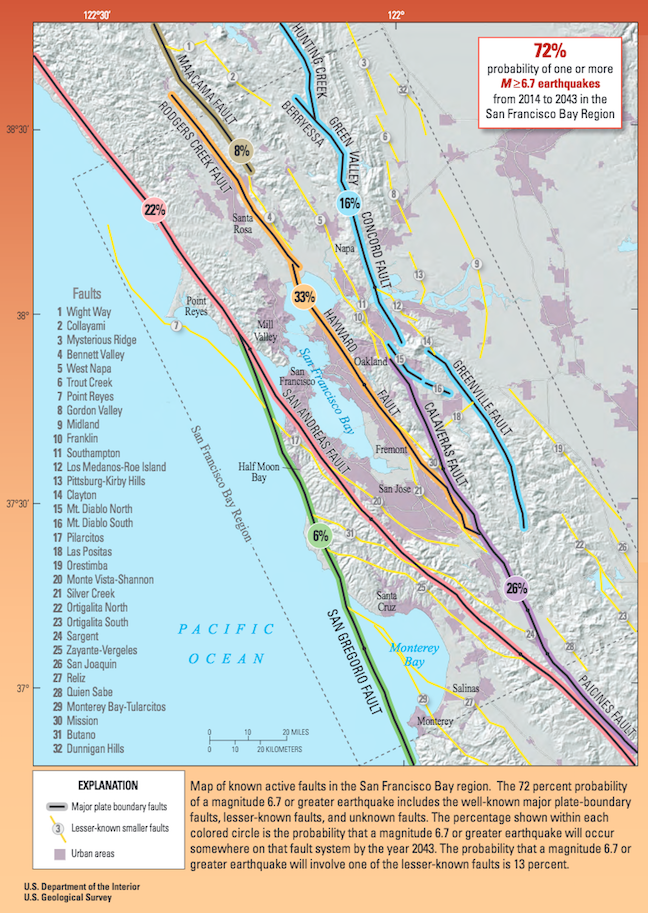
Today the focus of efforts in earthquake-prone regions is to provide forecasts of earthquake probability. Earthquake probabilities express the likelihood that an earthquake of a given magnitude will occur at a location within a given period of time. An example of this approach for the San Francisco Bay region of California is shown in Figure 1B.7.1. Based on a wide range of information, including past earthquake history, accumulated stress from plate movement, and known stress transfer, seismologists and geologists have predicted the likelihood of a M6.7 or greater earthquake on each of eight major faults that cut through the region. The greatest probabilities are on the San Andreas, Rogers Creek/Hayward faults (33%, orange line), and Calaveras/Paicines faults (26%, purple line). There is a 72% chance that a major and damaging earthquake will take place somewhere in the region prior to 2043.
7.2 Seismic Risk
Without an adequate way to predict earthquakes, the next best step is assessing the seismic risk of an area in order to keep people safe by educating the public about earthquake hazards, setting earthquake building codes for areas, and determining what action is necessary to make existing infrastructure earthquake-safe (this is called retrofitting). Assessing risk is also helpful for earthquake preparedness as it can inform what locations are likely to be the most damaged and should be prioritized for emergency services or emergency stockpiling of goods like bottled water and food in the event of an earthquake.
Seismic risk can be calculated by taking a wide range of factors into consideration. These can be simplified by the following formula:
Seismic Risk = Seismic Hazard x Building Vulnerability x Value
In essence, there are three major categories that need to be considered to assess the risk of an area. These are explained in the table below.
| Category | Examples of what is included in this category | Information needed to make decisions about severity |
| Seismic Hazard | What is the probability of an earthquake in this area? | fault locations in the area |
| What is the expected shaking intensity? | soil type can affect shaking intensity, as can distance from an epicenter | |
| What is the liquefaction potential? | soil/rock type will affect liquefaction potential | |
| What is the landslide potential? | steepness of the landscape | |
| Building vulnerability | How vulnerable are the buildings to damage | age of buildings, materials used to make buildings, are walls reinforced, are floor plans open, what soil type are the foundations built on, have buildings been built to new building codes or retrofitted |
| Value | Population | population density |
This is a useful way to think about risk assessment because it emphasizes that while seismic hazards can be independent of people, risk is centered on how an earthquake will affect human life. An area can have the largest seismic hazard potential anywhere – steep landscape that is water saturated sediments right on a fault line – but if there are absolutely no buildings or people there, the risk to human life is zero.
Check your understanding: Assessing Seismic Risk
