2. Modeling Earth’s Climate
2.1 Climate Models
Climate models are computer simulations of the Earth system that can be used to recreate climate in the past or project how climate will change in the future. They incorporate well understood physical properties of climate such as wind speeds, rainfall patterns, atmospheric temperatures, ocean circulation, etc. and use computers to calculate how these characteristics interact and change over time as climate forcings change. Using computers to aid in this work is important as climatic changes are the result of complex interactions within the Earth system. The huge number of interactions that control or are the result of climate change are far more than could be determined easily without a computer.
Using models to investigate future climate requires careful consideration of how to build the model and run experiments. It also requires skillful use of real-life measurements to set up the model, and to interpret and evaluate its results. Physical climate processes and interactions are well understood and the parameters that govern those processes can be accurately programmed and simulated in climate models so that models are a realistic representation of the Earth system. The models are then run for time periods where we know the outcome, to test their accuracy. This builds reliability and confidence in how the computer model has been programmed.
Climate models are designed by many different research groups at many different institutions, where they are set up with slightly different mathematical representations of processes or different levels of detail in geographic representations. Different research groups will run possible future climate scenarios using these different parameters and if the models all produce similar results despite the initial differences, it builds confidence in the results.
The current climate models scientists and policy makers rely on have gone through a lot of testing such that there is high confidence in their ability to accurately model future climate. While the models are reliable, there is always going to be some level of uncertainty inherent in any model. This is not because scientists are unsure about the validity of the model but rather that as climate interactions progress, there are a range of possible outcomes based on the initial conditions used for the model. Some of this uncertainty is because of the slightly different initial parameters used by different research groups and some is because not all aspects of climate can be characterized by a single value that is input into the model, but rather a range of possible values. For example, the atmospheric emissions from volcanic eruptions cannot be characterized by a single value for CO2 or SO2, but rather by a range of possible emissions of those gases based on past observations. Uncertainty is expressed as the likelihood that model results are in a specific range of values. Uncertainty in climate models is typically quite low when modeling only a handful of years into the future but increases with increasing time into the future.
Climate models have evolved through time and gotten more sophisticated as knowledge of Earth system interactions has grown. Scientists have been using models to predict climate changes since the 1970s and now, 50 years later, they can look back at those earlier models and see that actual climate trends have followed the modelled trends quite accurately.
2.2 Modeling Future Scenarios
The Intergovernmental Panel on Climate Change (IPCC) is an intergovernmental body of the United Nations whose role is to advance scientific knowledge about climate change. Since 1990 they have produced comprehensive reports that assess the latest climate science, releasing a new report approximately every 6 years. The IPCC provides a single platform for scientists and policy makers to come together to discuss climate and climate actions.
Shared Socioeconomic Pathways
Within the IPCC reports, climate models representing an array of possible future outcomes are presented. The IPCC’s Sixth Assessment Report (AR6), released in 2021, focused on 5 future baseline worlds called Shared Socioeconomic Pathways (SSPs). These SSPs represent different possible paths human activity could take with regards to social, economic, political, and technological changes between now and 2100 in the absence of new climate policies beyond what are currently in place. Included in the SSPs are factors like population growth, economic growth, education, urbanization, trade, energy, and agricultural systems.
Changes in these factors will drive lower or higher anthropogenic greenhouse gas emissions. For example, increasing population would lead to increased need for food and therefore land use and agricultural changes that cause emissions to increase, and increasing education could increase the rate of technological developments allowing us to more easily mitigate climate change or adapt to a changing environment.
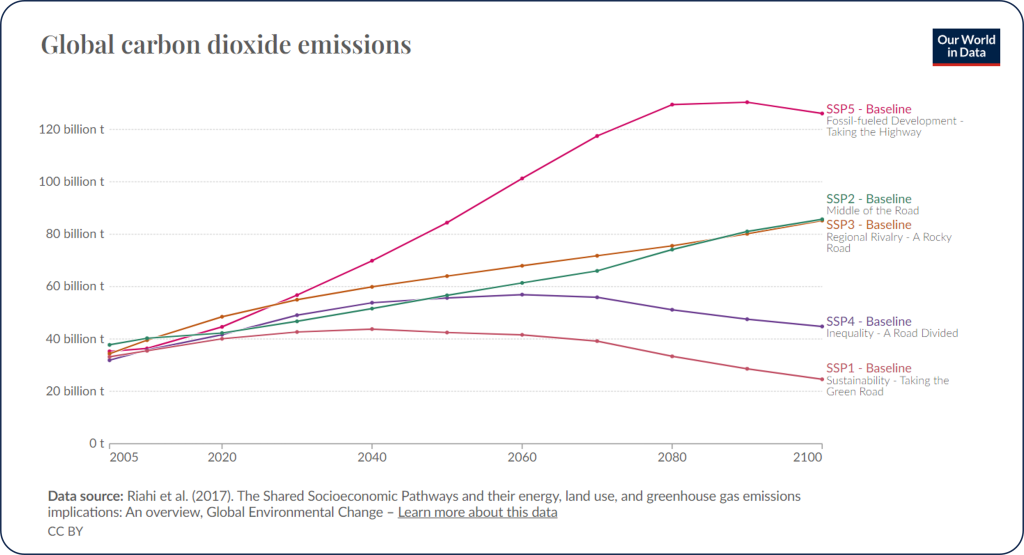
The five Shared Socioeconomic Pathways used for climate modeling are a world focused on sustainability and equality (SSP1), a world where trends follow historical patterns and does not operate much differently than it has in the past (SSP2), a world of resurgent nationalism and regional rivalry (SSP3), a world of increasing inequality (SSP4), and a world that focuses on equality and education but through the use of unbridled growth and fossil fuel exploitation (SSP5).
A detailed description of each of these worlds is below (from Riahi et al., 2017):
SSP1: Sustainability – Taking the Green Road (Low challenges to mitigation and adaptation)
The world shifts gradually, but pervasively, toward a more sustainable path, emphasizing more inclusive development that respects perceived environmental boundaries. Management of the global commons slowly improves, educational and health investments accelerate the demographic transition, and the emphasis on economic growth shifts toward a broader emphasis on human well-being. Driven by an increasing commitment to achieving development goals, inequality is reduced both across and within countries. Consumption is oriented toward low material growth and lower resource and energy intensity.
SSP2: Middle of the Road (Medium challenges to mitigation and adaptation)
The world follows a path in which social, economic, and technological trends do not shift markedly from historical patterns. Development and income growth proceeds unevenly, with some countries making relatively good progress while others fall short of expectations. Global and national institutions work toward but make slow progress in achieving sustainable development goals. Environmental systems experience degradation, although there are some improvements and overall the intensity of resource and energy use declines. Global population growth is moderate and levels off in the second half of the century. Income inequality persists or improves only slowly and challenges to reducing vulnerability to societal and environmental changes remain.
SSP3: Regional Rivalry – A Rocky Road (High challenges to mitigation and adaptation)
A resurgent nationalism, concerns about competitiveness and security, and regional conflicts push countries to increasingly focus on domestic or, at most, regional issues. Policies shift over time to become increasingly oriented toward national and regional security issues. Countries focus on achieving energy and food security goals within their own regions at the expense of broader-based development. Investments in education and technological development decline. Economic development is slow, consumption is material-intensive, and inequalities persist or worsen over time. Population growth is low in industrialized and high in developing countries. A low international priority for addressing environmental concerns leads to strong environmental degradation in some regions.
SSP4: Inequality – A Road Divided (Low challenges to mitigation, high challenges to adaptation)
Highly unequal investments in human capital, combined with increasing disparities in economic opportunity and political power, lead to increasing inequalities and stratification both across and within countries. Over time, a gap widens between an internationally-connected society that contributes to knowledge- and capital-intensive sectors of the global economy, and a fragmented collection of lower-income, poorly educated societies that work in a labor intensive, low-tech economy. Social cohesion degrades and conflict and unrest become increasingly common. Technology development is high in the high-tech economy and sectors. The globally connected energy sector diversifies, with investments in both carbon-intensive fuels like coal and unconventional oil, but also low-carbon energy sources. Environmental policies focus on local issues around middle and high income areas.
SSP5: Fossil-fueled Development – Taking the Highway (High challenges to mitigation, low challenges to adaptation)
This world places increasing faith in competitive markets, innovation and participatory societies to produce rapid technological progress and development of human capital as the path to sustainable development. Global markets are increasingly integrated. There are also strong investments in health, education, and institutions to enhance human and social capital. At the same time, the push for economic and social development is coupled with the exploitation of abundant fossil fuel resources and the adoption of resource and energy intensive lifestyles around the world. All these factors lead to rapid growth of the global economy, while global population peaks and declines in the 21st century. Local environmental problems like air pollution are successfully managed. There is faith in the ability to effectively manage social and ecological systems, including by geo-engineering if necessary.
Within the climate models, these baseline SSPs can be thought of as alternate future worlds without any mitigation measures taken. Figure 3D.2.1 illustrates the projected global CO2 emissions from each of these baseline worlds.
Combining SSPs and Mitigation Targets
The baseline SSPs model worlds without any mitigation measures taken, but scientists also want to study what might happen if measures are taken to mitigate the human impact by reducing emissions or utilizing technologies that remove CO2 from the atmosphere. These mitigation measures have specific radiative forcing targets, which correspond to specific atmospheric greenhouse gas concentration targets that aim to keep warming to certain temperatures (under 1.5°C or 2°C, etc.) by the year 2100 relative to pre-industrial average temperatures.
Radiative forcing quantifies the difference between the amount of energy that enters Earth’s atmosphere and the amount of energy that leaves Earth’s atmosphere (refresh your memory on Earth’s Energy Budget if you need to!) and is measured in watts per square meter (W/m2). It is essentially a measure of the heating effect caused by greenhouse gases. The higher the radiative forcing number, the higher the associated greenhouse gas concentrations in the atmosphere and therefore the higher the temperature rise by 2100. The box on the right gives an overview of how radiative forcing values correspond to temperature rise by 2100 over the pre-industrial averages.
Each mitigation target is labeled based on the radiative forcing value it is geared to achieve. Climate models that are run with an SSP world and a mitigation target are given an SSP + radiative forcing number combination. So, SSP1-1.9 is a climate model run using an SSP1 world plus radiative forcing is kept to 1.9W/m2 meaning mitigation measures are taken in this version of an SSP1 world to keep greenhouse gas concentrations low enough that average temperatures do not rise more than 1.5°C by 2100.
The IPCC report focuses on 5 modeled scenarios (combinations of SSPs and emissions targets) in the Sixth Assessment Report. These are:
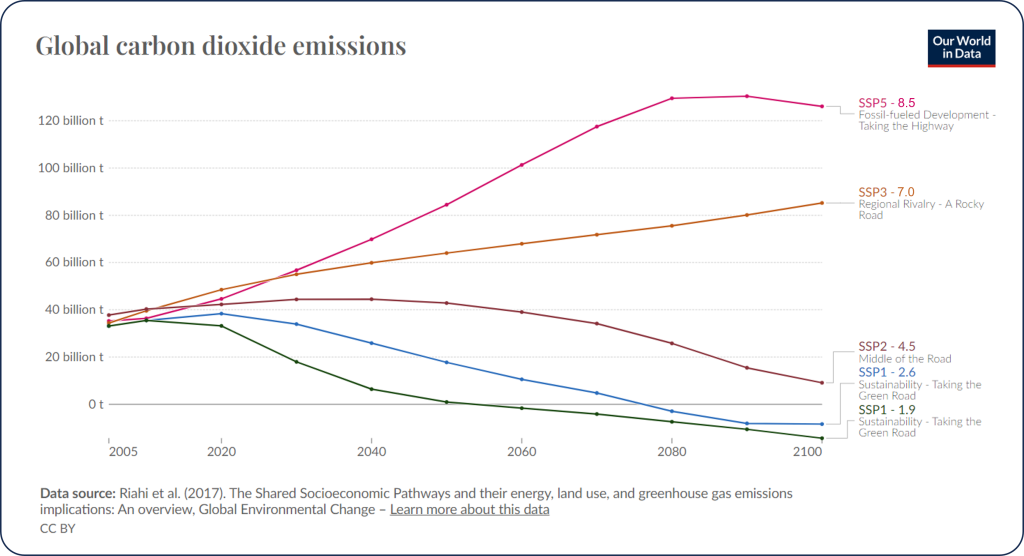
SSP1-1.9 – This is the most optimistic scenario and complies with the objective of the Paris Agreement set in 2015 to keep temperatures well below 2°C above pre-industrial limits, with efforts to keep it below 1.5°C by 2100. This has global carbon emissions cut to net zero by 2050. This allows the world to avoid most of the worst consequences of climate change.
SSP1-2.6 – This is the next best scenario with carbon emissions strongly reduced and net zero emissions reached after 2050. Temperatures stabilize around 1.8°C by 2100.
SSP2-4.5 – This is the middle scenario where carbon emissions don’t begin to decline until about 2050 and progress towards sustainability is slow and uneven. Temperatures rise to 2.7°C by 2100.
SSP3-7.0 – This is considered a dangerous scenario due to a temperature rise of over 3.5°C by 2100. Greenhouse gas emissions and temperatures increase with CO2 emissions roughly doubling from current levels by 2100.
SSP5-8.5 – This is the worst case scenario with CO2 emissions almost tripled by 2050 due to the high use of fossil fuels and energy intensive lifestyles with limited to no mitigations. Average temperature rises around 4.5°C or greater by 2100.
Figure 3D.2.2 illustrates the global carbon emissions associated with each of the above scenarios.
Check your understanding: Climate modeling
References
Hausfather, Z. (2018, April 19). Explainer: How ‘Shared Socioeconomic Pathways’ explore future climate change. Carbon Brief. https://www.carbonbrief.org/explainer-how-shared-socioeconomic-pathways-explore-future-climate-change/
IPCC (2022). Climate Change 2022: Impacts, adaptation and Vulnerability. https://www.ipcc.ch/report/ar6/wg2/
IPCC (2023). AR6 Synthesis Report: Climate Change 2023. https://www.ipcc.ch/report/ar6/syr/
Riahi, K., Van Vuuren, D. P., Kriegler, E., Edmonds, J., O’Neill, B. C., Fujimori, S., Bauer, N., Calvin, K., Dellink, R., Fricko, O., Lutz, W., Popp, A., Cuaresma, J. C., Kc, S., Leimbach, M., Jiang, L., Kram, T., Rao, S. T., Emmerling, J., . . . Tavoni, M. (2017). The Shared Socioeconomic Pathways and their energy, land use, and greenhouse gas emissions implications: An overview. Global Environmental Change, 42, 153–168. https://doi.org/10.1016/j.gloenvcha.2016.05.009
Our World in Data (n.d.). IPCC Scenarios Data Explorer. (n.d.). https://ourworldindata.org/explorers/ipcc-scenarios
