5. Solar Powered Electricity
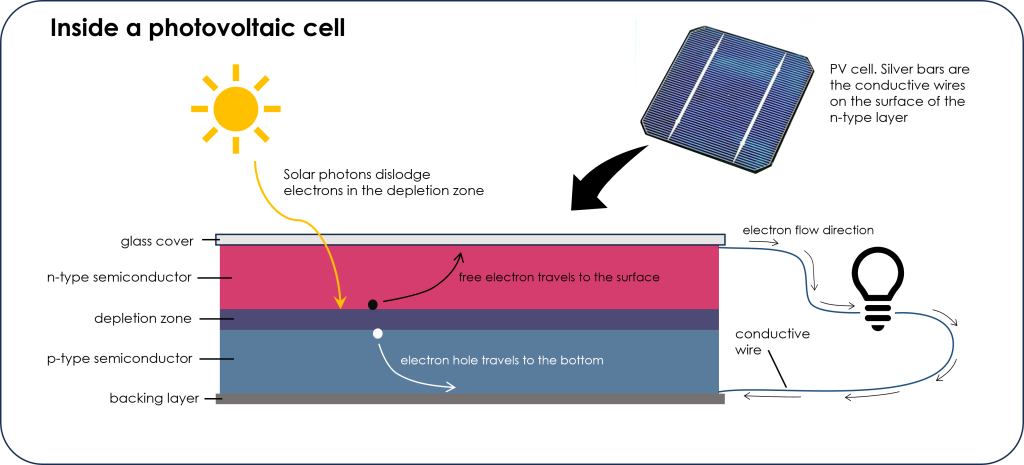
Electricity can be generated by harnessing solar power in a couple of ways, but the most widespread method uses photovoltaic (PV) cells, or solar cells. A PV cell is made up of semiconductor material (the most used semiconductor material is silicon although cadmium based PV cells are also used) sandwiched between a glass cover and a backing material. The semiconductor has two layers, a top layer that is negatively charged (n-type layer) and a bottom layer that is positively charged (p-type layer). The boundary between these two layers is called the depletion zone where an internal electric field is created that prevents electrons from flowing from the negatively charged side to the positively charged side to balance the charge difference. As photons from the sun pass through the glass and get absorbed by the semiconductor, they dislodge electrons from the atoms within the depletion zone. These free electrons flow to the surface of the semiconductor n-type layer and the electron hole created by the dislodging of the electron flows down to the p-type layer. By connecting the negatively charged, n-type, layer with the positively charged, p-type, layer with a conductive material such as a metallic wire, the electrons will flow from the n-type layer back to the p-type layer to fill the electron hole (Figure 3C.51). This flow of electrons is electricity!
A single PV cell is anywhere from 0.5 to 4 inches across and can generate 1-2 watts of electricity. This is enough to power small items like a calculator or a watch. PV cells are connected to create larger solar panels, like would be seen on a house roof or in a solar farm. An individual solar panel can generate 300-600 watts of electricity and is roughly 2 meters long by 1 meter wide.
The potential to generate solar power is not the same everywhere or even consistent throughout the day. The three main factors affecting solar power are latitude, cloud cover, and daylight hours. As discussed in Chapter 3A.2, the intensity of incoming solar radiation varies across the planet. At latitudes closer to the equator, solar radiation is more direct and therefore has the potential to generate more power. The solar power potential is also affected by cloud cover as clouds scatter incoming rays reducing solar power. Finally, at nighttime when the sun is not shining, solar energy cannot be generated. Polar locations have up to 24 hours of sunlight during the summer and regions at 45°N or S have over 15 hours of sunlight on the longest days of the year, making solar energy potential high in the summertime. However, winter in these areas can be very dark with minimal sunlight. Equatorial regions on the other hand have a near constant number of daylight hours throughout the year, which makes the solar energy potential more consistent throughout the year. Regardless of the number of daylight hours, the intensity of solar radiation changes throughout the day. Solar radiation is strongest when the sun is high, so midday hours instead of morning and evening hours.
The variations in solar radiation throughout the day and year mean solar energy is intermittent, not constant, and not necessarily available during peak usage times. Solar energy can be stored to be used at times when it is not being actively produced. The two main methods of storing excess energy are pumped hydroelectric storage and batteries. With pumped hydroelectric storage the energy is used to pump water uphill to a holding reservoir where it can be later released and sent through a turbine to generate electricity. This form of storage is usually done once the solar energy has been delivered to the electrical grid and is the main form of electrical grid energy storage for all types of stored energy (solar, wind, etc.). Battery storage is done from the electrical grid or directly on the solar farm prior to supplying the electrical grid.
Minnesota Connection: Mining in Northern Minnesota
Iron mining has a long history in northern Minnesota dating back to the 1880s. In the late 1940s copper-nickel deposits were discovered in this area as well. Exploration and research into the extent and viability of extracting copper and nickel were carried out after that, and through the late 1970s and early 1980s mining of these resources seemed imminent. However, declining copper prices at this time put an end to thoughts about mining these ores.
Since the early 2000s there has been renewed interest in mining these deposits as the push for renewable energy has created a new demand for nickel. Nickel is an important element in lithium-ion batteries, which is the main battery technology for electric vehicles and renewable energy storage from sources like wind and solar.
Two major projects by the PolyMet Mining Corporation and Twin Metals Minnesota are proposing new mining projects to extract copper-nickel resources in northern Minnesota, both in areas that are close to the Boundary Waters Canoe Area Wilderness (BWCAW), a vast wilderness reserve along the Minnesota-Canada border. Both projects have been embroiled in regulatory battles for at least a decade while environmental impact assessments were carried out. As of 2023, both projects have been denied permits or had permits revoked due to environmental impacts such as wetland degradation or freshwater contamination risk.
This is a is a hot topic through northern Minnesota as the economy has historically relied on mining with many of the towns through the area being mining towns for generations. In more recent decades though, the economy has transitioned to also relying on outdoor recreational tourism in the many wilderness areas including the BWCAW. Battles over mine permitting have put mining in direct competition with tourism, pitting the two most important economic factors in the area against each other. Both of these projects have uncertain futures but seem unlikely for the time being.
Solar energy is inexhaustible and clean, with no greenhouse gas emissions associated with actual energy production. The greenhouse gas emissions and environmental impacts are connected to mining raw materials to make solar panels and the batteries, the construction and emplacement of the panels, and the disposal of panels at the end of their lifespan. Silicon for the panels, copper and silver for conductive metals, lithium and nickel for batteries, along with many other metals are required to make solar energy function and all these materials must be mined. To decrease the harmful impacts associated with mining for solar panel and battery components, or really for any mining activity, new methods of recycling old materials, more stringent environmental regulations that are applied equally in all countries, and research into new technologies that reduce mining impacts are required. The need for mineral resources that allow renewable energies to be utilized is not going away so more sustainable ways of mining must emerge.
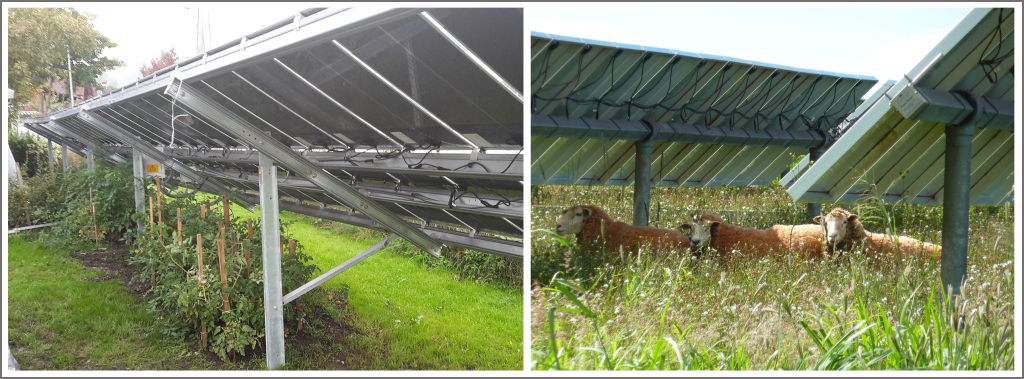
Solar panels are a very versatile source of electricity as they can be installed as large solar farms or used on a smaller scale by being installed directly on homes and businesses. This also reduces the land area required for producing electricity, which is relatively high when installed as solar farms, requiring more land than other energy sources per amount of electricity produced except for some styles of coal and hydroelectric power plants. Solar panels are not placed directly beside each other as this causes neighboring solar panels to shade each other throughout the day, reducing efficiency. In recent decades, research into how to maximize land use in solar farms has developed a method called agrivoltaic farming. This turns solar farm areas into dual use with agricultural land. Crops are planted in the spaces around and between solar panels to maximize land use (Figure 3C.5.2, left). This style of agrivoltaics can be particularly useful in very hot and sunny climates as the solar panels help to shade the crops and reduce evapotranspiration. Solar panels co-located with ranching can be installed high enough to allow animals to graze the grassy areas underneath while also providing needed daytime shade for the animals (Figure 3C.5.2, right).
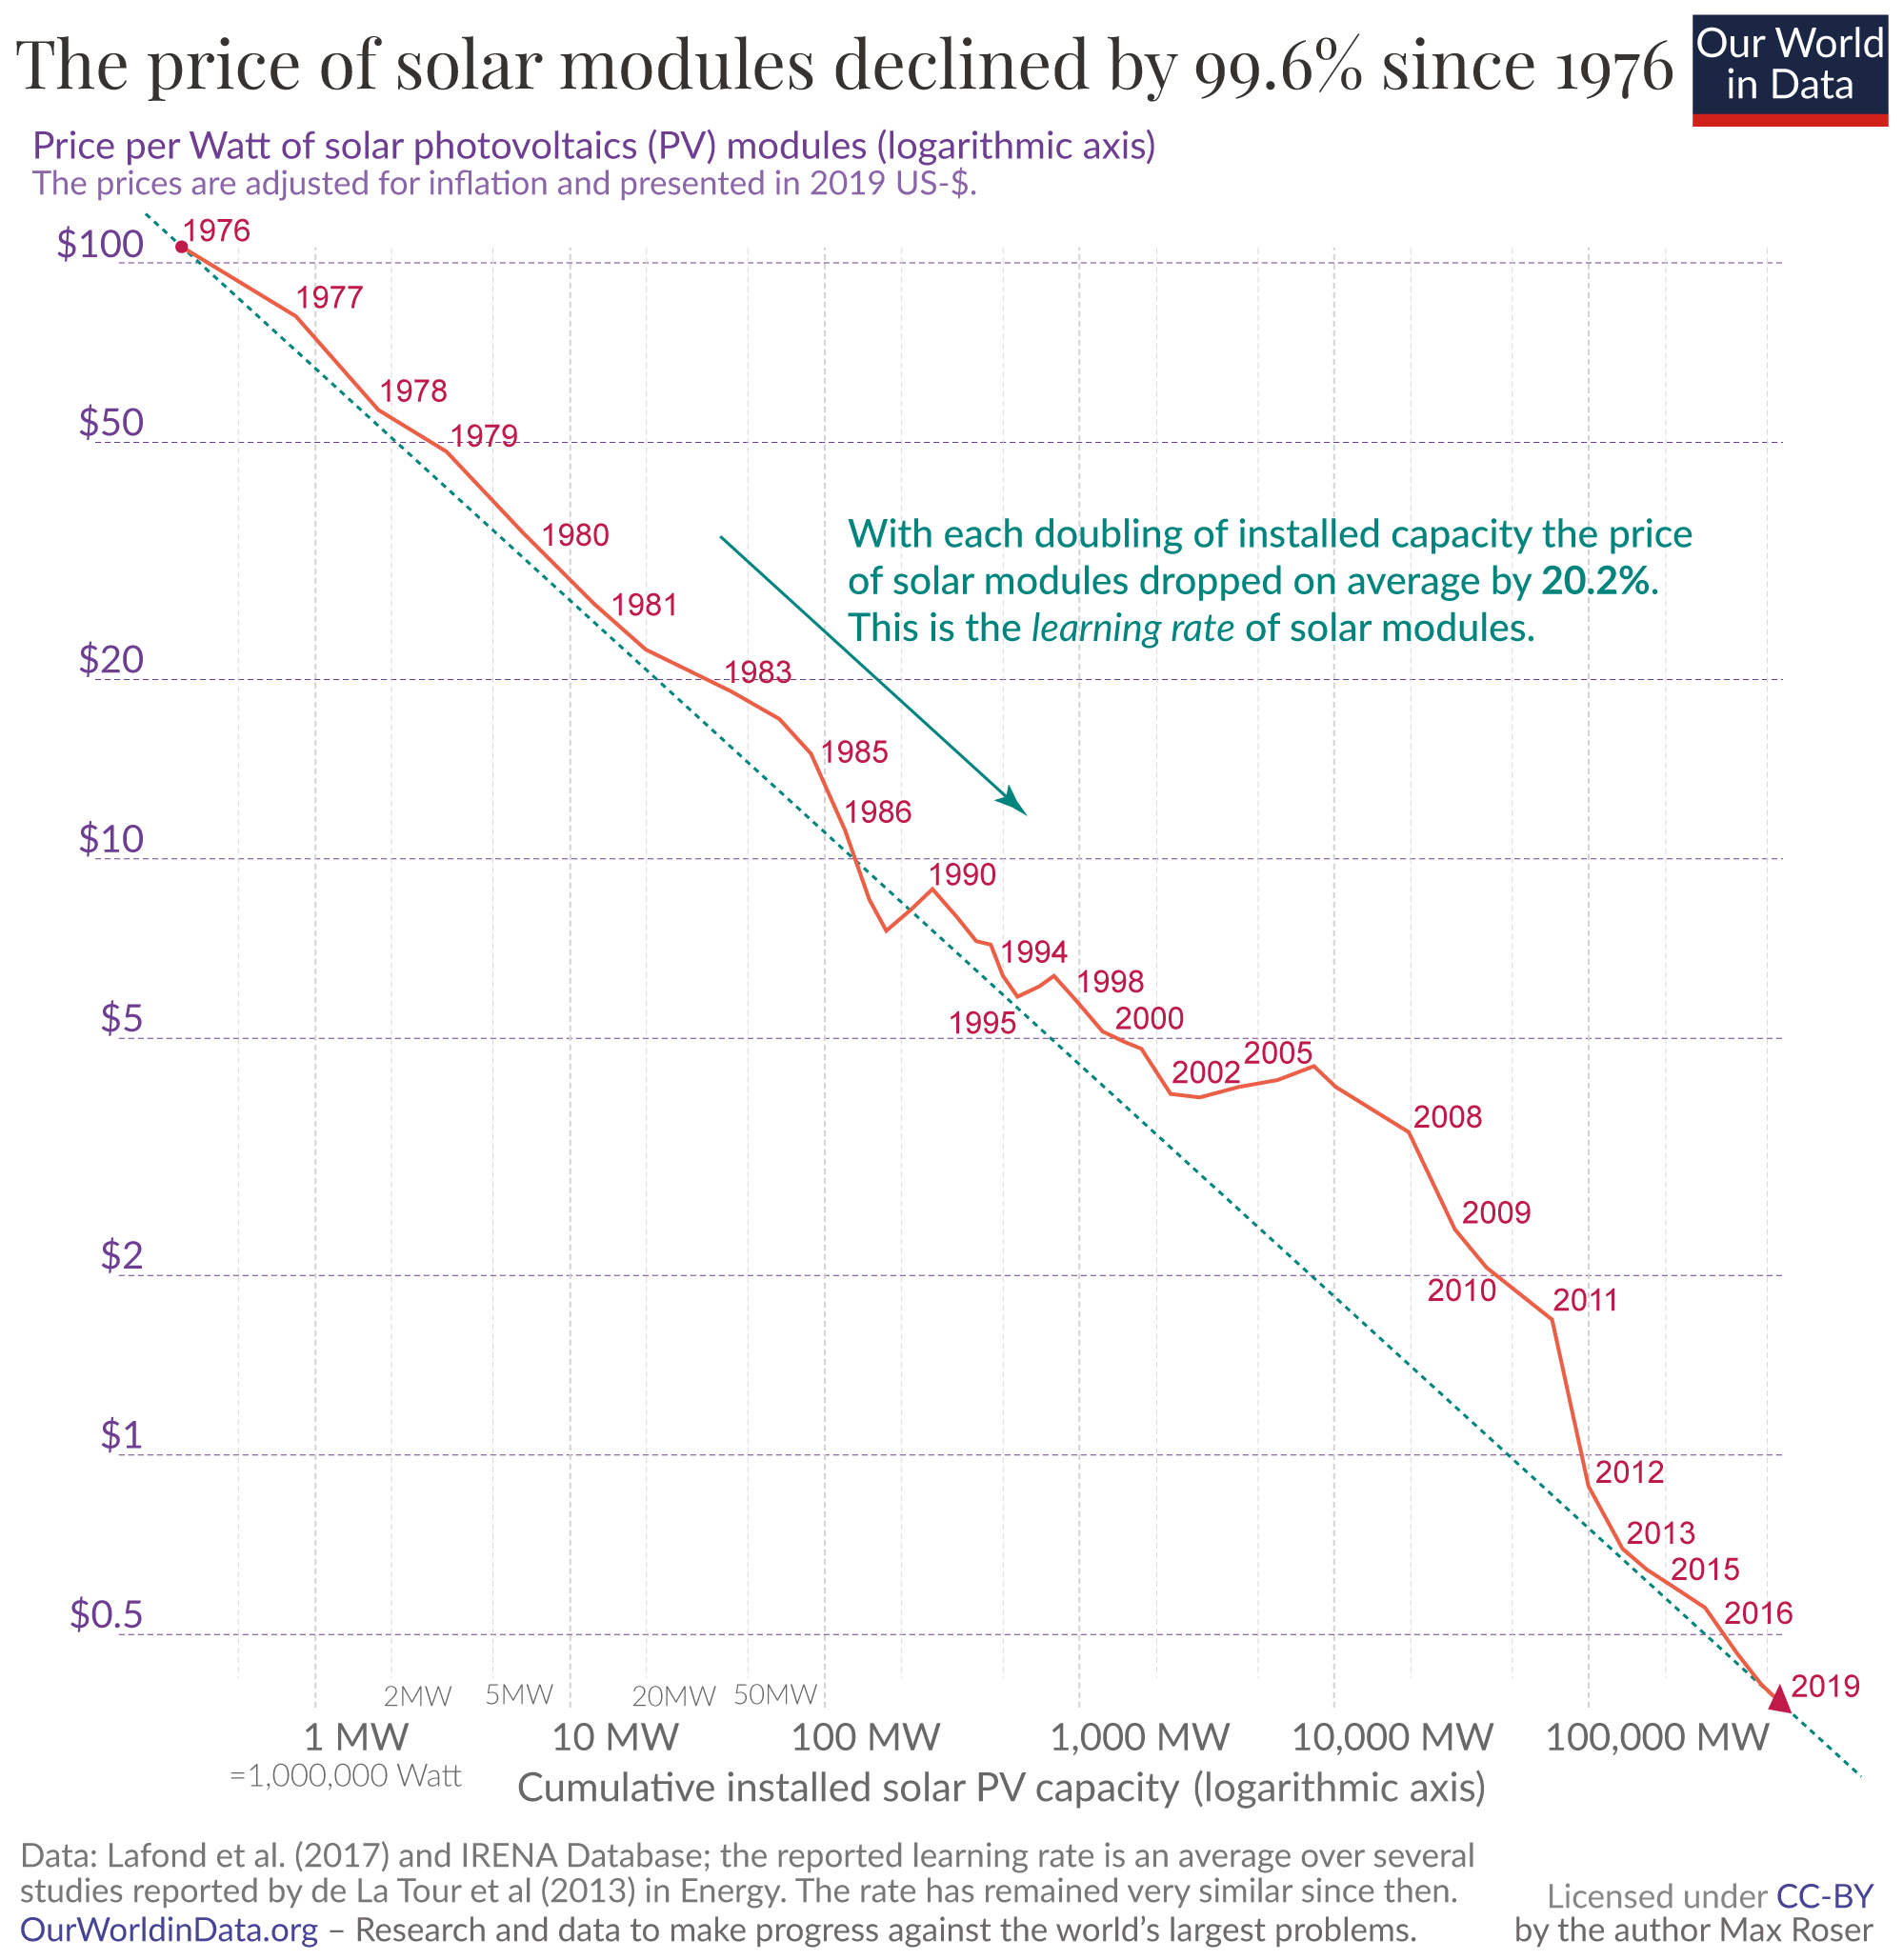
Solar panels used to be among the most expensive of all energy resources, but advances in technology and increasing demand have drastically decreased the cost of solar panels (Figure 3C.5.3). Solar energy is now the cheapest energy source, with wind energy a close second. A comparable price decrease is seen for lithium batteries used in energy storage.
Check your understanding: Solar Power
A list of energy resource characteristics is provided on the right-hand side. Drag and drop the characteristics that correspond to solar energy advantages (top) and disadvantages (bottom) on the left-hand side. Note: Not all of the characteristics apply to solar energy and therefore not all will be used!
References
Roser, M. (2020). Why did renewables become so cheap so fast? Our World in Data. https://ourworldindata.org/cheap-renewables-growth
U.S. Energy Information Administration (EIA). (n.d.). Photovoltaics and electricity https://www.eia.gov/energyexplained/solar/photovoltaics-and-electricity.php
Lakshman, S. (n.d.). More critical minerals mining could strain water supplies in stressed regions. World Resources Institute. https://www.wri.org/insights/critical-minerals-mining-water-impacts
