4. Wind Powered Electricity
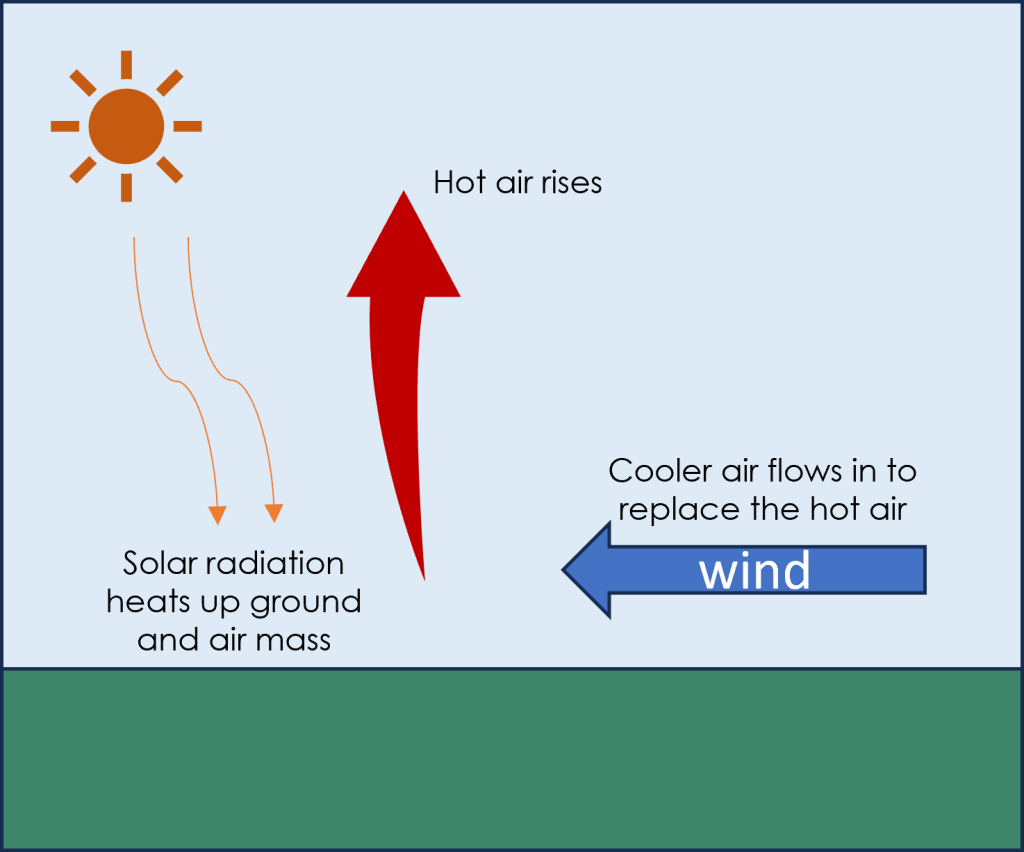
Air masses move from areas of high to low pressure, which are generated by unequal heating and cooling of Earth’s surface. Where air temperatures are hotter the air rises, and cooler air moves in to replace it (Figure 3C.4.1). This movement of air masses is felt as wind and this can happen on very large scales, such as the creation of the trade winds discussed in Chapter 3A.3, or on smaller, regional scales.
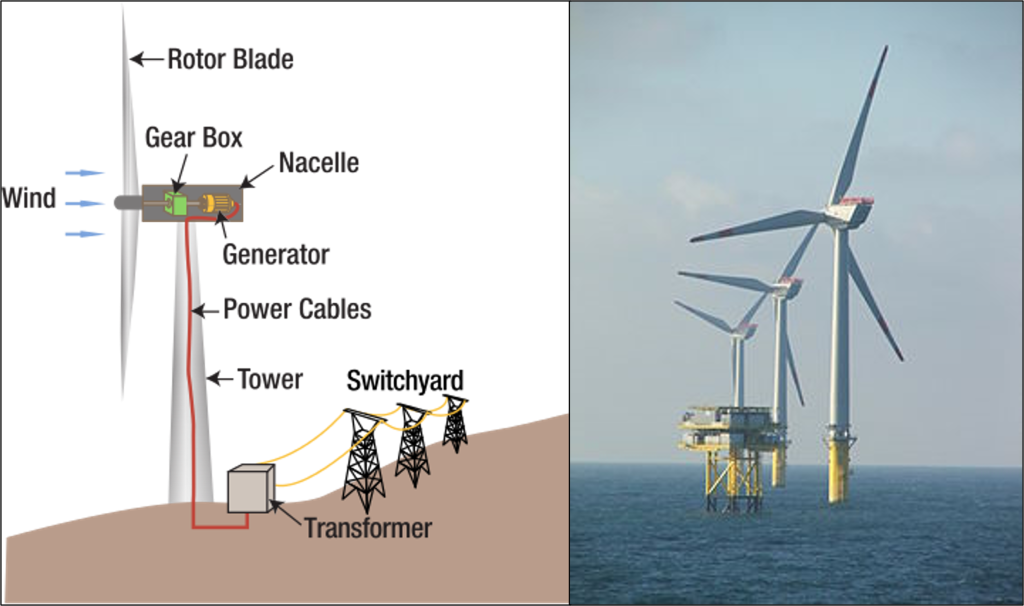
Wind energy technologies capture the power of moving air by using it to rotate the blades on wind turbines, which are connected to a generator to create electricity (Figure 3C.4.2).
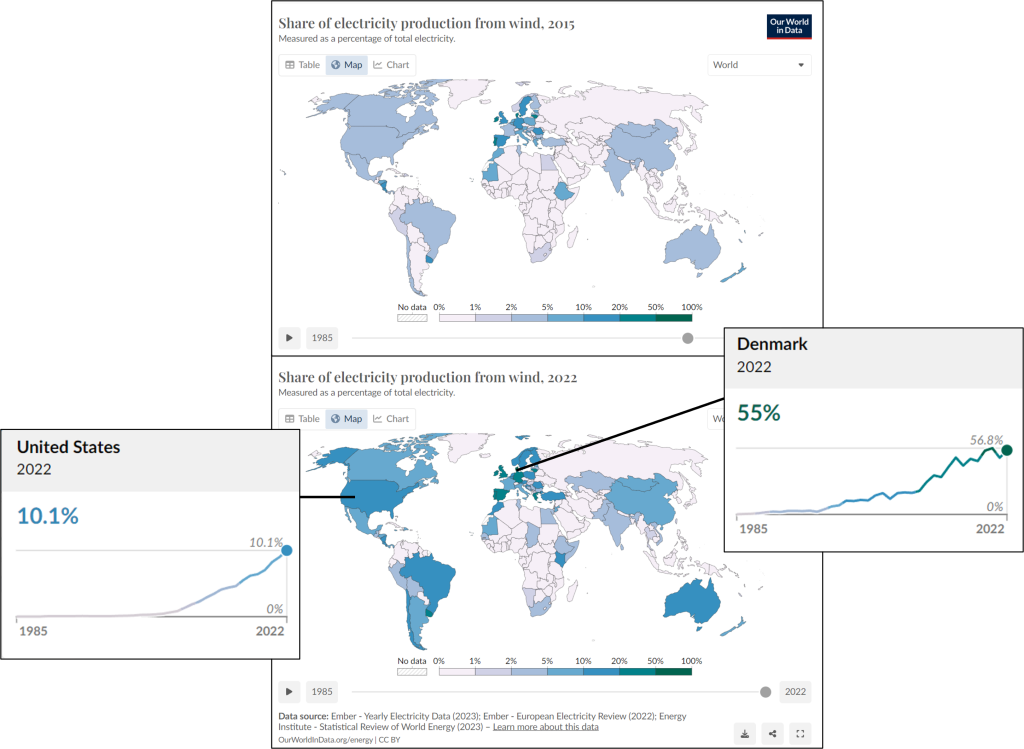
Wind energy is among the fastest growing renewable energy sources (solar is the fastest growing), supplying 7.5% of global electricity in 2022, up from 3.5% in 2015 (Figure 3C.4.3). Wind power has grown in the U.S. to be 10.1% of electricity production in 2022. The world leader in wind power is Denmark, producing 55% of its electricity from the wind.
The rise in wind power is due to a number of factors including that wind farms can be established relatively quickly, particularly when compared with building a new nuclear or fossil fuel power plant. The cost of wind energy has also decreased rapidly over the past decade making it one of the cheapest forms of energy, and it can be used almost anywhere in the world as wind is present everywhere. However, carefully looking at normal wind speeds in areas when planning where to locate a wind farm can increase the efficiency of wind energy collection as there are optimal speeds under which wind turbines operate. They are a bit like Goldilocks in that if the wind is too slow the cannot produce energy and if the wind is too fast turbines will shut down to avoid getting damaged – these are called the “cut-in” and “cut-out” speed, respectively. They like the wind to be “just right”. The speeds at which wind turbines operate are typically between 4 and 25 meters per second (between 8 and 55 mph), depending on the wind turbine design.
Onshore wind turbines have a capacity of 3-4 MW while offshore turbines have a capacity of 8-12 MW. This capacity is determined based on the size of the turbine and the length of its blades. Larger turbines with longer blades can capture more energy. For wind energy to be captured at sufficient levels, an array of turbines must be used, this is called a wind farm. Onshore wind farms typically have 50 or more turbines creating capacities of anywhere from 100 to over 600 MW. The largest onshore wind farm in the world is in China and as of 2021 had a capacity of 10 GW (10,000 MW), but still has more phases in its development. Its final capacity will be 20 GW generated from 7,000 turbines!
Offshore wind turbines have several advantages over onshore turbines. Winds blow harder and more consistently offshore and offshore turbines can be built taller and bigger allowing offshore turbines to generate more electricity.
Offshore wind energy is still in its infancy in the United States, with only 2 operational offshore wind farms as of 2024 totaling 42 MW of capacity. However, there are plans to increase offshore wind capacity in the U.S. to 22 GW by 2030 and up to 86 GW by 2050. The largest single offshore wind farm is off the northeast coast of England with a capacity of 3.6 GW.
Offshore wind turbines are placed anywhere from just a couple of kilometers to many tens of kilometers offshore, determined in large part by sea floor depth. These turbines are typically installed in water depths of 30-60 meters. This placement has some advantages and disadvantages relative to onshore wind.
One of the issues often cited for onshore wind is the low-level noise pollution made by the turbines. At a distance of 300 m (usually the minimum distance a wind farm is located from a residence), the noise from a utility scale wind turbine is 35-45 decibels (dB). This is slightly quieter than a refrigerator (about 50 dB) and much quieter than urban road traffic (70 dB). This noise pollution is considered when finding suitable locations for wind farm development. Offshore windfarms are typically far enough that an offshore turbine cannot be heard at all onshore. For their part, offshore turbines are 10-20 dB quieter underwater than ship noise. Like other anthropogenic noise sources, noise pollution from wind turbines can also affect wildlife. In addition, impact injuries to birds and bats from flying into turbine blades also occur. While most studies indicate collision rates are low, ranging from 0-9 birds and 0-43 bats per year per turbine, which are lower than other human impacts like windows and domestic animals on these populations, even low rates can be detrimental for rare or slow maturation species. For these reasons, some scientists are pushing for the effects of turbines on wildlife (noise and impact injuries) to be considered as part of the planning and permitting process for wind farms.
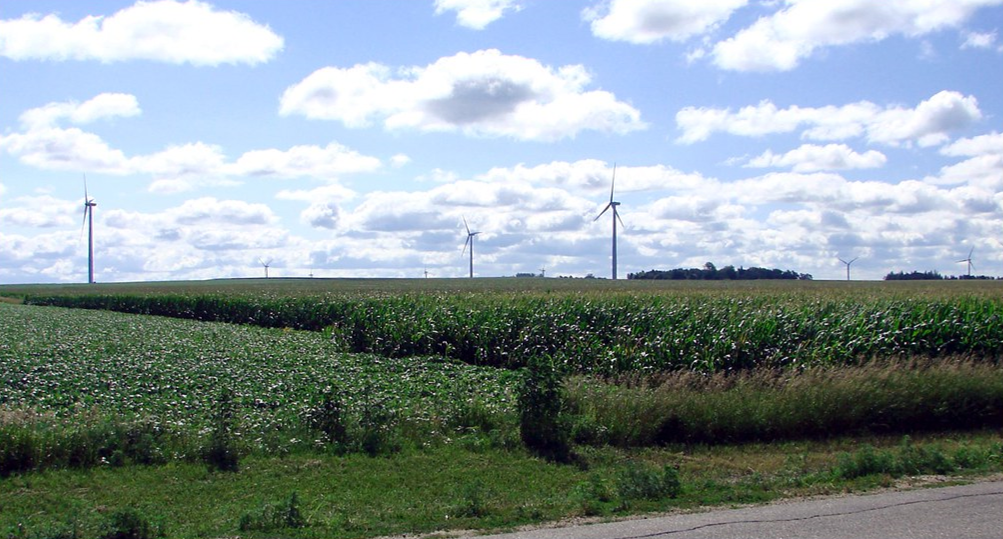
Another advantage of offshore wind is there is no need for land space. Spacing requirements for wind turbines mean large wind farms require a lot of land space. A single wind turbine may need 20-70 acres of land depending on its size to not interfere with a neighboring turbine. However, unlike other energy sources, the entirety of this land area does not need to be dedicated solely to energy production. The land space underneath the turbines can still be used to graze cattle, grow crops, etc. The wind turbine itself only requires ½ to 1.5 acres of land, meaning over 95% of the land can be used for other purposes. Many wind farms in the central U.S. are in agricultural areas where land is co-used for wind and agriculture (Figure 3C.4.4).
Offshore wind is at a disadvantage relative to onshore wind when it comes to costs and energy transmission. Installing wind turbines offshore is more difficult and the wind turbines themselves are larger, both of which mean the cost of offshore wind is higher. Adding further challenges and expense, the electricity generated at an offshore turbine must be brought onshore through power cables anchored to the ocean floor. Other offshore technologies like wave energy converters and tidal stream generators face this same difficulty.
Regardless of where the wind turbines are located, the electricity generated from them is renewable and no greenhouse gases are generated during electricity production. As with other energy sources, greenhouse gases are generated during construction of the turbines and extraction of raw materials to make turbines. The challenge facing the future of wind energy is what will happen to the turbine blades when they reach the end of their lifespan. The lifespan is about 20-30 years, which means the first major wave of wind turbines are just now reaching this point. Most of the components in a wind turbine are recyclable, however a major component in the blades is fiberglass, which is hard to recycle. Efforts to reduce the waste impact from turbine blades are focusing on making blades from alternative materials, repurposing the fiberglass for other building materials, or re-using the blade in its entirety in interesting ways, such as bike sheds in Denmark or noise barriers for highways.
References
Broadbent, H. (2023, April 17). Wind Power | Ember. Ember. https://ember-climate.org/topics/wind/
Drewitt, A. L., & Langston, R. H. W. (2006). Assessing the impacts of wind farms on birds. Ibis, 148(s1), 29–42. https://doi.org/10.1111/j.1474-919x.2006.00516.x
Ritchie, H., Roser, M., & Rosado, P. (2024, March 11). Renewable energy. Our World in Data. https://ourworldindata.org/renewable-energy
Teff‐Seker, Y., Berger‐Tal, O., Lehnardt, Y., & Teschner, N. (2022). Noise pollution from wind turbines and its effects on wildlife: A cross-national analysis of current policies and planning regulations. Renewable & Sustainable Energy Reviews, 168, 112801. https://doi.org/10.1016/j.rser.2022.112801
United Nations Economic Commission for Europe (2022). Carbon Neutrality in the UNECE Region:
Integrated Life-cycle Assessment of Electricity Sources. https://unece.org/sites/default/files/2022-04/LCA_3_FINAL%20March%202022.pdf
WINDExchange: Offshore Wind Energy. (n.d.). https://windexchange.energy.gov/markets/offshore
