1. Overview of Energy Resources

Energy resources are broadly divided into two categories: non-renewable and renewable resources. Non-renewable energy resources require hundreds to millions of years to form, which means they get used at a far faster rate than they can be replaced. Non-renewable energy includes coal, oil, natural gas, and nuclear energy. Renewable energy resources can be replenished anywhere from immediately to within months or years depending on the resource type. Renewable energy resources include biomass, solar, wind, geothermal, hydroelectric, wave, and tidal energy.

Pie Chart showing U.S. energy consumption by sector in 2022. Electricity production: 33%, Transportation: 24%, Industrial: 23%, Residential: 11%, Commercial: 8%
Figure 3C.1.1 Graph of U.S. energy consumption by sector for 2022. Source: Lindsay Iredale (2024). CC BY-4.0. Made using data from U.S. Energy Information Administration (2023). Public Domain. Found here.

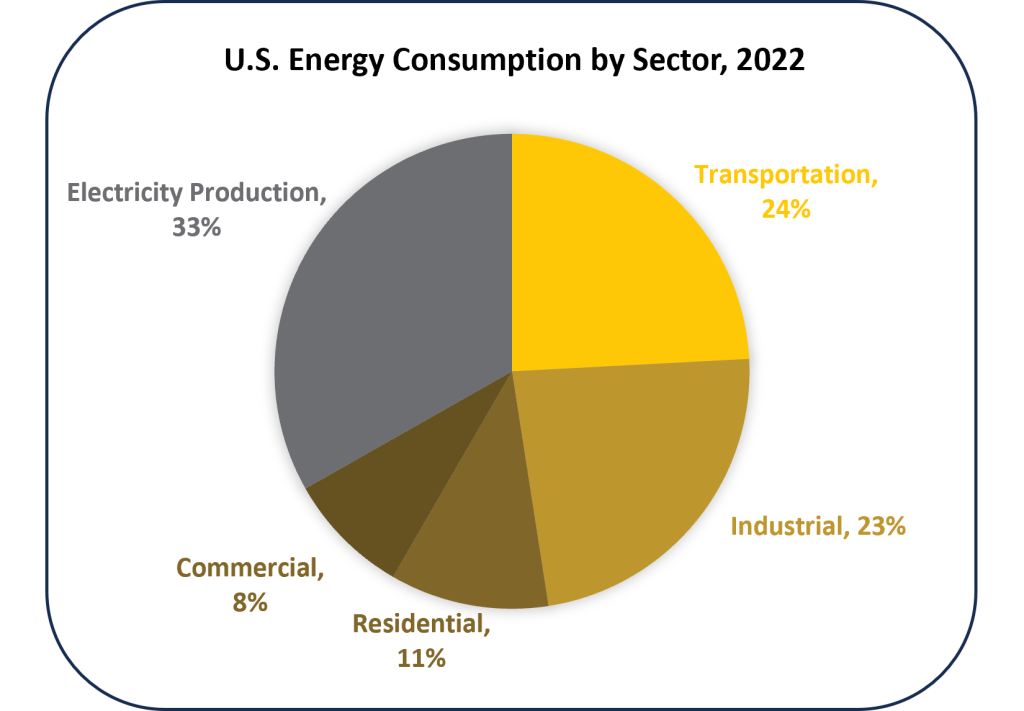
The main sectors that use energy are electrical power, transportation, industrial, residential, and commercial. Within the U.S., the electricity production, which is ultimately sold for use in the other sectors, is the largest portion of energy consumption followed by transportation and industrial consumption, which are roughly equal, then residential and commercial consumption (Figure 3C.1.1).

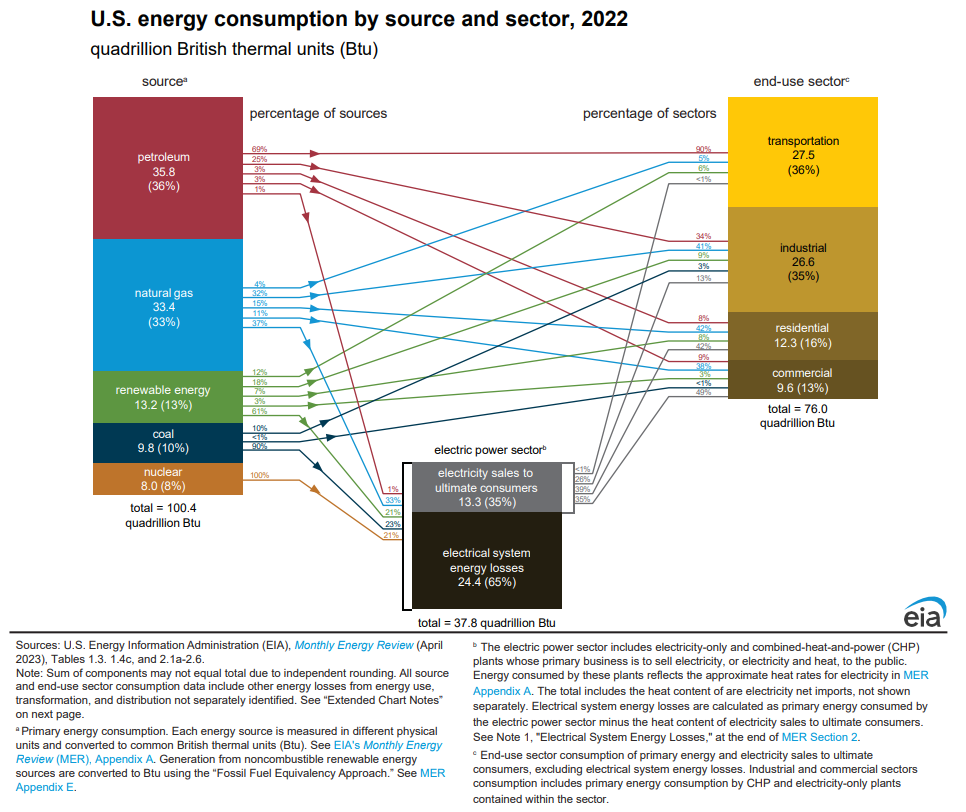
The make-up of the energy sources (i.e., the percentage of coal, natural gas, renewables, etc.) varies based on sector. For example, the transportation sector is dominated by the direct use of petroleum with minimal direct use of natural gas or renewables, and no direct use of coal or nuclear. There is a small portion of electricity used by transportation, which means natural gas, renewables, coal, and nuclear are used indirectly in transportation through this route (Figure 3C.1.2).

Electricity in the U.S. uses relies heavily on fossil fuels but very little is petroleum, with natural gas and coal making up more than half of all electricity consumed; roughly 57% of electricity in the U.S. was from fossil fuels in 2022. Nuclear energy contributes 21 % and all renewable sources combined contribute the remaining 21% (Figure 3C.1.2).

Energy Sources:Petroleum: 36% of sources 69% of the petroleum goes to the Transportation Sector 25% of the petroleum goes to the Industrial Sector 3% of the petroleum goes to the Residential Sector 3% of the petroleum goes to the Commercial Sector 1% of the petroleum goes to the Electric Power Sector Natural Gas: 33% of sources 4% of the natural gas goes to the Transportation Sector 32% of the natural gas goes to the Industrial Sector 15% of the natural gas goes to the Residential Sector 11% of the natural gas goes to the Commercial Sector 37% of the natural gas goes to the Electric Power Sector Coal: 10% of sources No coal goes to the Transportation Sector 10% of coal goes to the Industrial Sector No coal goes to the Residential Sector <1% of coal goes to the Commercial Sector 90% of the petroleum goes to the Electric Power Sector Renewable Energy: 13% of sources 12% of the renewable energy goes to the Transportation Sector 18% of the renewable energy goes to the Industrial Sector 7% of the renewable energy goes to the Residential Sector 3% of the renewable energy goes to the commercial Sector 61% of the renewable energy goes to the Electric Power Sector Nuclear Electric Power: 8% of sources 100% of the nuclear electric power goes to the Electric Power Sector Electric Power Sector (this is identified as a middle step from energy source to end use consumption) Within electric power the breakdown by source is (adding to 100%): 1% of the energy used in this sector comes from petroleum 33% of the energy used in this sector comes from natural gas 23% of the energy used in this sector comes from coal 21% of the energy used in this sector comes from renewable energy 21% of the energy used in this sector comes from nuclear Of the electricity generated, 35% is sold to the end use sectors and 65% is as electrical system energy losses Energy Consumption by Source (these are the final energy usage sectors, which use energy sources directly, but also use energy produced in the electric power sector; percentages for consumption between these 4 end use sectors adds to 100%) Transportation: 36% of all energy consumption 90% of the energy used in this sector comes from petroleum 5% of the energy used in this sector comes from natural gas 6% of the energy used in this sector comes from renewable energy <1% of the energy used in this sector come from the electric power sector Industrial: 35% of all energy consumption 34% of the energy used in this sector comes from petroleum 41% of the energy used in this sector comes from natural gas 3% of the energy used in this sector comes from coal 9% of the energy used in this sector comes from renewable energy 13% of the energy used in this sector come from the electric power sector Residential: 16% of all energy consumption 8% of the energy used in this sector comes from petroleum 42% of the energy used in this sector comes from natural gas None of the energy used in this sector comes from coal 8% of the energy used in this sector comes from renewable energy 42% of the energy used in this sector come from the electric power sector Commercial: 13% of all energy consumption 9% of the energy used in this sector comes from petroleum 36% of the energy used in this sector comes from natural gas <1% of the energy used in this sector comes from coal 3% of the energy used in this sector comes from renewable energy 49% of the energy used in this sector come from the electric power sector
Figure 3C.1.2 U.S. energy consumption by source and sector, 2022. The left-hand side shows energy sources with labeled arrows showing percentage of energy from that source going towards electricity production, transportation, industrial, residential, and commercial. Note that while electric power sector is its own sector, it also supplies energy to the other 4 sectors. Note: rounding may mean some percentages do not add to 100% on this chart. Source: U.S. Energy Information Administration (2023). Public Domain. Found here.

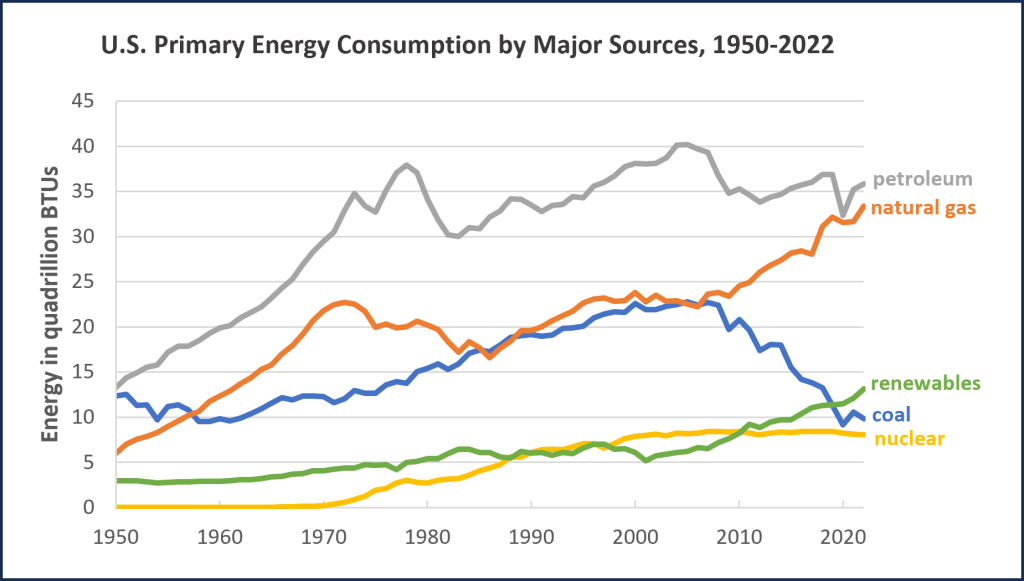
The two figures above provide a snapshot of energy consumption in 2022, but it is also useful to view the changing trends in energy sources over time. Figure 2C.1.3 shows how the various sources of U.S. energy have changed from 1950 through 2022. Coal usage reached a peak in the early 2000s and has declined since then, but this is not because coal energy was replaced with renewables. Instead, there has been a strong shift towards a different fossil fuel, and natural gas has mostly replaced coal energy, resulting in the rapid rise of natural gas consumption from the late 2000s through today. Nuclear energy only began in the late 1950s but remains low relative to the other non-renewable energy sources, although larger than any individual renewable source, which are combined and shown as a single line on this graph. An increase in renewable energy has replaced some of the declining coal energy and this has come mainly from an increase in wind and solar sources. The trend of coal consumption declining and being replaced by natural gas and renewables is projected to continue.

Graph showing changes in major sources of energy consumption through from 1950 to 2022. Use of petroleum and natural gas increased steadily from 1950 through the 1970s (both starting around 13 quadrillion BTUs and rising to 37 BTU for petroleum and 23 quadrillion BTUs for natural gas), dropping through the early 1980s before rising again. Petroleum reached a high in the early 2000s (around 40 quadrillion BTUs)and has decreased since then. Natural gas usage on the other hand, stayed relatively steady through the 1990s to 2000s before rising sharply and continuously from 2010s through the present day high of about 33 quadrillion BTUs. Coal usage started out more slowly, remaining relatively constant (10-12 quadrillion BTUs) through the 1950s into the late 1970s before rising slowly to reach peak usage in the early 2000s of about 23 quadrillion BTUs. Coal has slowly declined since that time and is currently at its lowest usage since the 1950s and 1960s around 10 quadrillion BTUs. Nuclear energy was not in use at all in the U.S. until the late 1950s and then started to rise very slowly through the 1970s levelling off at its current usage around 2000 of 8 quadrillion BTUs. Renewables were rough 3 quadrillion BTUs in 1950 and slowly rose to remain between 5-6 quadrillion BTUs from the 1970s through early 2000s. Since the late 2000s renewables have been steadily rising up to the current high of 14 quadrillion BTUs.
Figure 3C.1.3 U.S. energy consumption by energy source from 1950 – 2022. Source: Lindsay Iredale (2024). CC BY-4.0. Made using data from EIA (2022). Public Domain. Found here.

While the share of U.S. energy production from renewable energy is growing, its current share at 13% in 2022 of total U.S. energy consumption is slightly higher than the global average of 12.3% in 2022, it is still far below the European average of 22.5% in 2022. Iceland is the single top user of renewable energy in Europe and the world with close to 90% of its total energy from renewables, namely hydroelectric and geothermal (Figure 3C.1.4). Of this, close to 100% of electricity and heating are from renewables and the main use of non-renewable energy is as transportation fuels.

Bar chart showing the percentage of renewable energy used by European countries. Iceland has almost 90% and Norway has 75%. Sweden is third with 65%. All other European countries are between 12 and 45% with an average for all of Europe being 22%
Figure 3C.1.4 Share of total energy from renewable sources for European Union countries for 2021 and 2022. Iceland and Norway are the European leaders in renewable energy. Source: European Environment Agency (2022). CC BY-4.0. Found here.

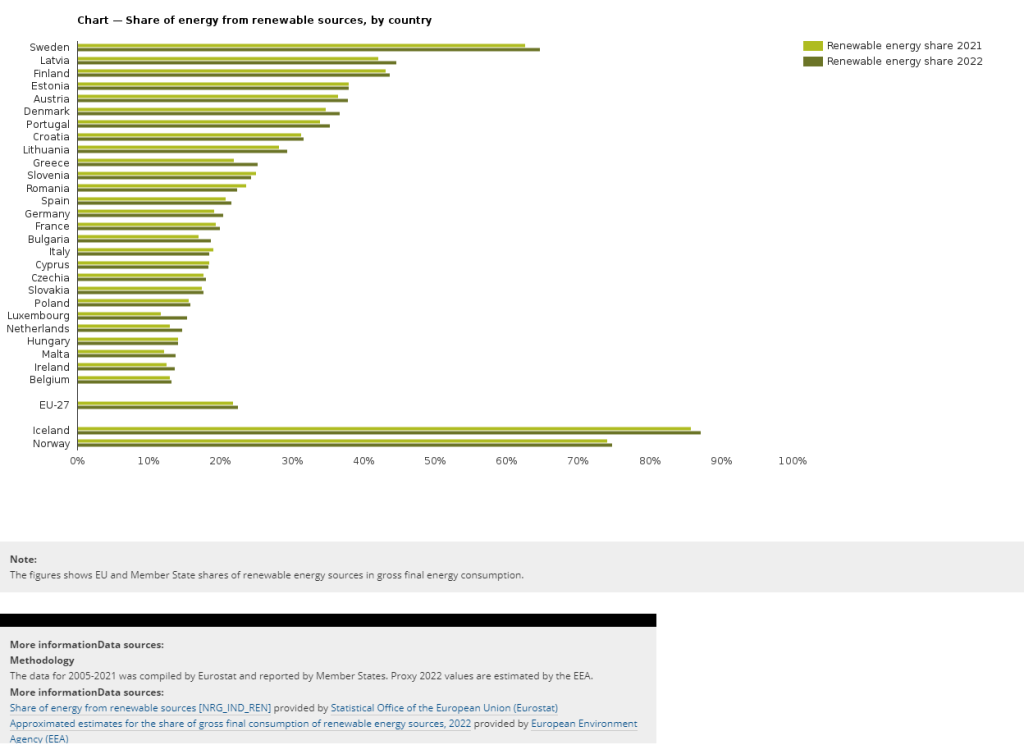
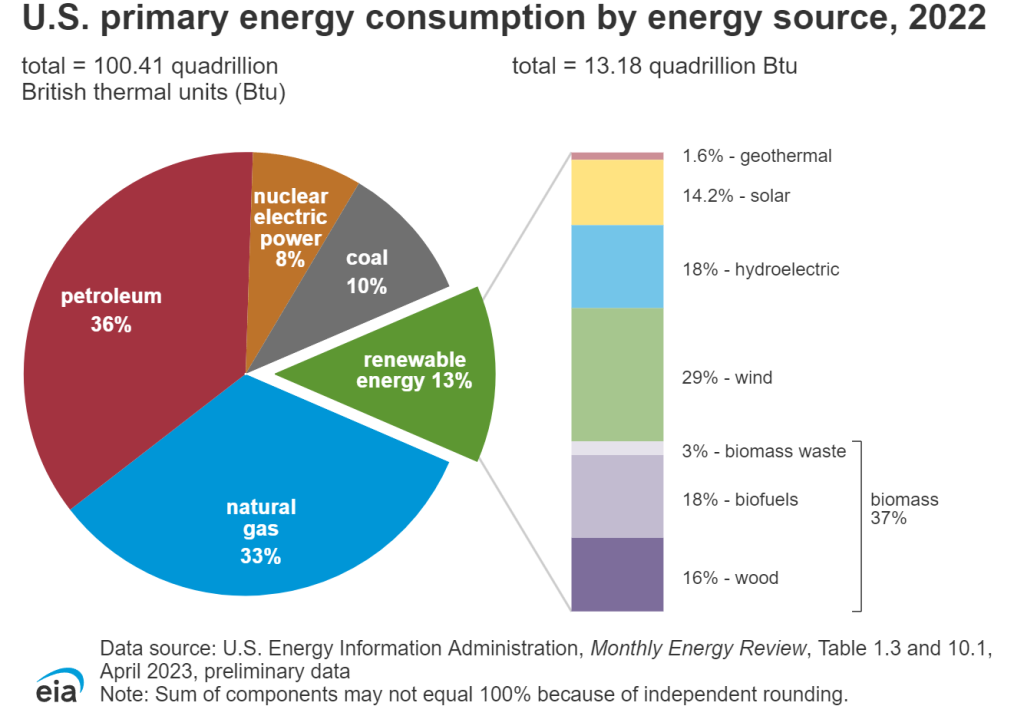
Figure 3C.1.5 shows the breakdown of energy resources used in the United States in 2022, with the share of each renewable energy type depicted as well. Biomass and wind energy are the most used renewable sources in the U.S. at 37% and 29%, respectively, of renewable energy.

Pie chart of U.W. primary energy consumption by energy source for 2022: Petroleum 36%, Natural gas 33%, nuclear 8%, coal 10%, renewables 13%. Renewables are expanded to show amounts of each making up the total renewables energy source: Biomass 37%, wind 29%, hydroelectric 18%, solar 14.2%, and geothermal 1.6%.
Figure 3C.1.5 U.S. primary energy consumption by energy source, 2022. Source: EIA (2023). Found here.

As a major driver of climate change, human combustion of fossil fuels is a focus for any climate change mitigation plan. Within the energy sectors, the ability to increase electrification in all sectors (i.e., increase electric vehicles thereby reducing direct consumption of petroleum in transportation, increase electrification of heat thereby reducing direct consumption of natural gas, etc.) combined with reducing fossil fuel usage in electricity production will have a major impact on human carbon emissions. For this reason, the remainder of this chapter provides background on these resources and compares and contrasts their impacts with respect to electricity production specifically.

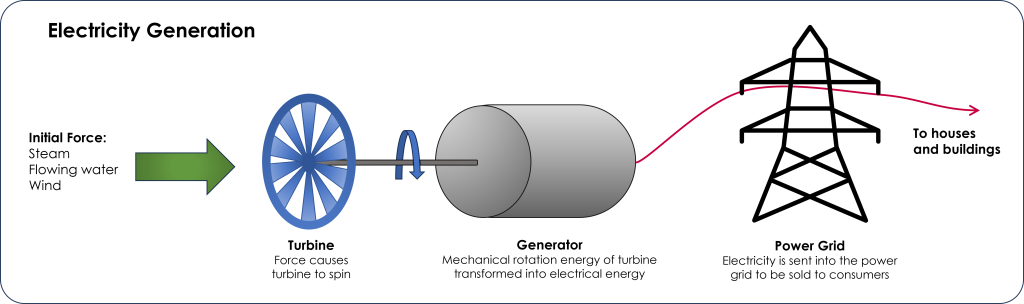
Regardless of the energy source used, production of electricity follows a similar process for most conventional (i.e., fossil fuel) and non-conventional (i.e., renewable) energies. The process begins with a force like flowing water, wind, or pressurized steam, which passes through a turbine causing it to spin. This transfers energy to a generator, which transforms the mechanical rotational energy from the turbine into electrical energy. The electrical energy is then passed onto the electrical grid and eventually into homes and businesses (Figure 3C.1.6). The source of the initial force is where most of the changes occur when discussing different energy resources. Pressurized steam, made by heating water to the point of boiling, is common to several energy types. The heat used to produce steam can be generated through combustion of coal, natural gas, or biomass, through fission reactions in a nuclear reactor, or harnessed from the Earth in geothermal energy. The energy in flowing water drives the turbine in hydroelectric and tidal energy. For wave energy, the movement of flowing water drives a hydraulic piston instead of a turbine. In wind power, flowing air drives the turbine. Photovoltaic solar energy (i.e., solar panels), skips the turbine step completely as the solar panels themselves are generators turning solar radiation directly into electrical energy.

Flow chart of electricity generation as described in the text
Figure 3C.1.6 Flow chart of electricity generation. Lindsay Iredale (2024). CC BY-4.0.

References

U.S. Energy Information Administration (EIA) (n.d.) U.S. energy facts explained – consumption and production. https://www.eia.gov/energyexplained/us-energy-facts/

International Energy Agency (IEA) (n.d.). Renewables – Energy System – IEA. https://www.iea.org/energy-system/renewable

License

Icon for the Creative Commons Attribution-NonCommercial-ShareAlike 4.0 International License

Environmental Geology Copyright © 2024 by Lindsay Iredale is licensed under a Creative Commons Attribution-NonCommercial-ShareAlike 4.0 International License, except where otherwise noted.

Share This Book