3. Early Paleogene Greenhouse
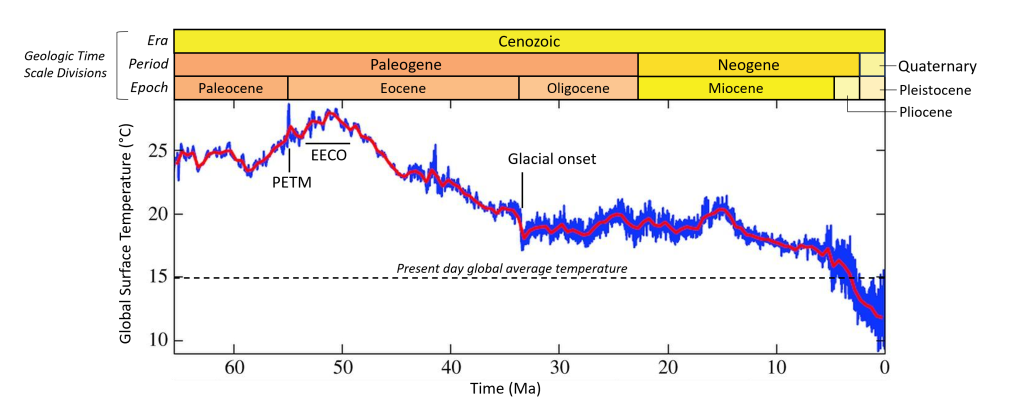
Following the Late Paleozoic Ice Age, climate warmed and was in a greenhouse state for all of the Mesozoic Era (i.e., age of the dinosaurs) and into the early Cenozoic Era. The extinction event at the end of the Mesozoic Era caused some climate fluctuations, but quickly returned to greenhouse conditions that persisted through the Paleocene (65.5 – 56 Ma) and Eocene (56 – 34 Ma) Epochs of the Paleogene Period, until glaciers began to grow on Antarctica at the start of the Late Cenozoic Ice Age. Average global temperatures during the latest Paleocene were about 7 to 13°C (13 to 23°F) warmer than today. Two particularly warm intervals, the Paleocene-Eocene Thermal Maximum (PETM) and the Early Eocene Climatic Optimum (EECO) stand out in this overall greenhouse climate (Figure 3B.3.1). During the PETM, temperatures rapidly increased an additional 5 to 10°C over the already warm late Paleocene temperatures. The EECO was 8 to 14°C warmer than today.
The Paleocene-Eocene Thermal Maximum is of particular interest because of the rapid warming that occurred and the ecological changes that ensued. The PETM was a brief, but intense time of warming that occurred approximately 55 million years ago. Average temperatures increased by 5 to 10°C over a period of 10,000 to 20,000 years and remained high for 100,000 to 200,000 years. Evidence suggests this short-lived warm pulse was triggered by a massive release of carbon into the atmosphere. Possible sources for the carbon include outgassing from eruptions of continental flood basalts and other igneous activity or release of methane from land sources such as wetlands and underwater sources such as methane clathrates. The exact source of this massive greenhouse gas release is an ongoing area of research.
During this time, the climate was much warmer and wetter leading to changes in habitat zones with subtropical flora living in polar regions. The PETM coincides with rapid changes in the location of flora species and the first appearances of many mammals, including the earliest known true primates, as well as the migration of many mammal species to Europe and North America.
Major changes took place in the oceans as well. To balance the massive influx of carbon to the atmosphere ocean uptake of carbon increased, creating more acidic ocean waters. The wetter climate changed rainfall patterns, bringing increased freshwater to the Arctic Ocean, and creating a stratified ocean with freshwater on the surface and saline deeper water. This led to changes in deep water ocean circulation and created widespread anoxic or low oxygen conditions in the ocean. These changes to ocean chemistry caused mass extinctions of mainly mid to deep water benthic foraminifera (benthic means bottom dwelling and foraminifera are microscopic, shelled ocean organisms).
While the PETM was warmer overall than today, the rate of warming and the ecological changes this drove are studied as the best analog for current warming on the planet. Calculations comparing present day carbon emission rates with those of the PETM indicate modern emissions are 9-10 times higher than those that led to the onset of the PETM. It took 10,000-20,000 years to accumulate the high greenhouse gas levels at the start of the PETM, but with current human carbon emissions, these same levels could be reached in just 140 to 259 years.
Check your understanding: Feedbacks and PETM
Apply your knowledge of climate forcing mechanisms and feedback loops to complete the feedback loop below about a possible source of greenhouse gases during the PETM.
References
Gingerich, P. D. (2006). Environment and evolution through the Paleocene–Eocene thermal maximum. Trends in Ecology and Evolution, 21(5), 246–253. https://doi.org/10.1016/j.tree.2006.03.006
Gingerich, P. D. (2019b). Temporal scaling of carbon emission and accumulation rates: modern anthropogenic emissions compared to estimates of PETM onset accumulation. Paleoceanography and Paleoclimatology, 34(3), 329–335. https://doi.org/10.1029/2018pa003379
Hooker, J. (1998, January 1). Mammalian faunal change across the Paleocene-Eocene transition in Europe. EurekaMag. https://eurekamag.com/research/019/366/019366419.php
McInerney, F. A., & Wing, S. L. (2011). The Paleocene-Eocene Thermal Maximum: A Perturbation of Carbon Cycle, Climate, and Biosphere with Implications for the Future. Annual Review of Earth and Planetary Sciences, 39(1), 489–516. https://doi.org/10.1146/annurev-earth-040610-133431
Pagani, M., Pedentchouk, N., Huber, M., Sluijs, A., Schouten, S., Brinkhuis, H., Damsté, J. S. S., & Dickens, G. R. (2006). Arctic hydrology during global warming at the Palaeocene/Eocene thermal maximum. Nature, 442(7103), 671–675. https://doi.org/10.1038/nature05043
Willard, D. A., Donders, T. H., Reichgelt, T., Greenwood, D. R., Sangiorgi, F., Peterse, F., Nierop, K. G., Frieling, J., Schouten, S., & Sluijs, A. (2019). Arctic vegetation, temperature, and hydrology during Early Eocene transient global warming events. Global and Planetary Change, 178, 139–152. https://doi.org/10.1016/j.gloplacha.2019.04.012
Wing, S. L., Harrington, G. J., Smith, F. A., Bloch, J. I., Boyer, D., & Freeman, K. H. (2005). Transient floral change and rapid global warming at the Paleocene-Eocene boundary. Science, 310(5750), 993–996. https://doi.org/10.1126/science.1116913
Zachos, J. C., Röhl, U., Schellenberg, S. A., Sluijs, A., Hodell, D. A., Kelly, D. C., Thomas, E., Nicolo, M. J., Raffi, I., Lourens, L. J., McCarren, H. K., & Kroon, D. (2005). Rapid acidification of the ocean during the Paleocene-Eocene thermal maximum. Science, 308(5728), 1611–1615. https://doi.org/10.1126/science.1109004
