5. Strategies for Reducing Water Quality Impacts
The key to lowering the negative impact on water quality from agricultural activities is to decrease the number of contaminants leaving farming operations. This can be achieved by either decreasing what is running off the landscape or decreasing what is put on the landscape to begin with.
5.1 Reduce water usage
The main way to decrease agricultural runoff and contamination is to control irrigation water use. Decreasing excess water put on the landscape means runoff will decrease. The methods for doing this are the same as those discussed in section 2 of this chapter about decreasing crop water use. Using an irrigation technique that is more water efficient will reduce irrigation water needs. Having healthy soil by using cover crops and conservation tillage will keep soil moisture higher and growing crops with water needs that more closely match the areas climatic conditions also lead to less need for irrigation water.
More technologically advanced water management techniques, such as using satellite data to predict rainfall events or using soil moisture monitoring probes can help farmers decide when and how much water to irrigate with. In addition, the timing of when irrigation occurs can help increase infiltration to the root zone and decrease immediate evaporation. Watering in the early morning or later afternoon/evening instead of during the peak heat of midday will reduce water lost to evaporation.
Any technique that reduces water usage will reduce the amount of soil, nutrients, manure, fertilizers, pesticides, and pathogens that run off agricultural fields.
5.2 Reduce open soil areas
In addition to keeping soil healthy and able to retain moisture, cover crops also help hold the soil in place. Open soil without roots is far easier to erode than soil being held in place by a robust root system. If open soil is a result of overgrazing, farmers can work to reduce this by actively planting cover crops, promoting revegetation, and better managing grazing activities by keeping herds smaller or rotating grazing fields on a more regular basis.
5.3 Riparian buffers
A riparian buffer (or stream buffer) is a vegetated strip of land beside a stream that helps protect the stream from surrounding land use (Figure 2C.5.1). These buffer zones intercept and filter out contaminants (nutrients, pesticides, soil, etc.) from agricultural runoff water and prevent them from entering the stream. There are several added benefits of riparian buffer zones. They stabilize eroding stream banks as sediment is held in place by the large root systems of the trees and shrubs. They also provide migration corridors and habitat for animals displaced by agricultural land.

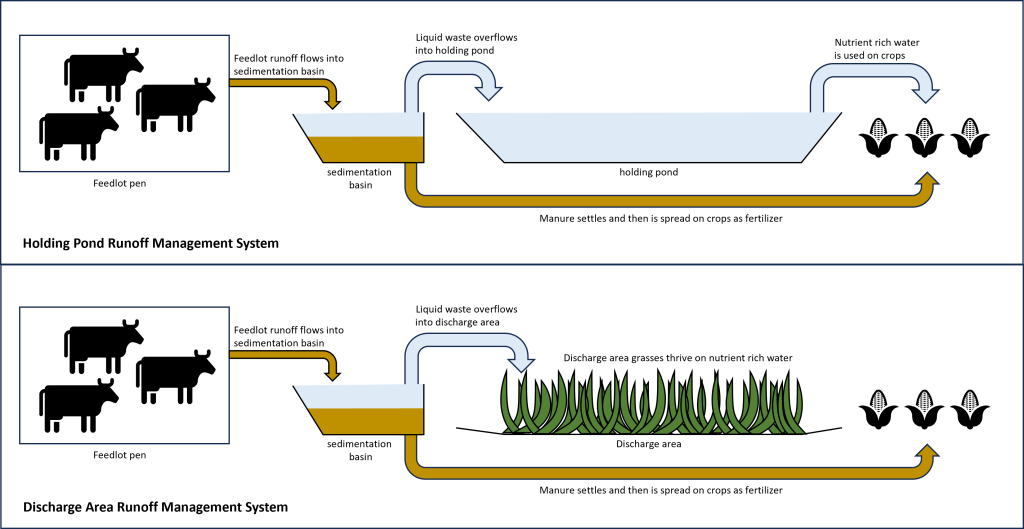
5.4 Feedlot management
The buildup of manure and urine in feedlots is a concentrated source of pathogens that must be managed properly to keep it from harming waterways. Properly designed and managed feedlots will collect all runoff that interacts with animal pens, including water used to clean pens, often into an initial sedimentation basin where the solid manure will settle out, and can then be applied to farm fields as fertilizer. The remaining liquid waste will flow out of this basin and either into a holding pond or a discharge area (Figure 2C.5.2). If a sedimentation basin is not part of the feedlot design, runoff water will flow directly from pens into the holding ponds or discharge areas. A holding pond stores the liquid waste, which is high in nitrogen, and ranchers use this to water crops being grown to feed the animals (Figure 2C.5.3). If the water is discharged, it is sent to a specially designed discharge area that is often seeded with grasses that quickly take up the nitrogen rich waters so as not to allow excess nutrients to enter waterways or infiltrate groundwater.
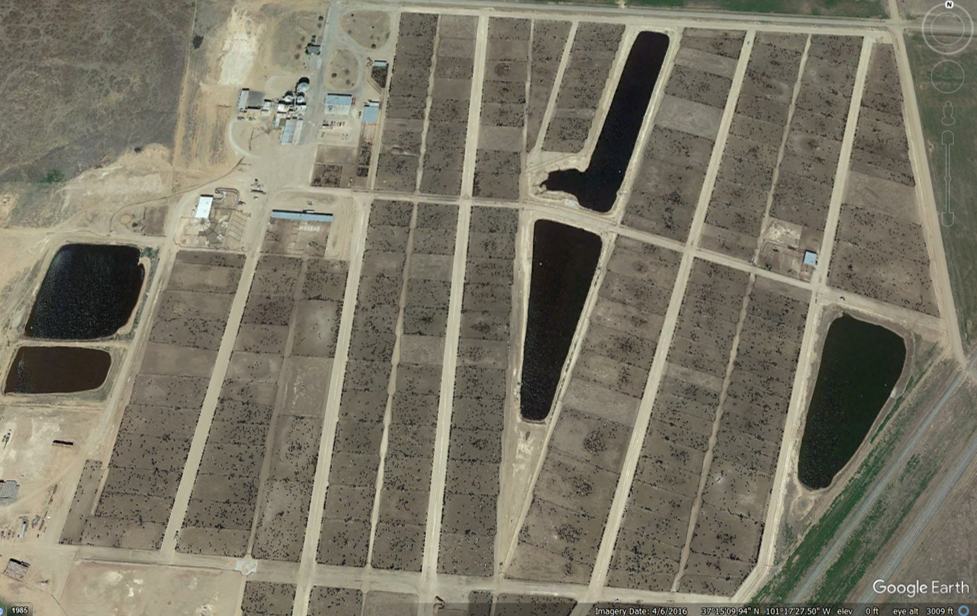
Other general design requirements for feedlots include diverting all other surface runoff away from animal pens and establishing feedlots away from surface water bodies.
5.5 Nutrient application management
Nutrient application is the general terminology for the application of added nutrients, mainly nitrogen and phosphorous, which are the major components in fertilizers and manure and vital to plant growth. As a general rule, any methods that lead to healthy soil, including cover crops and conservation tillage, help soil maintain appropriate nutrient levels.
For active application of nutrients, monitoring the nutrient levels present in soils and applying nutrients in the form of fertilizer or manure at appropriate levels and only when needed minimizes excess nutrients running off the landscape. Plants also need different amounts of nutrients at different points in their life cycle, so matching nutrient application amounts with life cycle stage is another key component in application management.
As previously discussed, different crops have different nutrient needs and some crops, like legumes, are nitrogen fixers. Utilizing cover crops that are nitrogen fixers will naturally introduce and keep nitrogen in the soil, decreasing the need for nutrient application. Because of the different nutrient needs of plants, if a single plant type is consistently grown in the same field (called monoculture) it will decrease certain nutrients in the soil over time leading to an increased need for fertilizers to get the same amount of crop yield from a field. Using a schedule of crop rotation, where farmers grow a series of different crops on the same field through a sequence of growing seasons, reduces soil nutrient depletion and suppresses weeds and harmful pests leading to decreased nutrient and pesticide application.
Biofuels and the Rise of Monoculture
Biofuels have been produced in the U.S. since the late 1970s however they had a boom in production starting in 2005 with the passage of the Energy Policy Act which established that certain volumes of renewable fuels, like bioethanol, replace petroleum-based transportation fuels, i.e., ethanol blended gasoline for cars. This new standard, combined with government subsidies for certain crops lead to a boom in corn production starting in 2005 (Figure 2C.5.4), as corn is the main biofuel crop in the United States. Subsequent additions to this act also increased biodiesel production for which soybeans are a major, and subsidized, crop. Soybean production has seen an increased rise starting around 2015.

While these fuel standards were put in place to help lower greenhouse gas emissions from fossil fuels and decrease American dependence on foreign oil, they also lead to increased monoculture. Approximately 75% of all agricultural land in the Midwest United States is dedicated to corn and soybean production. Across the country, approximately 40% of all corn is used as animal feed and 45% is used for bioethanol production. The percentage used in bioethanol production is higher in Midwest states. Iowa is the largest corn producer in the U.S. and since 2009 anywhere from 50% to 70% of all corn grown in the state has been used for ethanol production.
Check your understanding: Preventing water quality impacts from agricultural runoff
References
Iowa Farm Bureau, (2023). Ethanol Industry in Iowa and the U.S. https://www.iowafarmbureau.com/Article/Ethanol-Industry-in-Iowa-and-the-US
USDA Economic Research Service, (2023). Corn and other feed grains. https://www.ers.usda.gov/topics/crops/corn-and-other-feed-grains/feed-grains-sector-at-a-glance/
