4. Agricultural Impacts on Water Quality
Nonpoint source pollution is responsible for most water quality impairments and runoff from agricultural operations is a major source of nonpoint source pollution. Runoff from agricultural operations is the leading cause of water quality impacts on streams, second largest cause of impacts to wetlands, and third largest to lakes. It is also a major contributor to groundwater pollution. Reducing surface runoff can keep excess soil, nutrients, and fertilizers on farm fields instead of in lakes and rivers where they negatively impact both these freshwater bodies and the oceans they flow into. Using water more sustainably in agriculture often reduces the volume of surface water that runs off farm fields.
4.1 Agricultural Sources of Pollution
Excess water from agricultural areas reaches streams in a dispersed manner, flowing over the ground as well as through the subsurface. As it flows, it may pick up chemicals or manure that were applied to the crops, carry away exposed soil and the associated organic matter, and leach materials from the soil, such as salts, nutrients, or heavy metals.
Fertilizers and Other Nutrients
Chemical fertilizers, manure, and biosolids (treated sewage sludge) are used by farmers to add phosphorous, nitrogen, and potassium to agricultural fields. These are important nutrients for plant growth, but if the amount added exceeds plant needs, or if these are applied shortly before a large rain, they will wash off fields and into surface waters where they damage aquatic ecosystems.
Pesticides
Insects, weeds, fungus, and rodents (among others) can be detrimental to agricultural crops. To combat these pests, farmers apply various chemicals (insecticides, herbicides, fungicides, etc.) to fields. These are chemical poisons that can wash off farm fields and into aquatic ecosystems or seep into groundwater. Depending on the mode of application, these chemicals may also be airborne and drift with the wind to land in surface waters. Such is the case with aerial application, commonly referred to as crop dusting (Figure 2C.4.1).

Animal Feeding Operations
Animal feeding operations, or feedlots, are a mode of animal farming where the animals are kept and raised in confined areas on a small plot of land (Figure 2C.4.2). Feed, typically in the form of a mixture of roughage, grains, and supplements, is brought to the animals to help “fatten” them quickly rather than allowing them to graze naturally on grass. However, feedlot diets high in grain can promote the growth of harmful bacteria, such as E. coli, in animal digestive systems which is then expelled and present in manure. This method of animal farming concentrates manure and urine and if facilities are poorly managed, runoff will carry harmful pathogens as well as other solids and excess nutrients, like nitrogen, and contaminate waterways. Groundwater can also become contaminated if waste products seep into the ground.
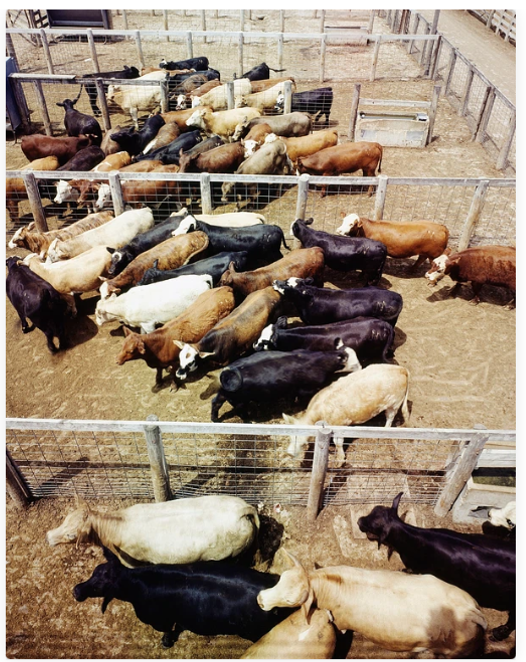
While feedlots are commonly associated with cattle, other animals such as pigs, chickens, turkeys, ducks, and sheep are also subjected to this intensive form of livestock farming.
Livestock Overgrazing
Grazing is an animal farming practice where animals are allowed to openly eat, or graze, on large grasslands and pastures. Overgrazing occurs when intensive grazing over an extended time happens in an area without allowing for sufficient plant recovery between grazing periods. This reduces plant cover and exposes bare ground leading to increased soil erosion by wind and water with this soil running off into waterways (Figure 2C.4.3).
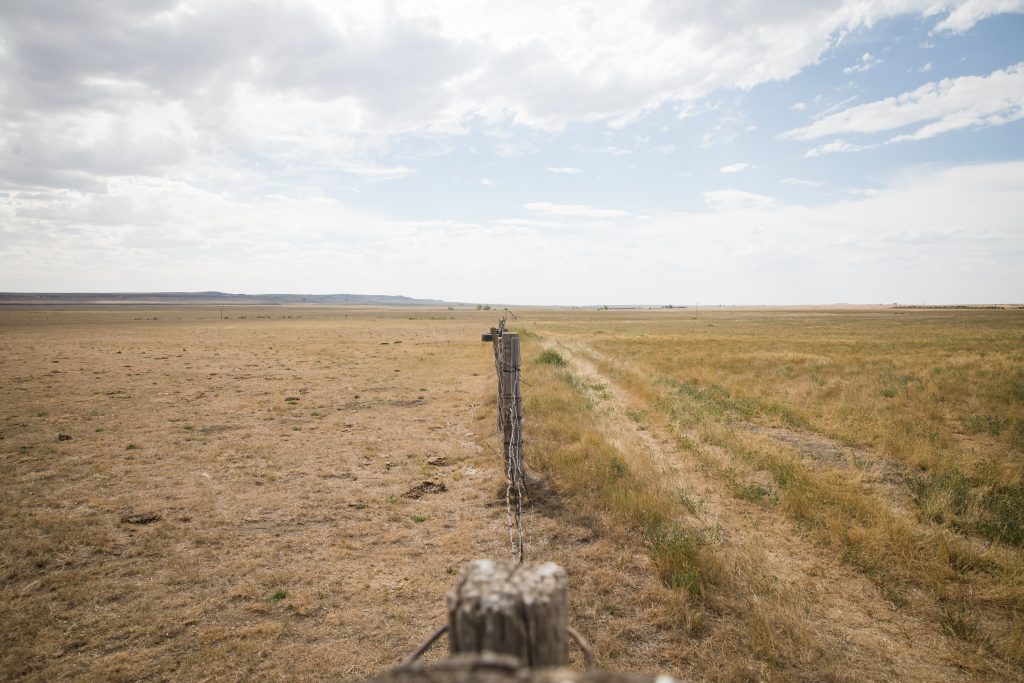
Open ground also increases soil temperatures and therefore evaporation rates. Fewer plants and root systems decrease soil health and can create a hard soil surface that reduces water infiltration. This leads to an increased need for irrigation water.
Overgrazing can be particularly harmful to native plant species because as these become overgrazed, invasive species move in and outcompete native species for soil nutrients and space. Eventually this can leave a field unsuitable for any grazing as no forageable plants remain.
Soil Erosion
Runoff of soil and other sediment from agricultural areas is the most common source of agriculture related water pollution. Rainwater or irrigation water picks up soil particles and carries them off the landscape into nearby lakes and streams where they can cloud the water and smother aquatic life. Soil particles commonly have pollutants like fertilizers, pesticides, heavy metals, pathogens, or other nutrients attached to them that are also carried into waterways.
Soil erosion is also detrimental to agricultural fields. It strips fields of needed soil and nutrients leading to decreased crop productivity and an increased need for chemical fertilizer applications.
Over Irrigating
Runoff of nutrients, pesticides, manure, pathogens, and soil are all exacerbated by overwatering. This can be brought on by large rainstorms that increase surface runoff temporarily or can be a result of irrigating fields more often or with more water than is needed by the crops.
4.2 Aquatic Impacts from Agricultural Pollutants
The various agricultural pollutants above can cause a range of impacts to streams, lakes, and ocean waters ranging from cloudy water to water that is devoid of life depending on the pollutant.
Cloudy Water
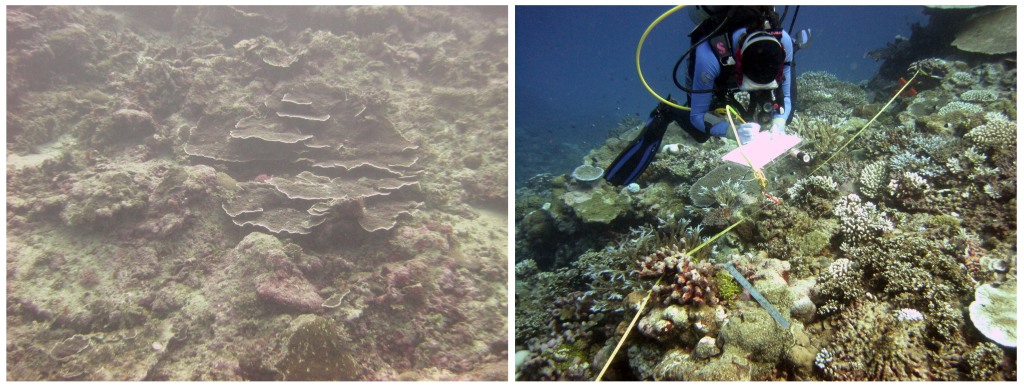
Increased soil erosion, whether off plowed agricultural fields or due to overgrazing, can lead to cloudy water that blocks sunlight. Only photosynthetic organisms in the top of the water column will be able to receive sunlight and survive, thereby affecting the food chain in the ecosystem. In addition, excess soil and sediment in the water can clog fish gills, smother breeding grounds, and otherwise degrade sensitive ecosystems such as coral reefs (Figure 2C.4.4).
Poisoned Water
Pesticides and other chemicals used to control agricultural pests can poison waterways. These chemicals typically have low acceptable concentrations in drinking water, above which they are toxic creating acute and long-term health effects in humans depending on the specific chemical and duration of exposure. Health effects from exposure and ingestion include skin irritation, nervous system damage, endocrine and hormone system damage, and cancer. These chemicals can be carried off farm fields by heavy rainfalls or improperly managed irrigation, or they can infiltrate soils and seep down into groundwater contaminating drinking water wells. While these chemicals are highly effective at controlling harmful agricultural pests, they poison fish and wildlife, kill off the protective plant cover animals use, and contaminate food and water sources used for animal and human consumption.
Pathogen Water
Pathogens, such as bacteria and viruses, can be introduced to water because of poorly managed feedlots, from manure spread on farm fields, or they can be attached to soil particles eroding off the landscape. These pathogens lead to water borne diseases (i.e., diarrhea, gastrointestinal illness, fever) and death. The Environmental Protection Agency (EPA) sets maximum contaminant levels for drinking water in the United States. These are the highest level of contaminant allowable for safe consumption without detrimental health effects. In the case of pathogens, the maximum contaminant level is zero; there is no safe amount. Municipal water supplies are required to regularly test drinking water to ensure contaminants are below the maximum levels set by the EPA. As a result, few instances of water borne illnesses in the U.S. are a result of municipal drinking water, however, recreational use of pathogen contaminated water, such as swimming, can result in illness.
These pathogens affect groundwater as well if they seep down through the soil and infiltrate aquifers. This is more prevalent in areas with shallow aquifers. Drinking water in rural areas is often supplied through well water placed into shallow aquifers. Well water is not monitored like municipal water supplies, and households are responsible for testing their own water supply to ensure it is not contaminated.
Dead Zones
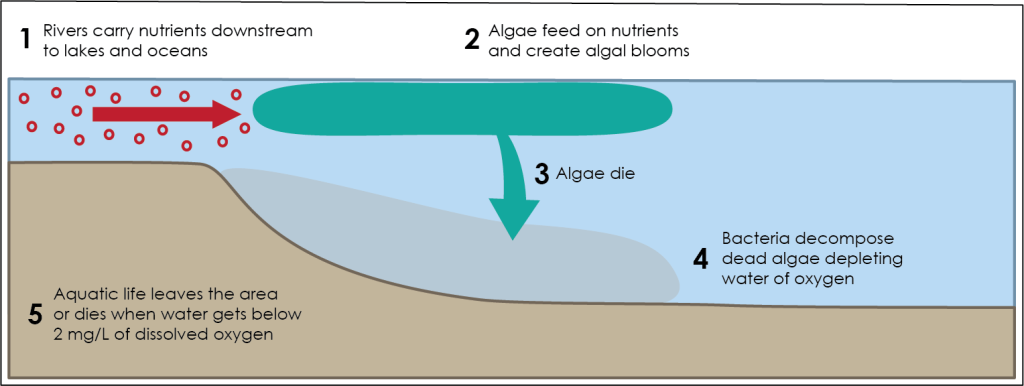
If there are more nutrients on the landscape than can be used by the plants, the excess will runoff into waterways. Excess nutrients can be from fertilizers, manure, or attached to soil particles. Nutrients such as nitrogen and phosphorous (the main ingredients in fertilizers) are essential for plant growth and when added to waterways also feed algae (photosynthetic organisms that predominantly live in water). As algae feed on these excess nutrients, they grow in number leading to a huge population growth in a brief time, commonly called an algal bloom. Algal blooms look like a thick green sludge on the water’s surface (Figure 2C.4.5), and they can block sunlight from reaching down into the water column.
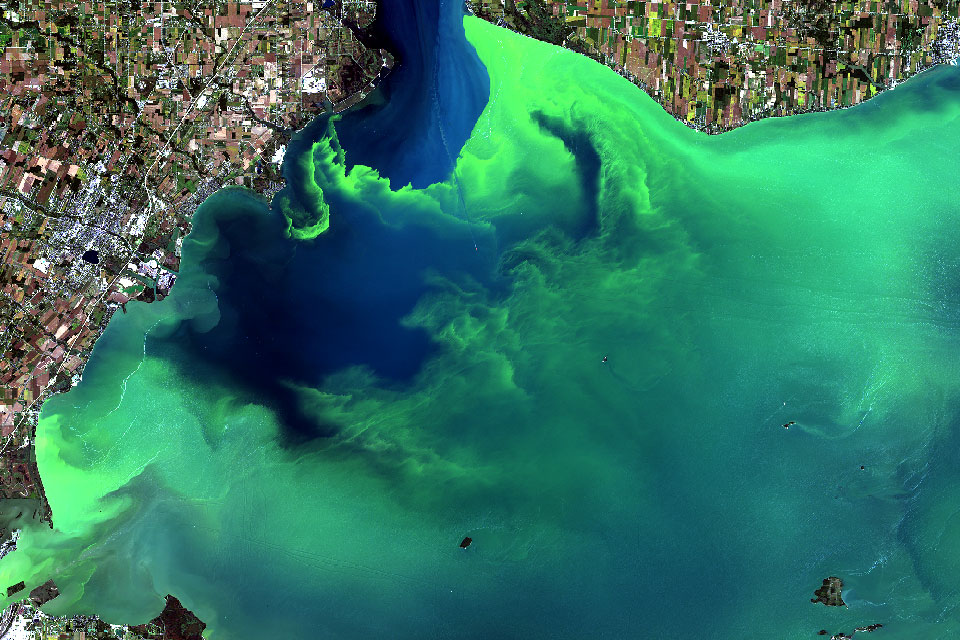
Algae have a short life span, with many types only living for days to weeks to months, and as they die, they feed a community of decomposing bacteria, which use cellular respiration to make energy and breakdown the dead algae. This means, like us, they “breathe in” oxygen and release carbon dioxide as they decompose the algae. In the case of algal blooms, the amount of oxygen used up during decomposition creates hypoxic conditions, meaning the water has very low or no oxygen remaining in it, less than 2 mg/L. The lack of oxygen makes it impossible for aquatic life to survive in the water creating a dead zone. This process of dead zone creation is called eutrophication (Figure 2C.4.6). Dead zones form in lakes and coastal waters typically near the mouths of rivers that are supplying excess nutrients from upstream.
The largest dead zone in the U.S. is in the Gulf of Mexico where the Mississippi River empties into the gulf carrying the excess nutrients washed off the bulk of the agricultural land in the country (Figure 2C.4.7). The size of this dead zone varies but can be 7,000 to 8,000 square miles in size. For reference, this is about the size of the states of Massachusetts or New Jersey.
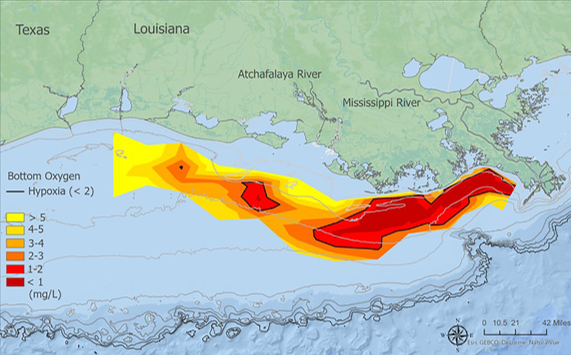
Surveys of the water oxygen levels in this area have been conducted annually since 1985, indicating a persistent dead zone since that time. Studies of seafloor sediments indicate hypoxic waters have been present to some extent in this area for at least the last 150 years. The size of the dead zone varies yearly related to stream flow volumes in the Mississippi River (drought vs. wet years) and level of nutrients washed off the landscape. The size also varies seasonally, increasing during the growing season related to agricultural activities.
In addition to creating dead zones, certain algae types, mainly cyanobacteria (also called blue-green algae) release toxins. These toxins can be harmful to human health and wildlife.
It is important to note that while the water quality impacts discussed here can be the result of agricultural activities, agriculture is not the only source for these issues. Industrial runoff, urban activity, mining, and natural contamination (i.e., animal activity or rock leaching), among others, can also lead to water quality impairment.
Check your understanding: Water contaminants and impacts
Match the agricultural water contaminants with their water quality impacts by dragging the contaminant from the right-hand side into the water quality impact column. Remember, many sources of contamination can cause more than one water quality issue, so contaminants can be used more than once.
References
American Association For The Advancement Of Science. (2001). Diet And Disease In Cattle: High-Grain Feed May Promote Illness And Harmful Bacteria. https://www.sciencedaily.com/releases/2001/05/010511074623.htm
United States Environmental Protection Agency. (2023). Polluted Runoff: Nonpoint Source Pollution. https://www.epa.gov/nps/nonpoint-source-agriculture
United State Geological Survey. (2006). Gulf of Mexico Dead Zone—The Last 150 Years. https://pubs.usgs.gov/fs/2006/3005/fs-2006-3005.pdf
