3. Crop Water Needs
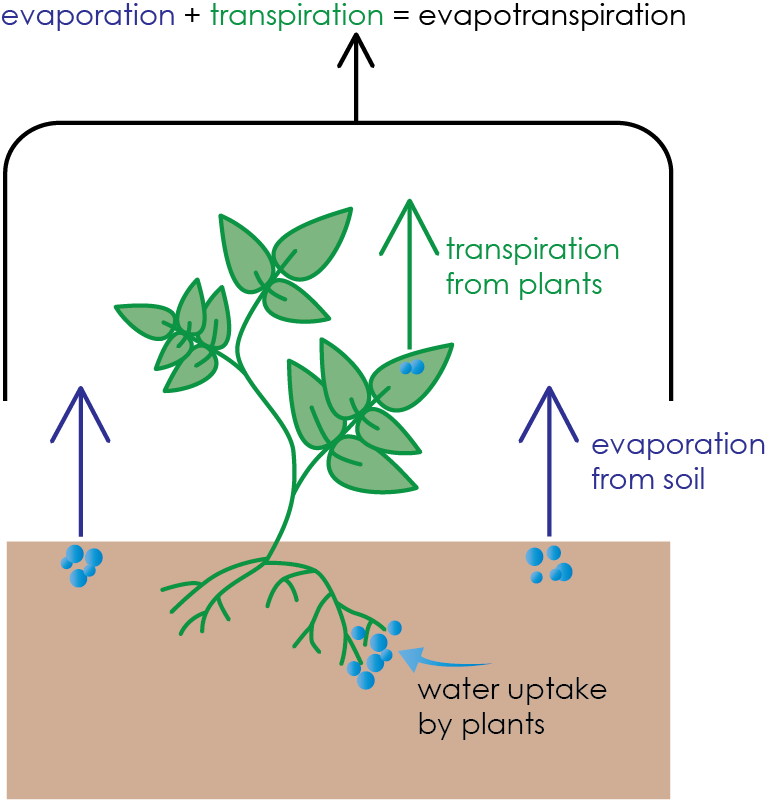
When determining how much water a plant needs to grow, both the amount of water transpired by the plant and the amount of water evaporated from soil around the plant need to be considered. These two processes are difficult to measure independently of each other and are typically measured or calculated as a combined factor called evapotranspiration (ET; Figure 2A.3.1). The amount of water lost to evapotranspiration represents the total water needs for a crop.
As evapotranspiration rates of crops are a combination of evaporation and transpiration, they vary based on the same climatic conditions (humidity, wind, temperature) that affect evaporation and transpiration. In other words, a single crop will have a higher ET rate in a hot, dry, windy climate than it would in cool, humid, non-windy conditions. This means in the hot, dry, windy conditions that same plant will require more water to survive and grow because more water is evaporating from the soil and transpiring through the stomata, which means more water is leaving the soil and needing to be replaced. Figure 2A.3.2 shows the typical range of water requirements for various crops.
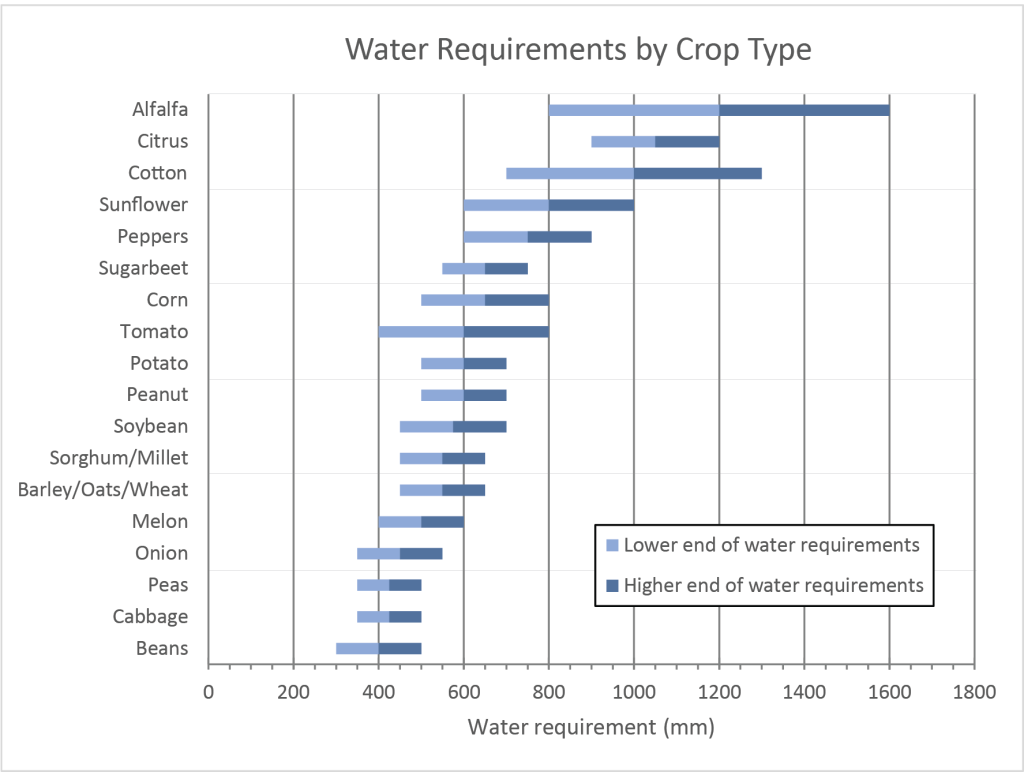
Most food crops in this diagram require 400 – 600 mm of water (~16 – 24 in), however some crops, like alfalfa, cotton, and citrus, require 1000 mm or more (over 40 inches) of water. There are crops, such as sugarcane and bananas (not shown on the graph), that require even more water than alfalfa. The main uses for alfalfa and corn are as feed crops for animals. Feed crops tend to be higher in water needs than vegetables and other grains used directly for human consumption.
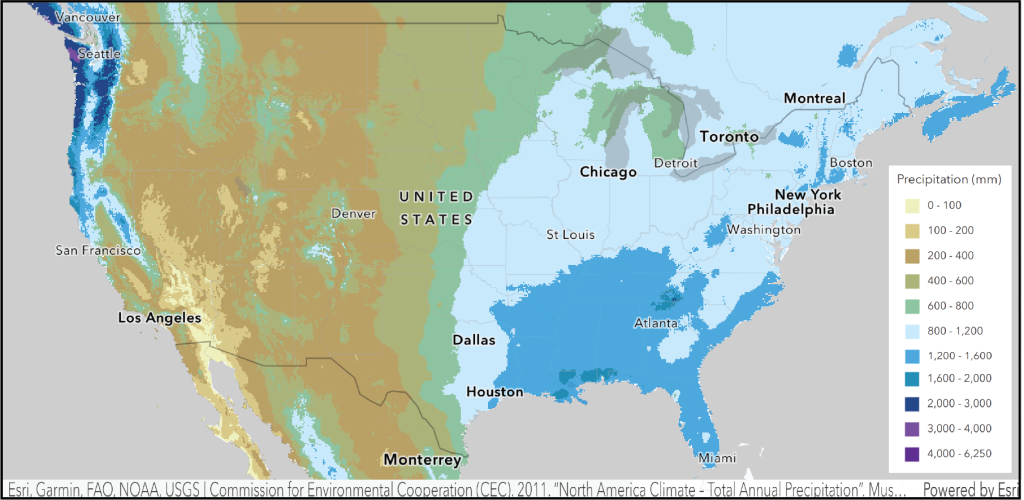
The map below (Figure 2A.3.3) shows the average annual precipitation for the U.S. in millimeters. Most of the western U.S. does not receive enough annual rainfall, let alone rainfall during the growing season, to grow alfalfa or corn using rainfall alone.
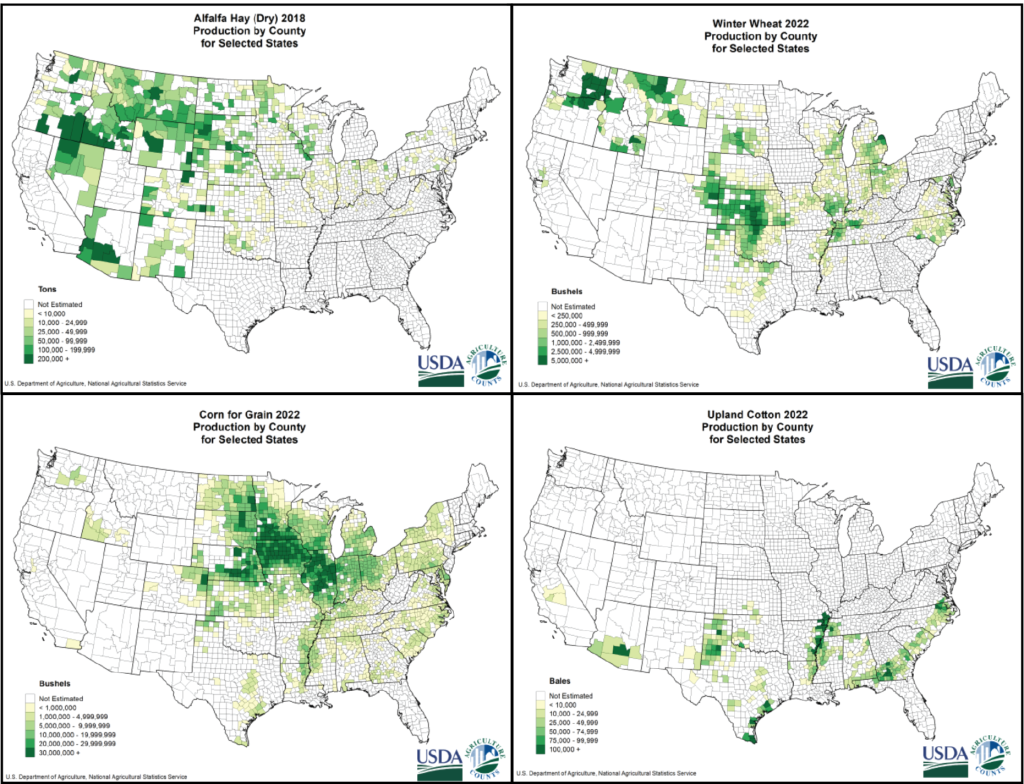
Let’s think about this idea in terms of major crop growing areas in the United States. The set of four maps below (Figure 2A.3.4) shows the production by county in the U.S. for alfalfa, wheat, corn, and cotton. The series of questions below the maps walks you through how to compare water requirements to precipitation values and determine if the regions these crops are grown in are the best options regarding water use practices.
Check your understanding: Analyzing crop production zones in the U.S. relative to natural precipitation
Dryland farming is when all the water requirements for a crop are met by natural precipitation. In other words, crops are not supplied with supplemental water through irrigation. While the above exercise was a simple way to compare precipitation with crop water requirements, comparing these two sets of data is not enough to provide the entire picture of whether natural precipitation is sufficient for dryland farming. Not all the rainwater that falls onto the soil will infiltrate to become soil water that can then be evapotranspired. Some of that water will infiltrate much deeper into the soil than crop roots can reach and some of that water will runoff over the surface of the landscape taking it away from the crops. This means only a portion of the rainwater is useable for the crops, this is called the effective precipitation. To dryland farm, the effective precipitation during the growing season, not just the total annual precipitation needs to meet crop water requirements. One method, developed by the Food and Agriculture Organization for the United Nations, for calculating effective precipitation is to use a fixed percentage of 80% of total precipitation. This is a simplified way to provide a rough estimate of the effective precipitation in a region. However, there are many factors that will affect how much rainwater actually becomes useable for the crops that are not taken into account with this method. Effective precipitation is really a measure of infiltration which is controlled by:
- the duration and intensity of the rainfall – minimal, soft rain might not be enough to infiltrate at all before evaporating and a very intense but short downpour might be more than the permeability of the surface soil can handle and quickly outpace infiltration and therefore run over the surface instead of infiltrating.
- amount of water already in the soil – if the soil is already saturated, it cannot hold more water and so water will runoff over the surface.
- steepness of the landscape – steep slopes promote more surface runoff allowing less infiltration.
- vegetation in the area – healthy and abundant plant root systems pull more moisture out of the soil promoting more infiltration to replace water taken up by plants.
- ground surface materials – porous and permeable surface materials allow more infiltration than low porosity or low permeability materials.
Other calculation methods attempt to take these factors (and more) into account, but for the learning purposes of this module, the fixed percentage approach is adequate for calculating effective precipitation.
Check your understanding: Practice calculating effective precipitation
If crops are grown in areas where there is not sufficient water to dryland farm, the only alternative is to provide supplemental water in the form of irrigation. Irrigation is simply the application of water for agriculture through manufactured systems for the purposes of supplying water when natural precipitation is not sufficient. Irrigated agriculture is important economically. More than 54 percent of the total value of crop sales and more than 58 million acres of cropland were irrigated in the U.S. in 2017. The water sources for irrigation can be surface water (lakes/rivers/streams) or groundwater. Each has its own positive and negative aspects.
References
Brouwer, C. & Heibloem, M. (1986). Irrigation Water Management: Irrigation Water Needs. Food and Agriculture Organization of the United Nations. https://www.fao.org/3/S2022E/s2022e00.htm#Contents
Food and Agriculture Organization of the United Nations (n.d.) CROPWAT 8.0 [computer program]. https://www.fao.org/land-water/databases-and-software/cropwat/en/
USDA Economic Research Service. (2023). Irrigation and Water Use. https://www.ers.usda.gov/topics/farm-practices-management/irrigation-water-use.aspx
