1. The Hydrologic Cycle and Freshwater Uses
1.1 Hydrologic Cycle
The focus of this module is on the interplay of water resources and agriculture, therefore, understanding the hydrologic cycle (fancy term for the water cycle) is important. All water on the planet is connected through the hydrologic cycle. This cycle is a closed system which means the volume of water on the planet today is the same as it always has been. No new water has been introduced to the planet and water has not left either – it has just changed where it is located and the form it has.
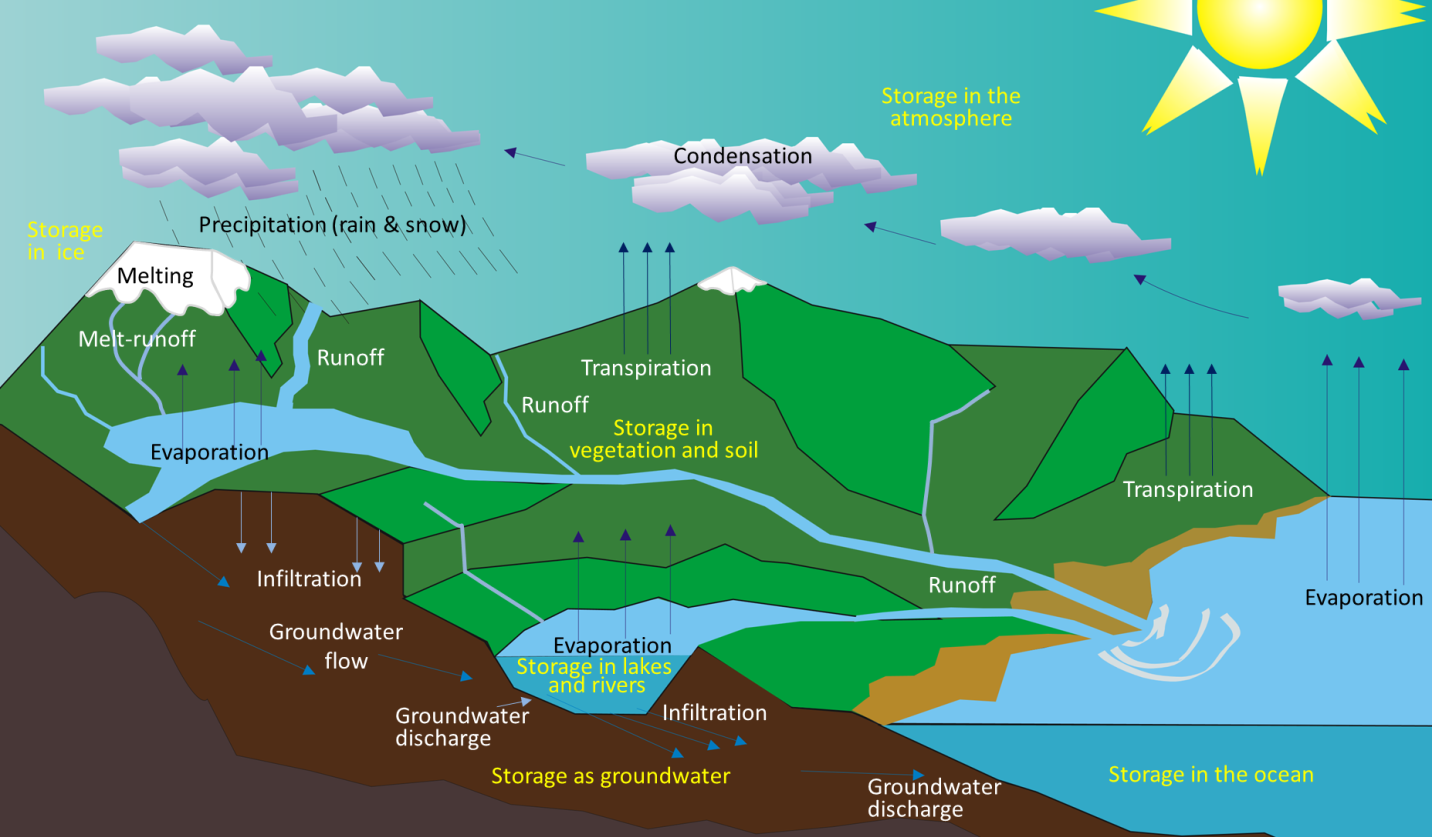
Water on the planet is constantly on the move. It travels from one location (called a reservoir or store) to the next through processes called flows. It is evaporated from the oceans, lakes, streams, the surface of the land, and plants (transpiration). It is transported in its gaseous form through the atmosphere by the wind and condenses to form clouds of water droplets or ice crystals. It falls to the Earth’s surface as rain or snow and flows through streams, into lakes, and eventually back to the oceans. Water on the surface and in streams and lakes infiltrates the ground to become groundwater. Groundwater slowly flows through soils, surficial materials, and pores and cracks in the rock. The groundwater flow paths can intersect with the surface and the water can then move back into streams, lakes and oceans or be taken up by soil and plants (Figure 2A.1.1).

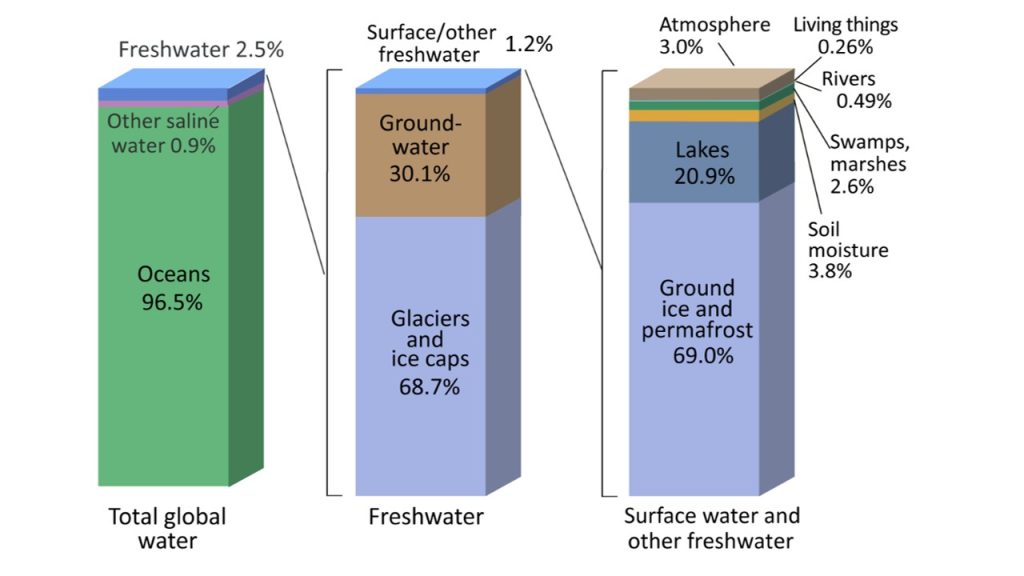
There are 332.5 million cubic miles of water on the planet and most of this is salt water (the oceans hold close to 97% of all water on the planet). Of the total freshwater, over 68 percent is locked up in ice and glaciers. Another 30 percent of freshwater is in the ground. Fresh surface-water sources, such as rivers and lakes, only constitute about 22,300 cubic miles (93,100 cubic kilometers), which is about 1/150th of one percent of total water. Yet, rivers and lakes are the sources of most of the water people use every day (Figure 2A.1.2).
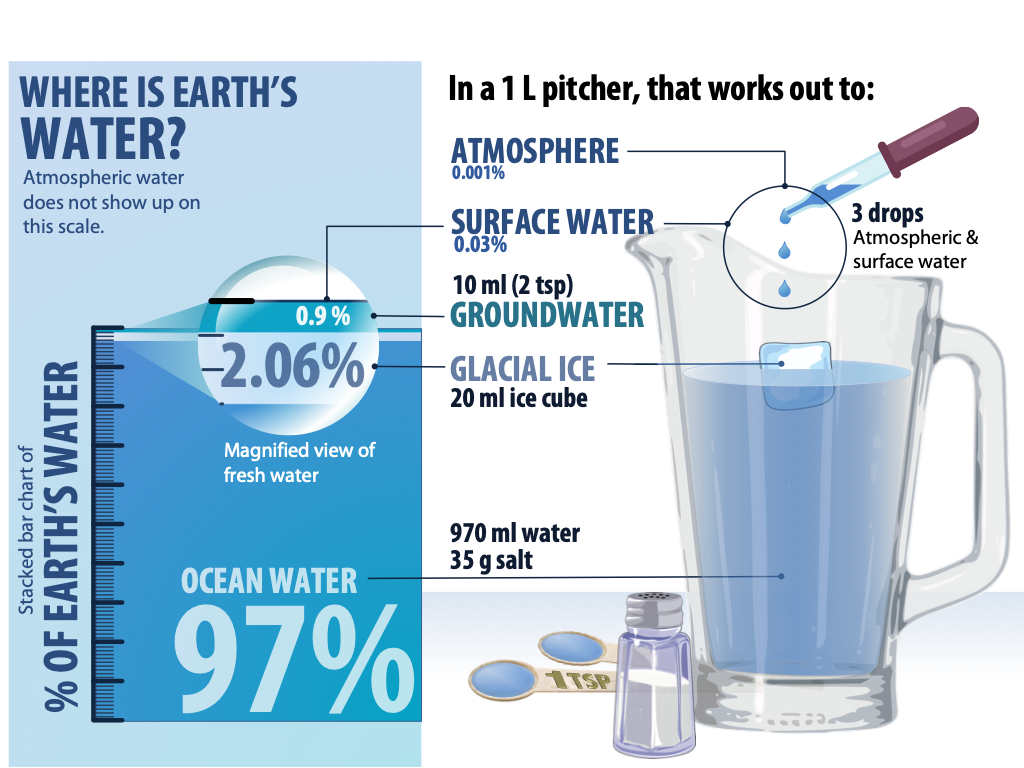
To put these percentages in perspective, pretend a one liter (1000 ml or about 4 cups) jug of water represents the entirety of Earth’s water supply (Figure 2A.1.3). The 970 ml in the jug is all the saltwater on Earth. One regular sized ice cube (~20 ml) represents frozen freshwater (glaciers/ice caps), and two teaspoons (~10 ml) are groundwater. All the visible surface water on the planet (lakes/rivers/streams) is represented by the three drops of water being added by the eyedropper. The saltwater, frozen water, and most of the groundwater is not easily accessible/readily available water, which is why humans mainly rely on surface water, but surface water is only a tiny fraction of Earth’s water resources. This is why taking care to keep our water resources clean and use them sustainably is so important!
Check your understanding: Hydrologic cycle
1.2 Freshwater Uses
Freshwater is used in a variety of ways. The way most people think of first is as everyday domestic use (washing dishes, brushing your teeth, drinking, etc.) which is often supplied by a public water supply. Other uses include industrial uses (manufacturing of consumer goods, washing of equipment, etc.), mining, water for livestock, water for aquaculture, thermoelectric water, and irrigation (agriculture).
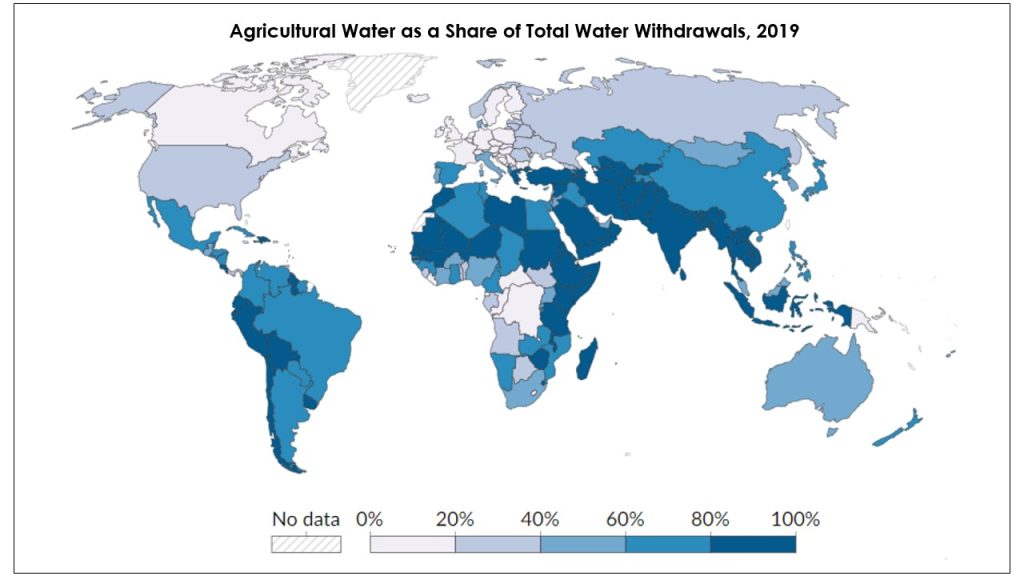
Globally, the largest use of freshwater is for irrigation purposes. On average 70% of all water usage is used for irrigation, however, that varies significantly by country (Figure 2A.1.4) and income level. Low-income countries use on average 90% of water withdrawals for agriculture, while middle-income countries use 79%, and high-income countries use only 41%.
Freshwater usage has changed over time in the United States. The total volume of water being used for irrigation has stayed constant since the mid-1950s, with some small ups and downs, but the percentage of total water used for irrigation has declined since that time. In the 1950s the US used about the world average of 70% of its water for irrigation, but this declined as thermoelectric water usage increased and reached a peak in the 1970s through 2000s (Figure 2A.1.5). Presently between 40-50% of water usage is irrigation.
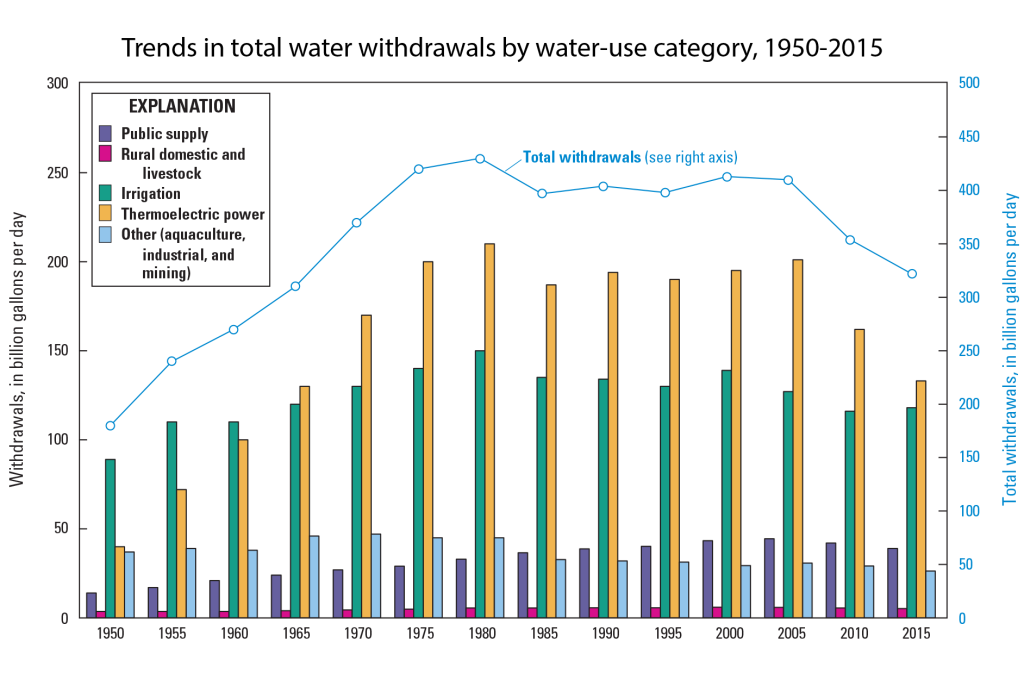
Thermoelectric water is water used in electricity production facilities (i.e., a coal fired power plant) for cooling purposes – this is not the same as a hydroelectric facility. The overall declines in water use since the mid-2000s have mainly been a result of a changing energy supply in the United States. As the US has shifted from coal fired power plants to natural gas and renewables as main sources of power, this has created a decreased need for cooling water (powerplant cooling water needs for natural gas are less than coal and many renewables require no cooling water at all).
Irrigation water use has also declined, although less so than thermoelectric. This has been the result of increased irrigation efficiency and more sustainable farming practices in relation to water usage.
Thermoelectric and irrigation continue to be the top two freshwater uses in the United States. Thermoelectric water use is highest, but it also has a major difference compared to irrigation water use. While there are various designs for power plants, just under half of the power plants in the US are designed with open systems where water is removed from a nearby river/lake/stream, used to cool the powerplant, and then returned directly back into the river/lake/stream. As a result, it ultimately stays in the same place in the hydrologic cycle – just with a brief stopover at an electrical facility. In this way, the water is largely not consumed (there is some water loss, around 2%, due to evaporation). This is termed non-consumptive water use.
In contrast, water used for irrigation purposes is used or consumed by the plants, the soil, evaporated, or runoff into a new location. In other words, it goes to a new place in the hydrologic cycle as a result of being used. This is consumptive water use.
Check your understanding: Consumptive and non-consumptive water uses
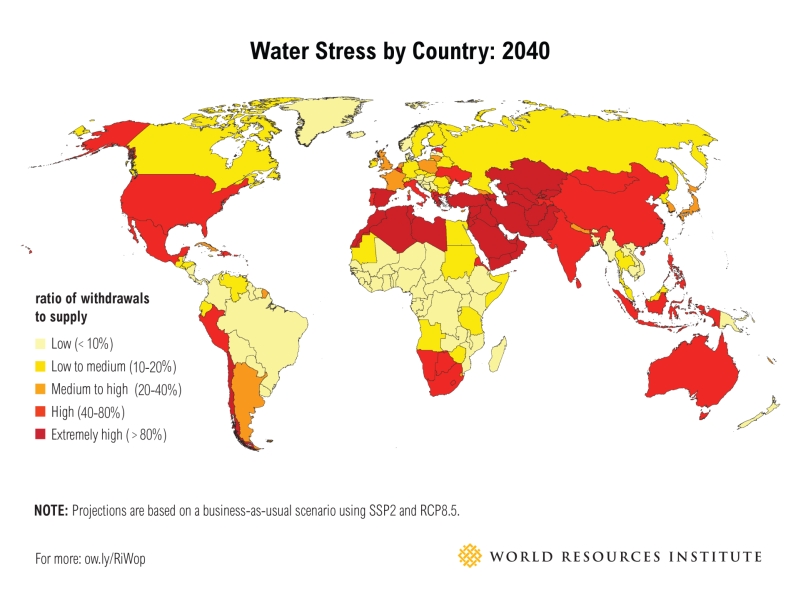
Water scarcity is already a major issue for the planet and will only get worse as climate change causes more changes to water availability (i.e., droughts), which then affects agriculture and food availability. The world demand for water is expected to increase significantly in the coming decades as growing populations drive increased consumption. However, the availability of water is finite, so it is not clear how this increased need for water can be met, particularly with climate change making some areas of the world wetter and others drier causing different regions to face increasing floods and droughts, respectively. Figure 2A.1.6 is a world map color coded to show water stress (measured by water usage compared to water availability) by country in 2040 if no changes are made regarding water usage and human impact on climate change. An estimated 3.2 billion people (46% of the global population) live under water stressed conditions for at least 1 month of the year every year. But this water stress is not distributed equally around the globe; around 80% of the water stressed population lives in Asia, dominantly in India, Pakistan, and northern China.
Balancing future water needs for the natural environment and humans will become more challenging as changes to climate, changing demographics (increasing size of urban centers), and changing socioeconomic conditions drive changes in water availability and water use. Ensuring these needs and the needs for agricultural water require sustainability practices to be emplaced.
References
Maddocks, A.; Young, R. S.; and Reig, P. (2015). Ranking the world’s most water stressed countries in 2040. World Resources Institute https://www.wri.org/insights/ranking-worlds-most-water-stressed-countries-2040
US Energy Information Administration (2011). Over half the cooling systems at U.S. electric power plants reuse water. https://www.eia.gov/todayinenergy/detail.php?id=3950
Vanhan et al., (2021). The number of people exposed to water stress in relation to how much water is reserved for the environment: a global modelling study. The Lancet Public Health. 5(11). https://www.thelancet.com/journals/lanplh/article/PIIS2542-5196(21)00234-5/fulltext#seccestitle160
