20 Subtotals
Subtotals
Learning Objectives
- Convert a table to a normal range
- Sort data based on desired subtotal categories
- Create subtotals
- Create multi-level subtotals
- Subtotal views
- Remove subtotals
Creating Subtotals
Follow-along file: Continue with Excel Objective 5.00. (Use file Excel Objective 5.06 if starting here.)
Suni is helping the college president prepare her budget, and she needs a report she can give to the college president showing the number of each style of vehicle and the total annual maintenance cost by department. Using the total row in your table would mean creating a filter for each department and Style. Then printing each out in a separate report. You can create this report for her by creating subtotals in your worksheet.
We will summarize the data in our range by inserting subtotals. The subtotal command offers many kinds of summary commands. These include:
• Count
• Sum
• Average
• Maximums
• Minimums
There are a few major rules that must be followed before we can use the subtotal command. These are critical and include:
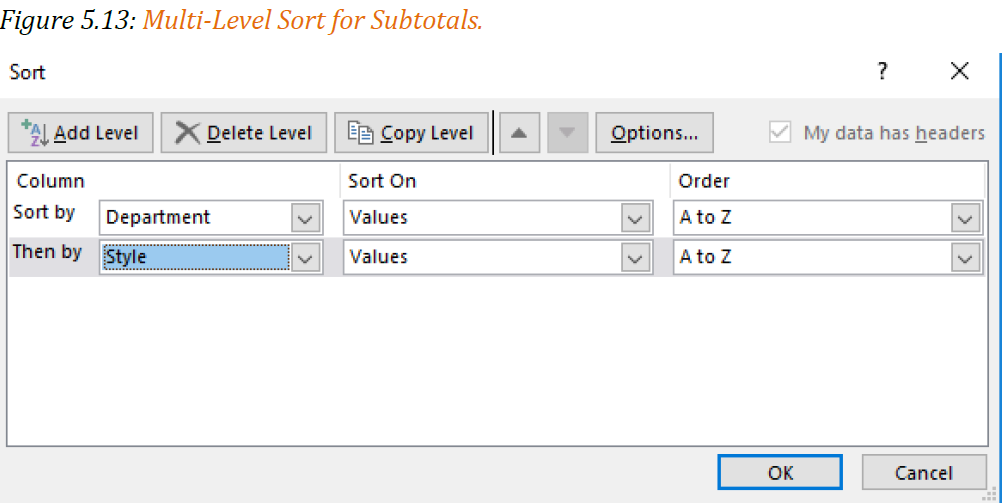
• Your data must be sorted in the order(s) you wish to create subtotals on. For instance, we want to create subtotals by department and by style within the department. Our sort levels would be department, then Style.
• If you have your data in an Excel table, that data must be converted to a range. You cannot perform subtotals on data in a table.
We will create these subtotals using the following steps.
1. Copy the Raw Data worksheet by holding the Ctrl key down while left clicking the Raw Data worksheet tab and dragging the worksheet to the right of the Vehicle Filter worksheet.
2. Rename the new worksheet Vehicle Subtotals.
3. Create a multi-level sort by department and then by Style.
4. Convert your Excel table to a range, (Note: you would skip this step if your data is not in an Excel table.) by clicking anywhere within the data. If your table has a total row, remove it by clicking on the check box in the Table Design ribbon. From the Table Tools Design click on Convert to Range in the Tools section.

5. Click Yes when the warning box appears.
6. From the Outline section of the Data tab, click on Subtotal. The first subtotal we will insert is the cost of annual maintenance by department.
7. From the Subtotal dialog box, in the At each change in: select Department from the drop-down. (This determines how the subtotals will be grouped.)
8. In the Use function box, select Sum. (This determines what operation will be performed.)
9. In the Add subtotal to: click on Annual Maintenance. Uncheck any box that may be selected because we only want a subtotal for Annual Maintenance.
10. Click OK.

Next, we will add the count of vehicles by style to our subtotals. We will do that using the following steps.
1. Make any cell in your data range active. Click on Subtotal in the Outline section of the Data ribbon.
2. IMPORTANT: uncheck the box that says Replace current subtotals. If you do not, the new subtotal you create will erase the first one you did earlier.
3. We need to count the number of vehicles by style in each department. In the At each change in: select Style.
4. In the Use function: select Count. We want the number of each style vehicle in the department.
5. In the Add subtotals to: select Style and uncheck Annual Maintenance.
6. Click OK.

Next, we will add an appropriate title for our subtotal worksheet.
1. Click in the grey area of row 1 and drag down through row 2. This will select the entire rows 1 and 2. Hold the Ctrl key and click on the + key on your ten-key keypad, or Ctrl, Shift and the +, to insert two new rows.
2. Merge and center across cells A1:H1.
3. Type the following title in A1. Remember to use Alt and Enter to move down a row inside cell A1.
Minnesota State College
Vehicles Sorted by Department
Report date: 3/1/2025
4. Enter to save the contents of the cell.
5. Resize row 1 so the entire title shows.

Subtotal Outline View
In addition to displaying subtotals your Subtotal feature creates outline views. Figure 5.17 shows the outline buttons that are created when a worksheet has the subtotal feature applied. It will show or hide different levels of detail in your worksheet.
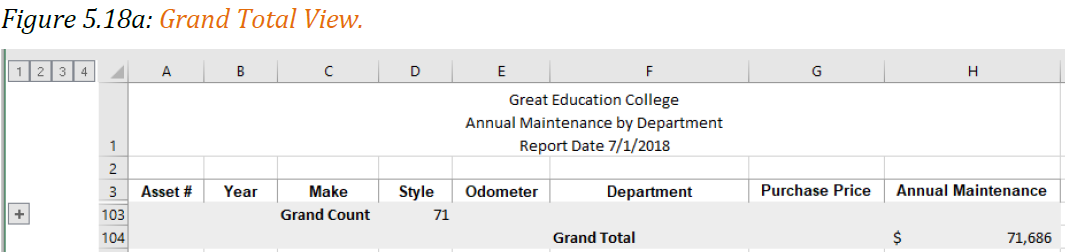
1. Level 1: only the grand total shows.
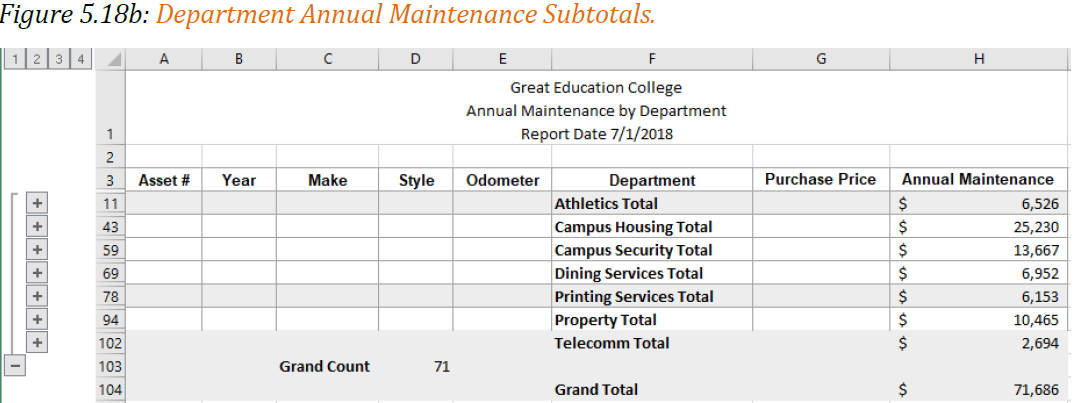
2. Level 2: totals for each of the main categories will show.
3. Level 3: will show if you have secondary subtotals. In the case of the college’s vehicles, we have a secondary sort by style, so our level 2 view shows the subtotals for both Department and Style.

4. Level 4: shows the entire data set with subtotals. (Figure 5.17)
In short, the higher the level showing the more condensed the data will be. As you move higher, more and more of the data will be revealed.
• Level 1 shows the grand total only
• Level 2 shows the main category subtotal
• Level 3 shows subtotals for each major and secondary subtotals (if more than one subtotal applied.)
• Level 4 (in this example) shows all the data and subtotals.
Removing Subtotals
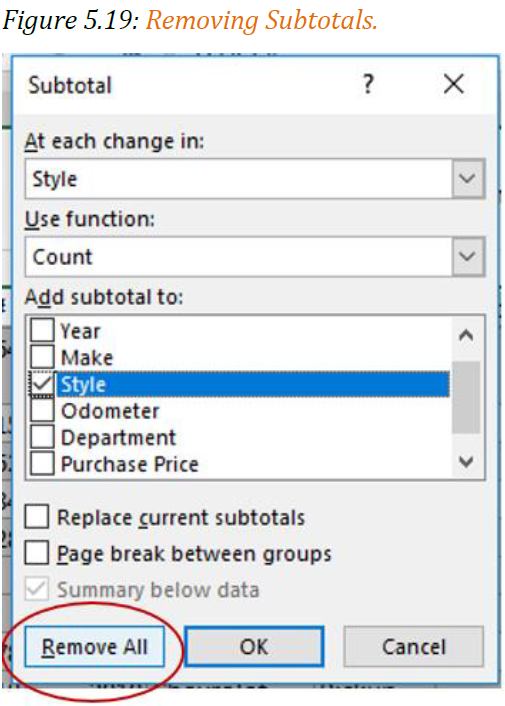
To remove the subtotal from a worksheet you must use the Subtotal button from the Outline section of the Data tab. Note: Clicking on Undo will not remove subtotals.
Click Remove All from the lower left corner of the Subtotal Dialog box. See Figure 5.19.