25 Power, Power, Power – Oh, so much power!!!
Power3 – Oh, so much power!!!
Power BI, Power Query, and Power Pivot are powerful business intelligence tools developed by Microsoft that allow users to connect, transform, and analyze data from various sources to create compelling visualizations, reports, and dashboards. While they all help manage data, there are key differences between these solutions.
Power BI
Power BI, Microsoft’s business intelligence tool, enables users to transform raw data into operable insights. Power BI focuses on data visualization and reporting, while Excel is better for detailed analysis and financial modeling. Power BI and Excel both have Power Query for gathering/combining and transformation of data, however power BI lets users connect to more data sources (such as Google sheets). Both Power Query and Power Pivot are part of the Power BI cloud-based business analytics service. Power BI strengths over regular Excel are in its visualizations. Visualizations is the name assigned to the charts, slicers, tables and matrixes that users can insert into their reports in Power BI. Power BI has a greater choice of visualizations than Excel, and lots of options for how they interact with the other visualizations on a page, or even across the entire report.
Power Query
Power Query is a data extraction, loading and transformation tool used for business intelligence. 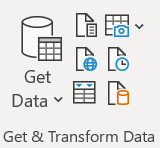 With Power Query (known as Get & Transform in Excel), users can import or connect to external data, and then shape that data. For example, a user can remove a column, change a data type, or merge tables, in ways that meet their needs. Then, the user can load their query into Excel to create charts and reports. Periodically, the user can refresh the data to make it up to date. In Excel, select the Datatab on the ribbon to see the Get & Transform Data and Queries & Connections groups.
After importing and refreshing data from a wide variety of data sources, users can then shape the data in a step-by-step transformation that gradually creates a unique, tabular shape to fit the user’s data analysis needs. For users who perform repetitive data transformation tasks or struggle to organize and analyze their data, Power Query might be a great solution.
Power Pivot
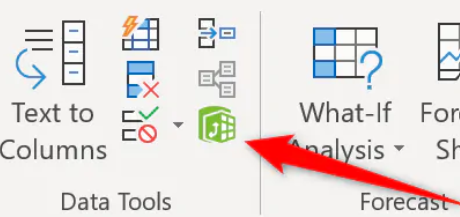
Power Pivot is used to model data and perform more complex calculations than Excel can handle. Power Pivot is great when working with huge data sets. Once Power Query has imported and cleaned the various data sources, Power Pivot is used to establish relationships between the tables/queries. Using DAX (Data Analysis Expressions), the formula language of Power Pivot, users can create more powerful calculations and more sophisticated data models than they can in Excel alone.
Power Query can prepare simple but large datasets for analysis. Power Pivot, on the other hand, is for more complex models and more powerful calculations than Excel worksheet functions or PivotTables alone. Conversely, while Power Pivot contains features for importing and shaping data, it is recommended to leave this job to Power Query. Use both to shape your data in Excel so you can explore and visualize it in PivotTables, PivotCharts, and Power BI.
