Main Body
4 Foundations of Public Health
Hector (Giovanni) Antunez
Learning Objectives
By the end of this chapter, the learner will be able to:
Public health fundamentals
Although public health was defined at the beginning of the book, it is important also to define what health is. There are several definitions of health, the most accepted from the World Health Organization (WHO) 1948, which reads: “[Health is] a state of complete physical, mental and social well-being and not merely the absence of disease or infirmity.” [1]. This definition emphasizes that being healthy involves more than just being free of disease or infirmity; it requires a balance between an individual’s physical, mental, and social well-being.
Regarding the above definition, in 1986 WHO made some clarifications, saying that “[health is] a resource for everyday life, not the objective of living. Health is a positive concept emphasizing social and personal resources, as well as physical capacities.” [2]. What does it mean? It means that health is a resource that helps a person to function in society. In this context, a healthy lifestyle leads to a life with less chronic disease, disability, and death, and a meaningful life with a purpose.
Other definitions of Health
In addition, in 2009 the Lancet published an article that defines health as, "the ability of a body to adapt to new threats and infirmities."[3] The Lancet's definition acknowledges that the absence of pathology (or, disease) may not be possible even though science has made significant discoveries that help the individual (and society) to prevent, treat, and control disease.
 |
| Health by Nick Youngson CC BY-SA 3.0 Pix4free.org |
Other definitions of health include elements not explicitly found in other definitions (including those above mentioned), as is the case of the Oxford Dictionary that says, "the state of being free from illness or injury."[4] This adds an important element, 'free of injury,' it is not enough to be free of disease if, there is a disability because of for example a work injury. As presented above, the definitions of health result incomplete, they are still a work in progress, but at least, they help to get an idea of what it is meant when the word, 'health' is used.
Measuring health
Public health practitioners and healthcare providers have been searching for ways to measure 'health' at least in a broad manner, and that has contributed to the development of several 'health assessments' that are commonly used by insurance companies, and related institutions, including academia.
In this context, the question is: how do we measure health? One common way to measure health is to use certain health indicators that can be quantified or, assessed in a manner that provides specific results that can be used to get an overall idea of the health of an individual and in some cases, of a population as it is the case in public health, which studies population health. [5] Several of the tools used to measure health come from the concept of health determinants, which is the topic of the following paragraphs.
Using models or conceptual frameworks to measure health
Since it is accepted that health and disease include a multitude of factors that are involved in the process. Most models used to explain these processes fall short because for example, the disease is more than the interaction between an agent, a host, and an environment, and even if the concepts are expanded such as in the case of the chain of infection model, most of these models are mainly medical, not that this is bad, but they are insufficient since these mentioned models forgot to integrate the concepts of risk factors and other several factors that affect the health of the individual and the community in a direct or, indirect form.
The concept of Social Determinants of Health (SDOH)
Besides the above mentioned limitations of models and frameworks used to explain health and disease, they are important to understand and operationalize health. One popular framework is the concept of social determinants of health. An image that summarizes the main elements of this model is presented as follows:
| Image: Social Determinants of Health. From CDC, CC license Public Domain. |
In general, the Social Determinants of Health (SDOH) are conditions and places where people live, learn, work, and play that affect a wide range of health and quality-of life-risks and outcomes. [6] This approach is being found useful, especially in understanding how health and disease are dynamic concepts that go beyond the identification of agents/pathogens, host characteristics, and the environment. On the other hand, and to be fair, the previous ('older') models can still be seen in this new model, especially that expansion on the concept of environment, and its associated factors.
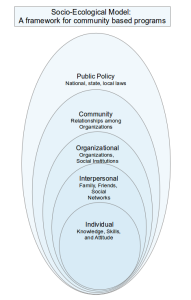
Another framework is, The Social Ecological Model (SEM) offers a framework that aids in comprehending the environment in which individuals and communities reside. It also helps in identifying where the concept of health determinants fits into the broader context of health. Below is an image that summarizes the major components of the model.
 |
| “Picture the social ecologic model,” Wikipedia commons, Licensed CC BY-SA 3.0 |
The Social Ecological Model (SEM) is a model that includes the following domains or, categories: the individual, its relationships, community, and society; all of them interacting with the different levels of public health policies and programs available at the community or, society level. As the image above first domain (or, first circle), the first component includes the knowledge, skills, and attitudes of the individual, and also (not included in the image) the biological factors such as gender, age, race and ethnicity, social economic status, and others. The next level in the image above is, relationships, or, the social network of the individual, which includes among others: family, friends, and the rest of social contacts or, resources available to the person that help the individual to stay healthy. The rest of the categories are, organizational, communitarian, and societal resources, policies and programs available to the individual to stay healthy, or, to live in a healthy and safe environment.
The content covered so far in this chapter had covered, the definition of health and the concepts of Social Determinants of Health and the Social Ecological Model that outline a series of factors that affect the health of the individual and its community.
Measuring Health - additional tools
At the beginning of this chapter, it was mentioned that it is not enough to define health, and the series of factors that affect health positively or negatively; in public health practice, there is a need to also measure health. Measuring health is an important task especially for the design and implementation of health programs, not to mention the need to identify health outcomes that reflect the impact of medical and public health interventions. Since there is an enormous amount of money spent on treating people, there is also a need to measure how important is to invest in prevention, which means dealing with a healthy individual.
 |
| ‘Image from page 170 of "Public health and preventive medicine" (1902),’ Flicker.com, Public Domain. |
Once we agree on measuring health, then, the question is: what areas do we need to measure? Let's look at the WHO's 1986 definition: "[health is] a resource for everyday life, not the objective of living. Health is a positive concept emphasizing social and personal resources, as well as physical capacities.” [7].
Let’s look at the definition just presented and see how we measure, the first part of this definition that says: "health is] a resource for everyday life, not the objective of living." This raises a series of questions:
- To what type of resource is the WHO referring to?
- How do we measure everyday life?
- How do we measure living?
Let's look at the second part of the definition: "Health is a positive concept emphasizing social and personal resources, as well as physical capacities.” This raises a question; how do we measure a 'positive concept' that emphasizes 'social' and 'personal' resources? And the last part of the definition: "...physical capacities." How do we measure physical capacities? Finally, the idea behind these questions is to realize that although it is important to have a 'concept' about health, it is also important to develop the tools to measure this 'everyday life' as a 'resource' that all of us have following the definition used in this section.
The use of health indicators
Since it is important to measure health, one common way to do it is by using, health indicators which are commonly used to reflect the health status of a population. One of the limitations of this type of data is that it reports mainly mortality. Examples of common health indicators include infant mortality, maternal mortality, neonatal mortality, and others. With time, there has been an initiative to measure 'health' using not only quantitative (counts, ratios, rates, etc.) data but also adding qualitative (such as personal stories, and other narratives) that add elements to the concept of health, by reflecting the level of happiness, satisfaction or, not with a public health or, medical intervention. In other intents to measure health, indirect measures can be used as is the case to measure 'disability,' which reflects the health of an individual after for example, a stroke, an injury, etc.
Where do I find the health indicators?
Besides the fact that the health indicators can be found at the National US Bureau of Census, [8] which contains the data (mainly quantities/numbers) to calculate the rates, ratios, proportions, etc.; the specific health indicators can be found at the Healthy People 2030 website.[9]
Healthy People 2030
There is a very useful tool, “The Healthy People (HP)” program that has been running in recent years if not decades, and the idea of it is to establish the national health priorities for the next decade, before Healthy People 2030, there was Healthy People 2020, and 2010 and so forth. US dept. of health, and related organizations use the Healthy People (HP) for the writing and preparation of their planning, and as a guidance for data collection. The Healthy People Initiative is a program from the U.S. Dept. of Health and Human Services (HHS) Office of Disease Prevention and Health Improvement (ODPHP).
| Image "Objectives and Data - Healthy People 2030," Office of Disease Prevention and Health Promotion,Public Domain.
|
Between HP 2020 and 2030, the program developed five major updates, which are listed as follows: [10]
- Leading Health Indicators (LHIs) organized by life stage
- New Overall Health and Well-Being Measures
- New objective types
- Cross-cutting topic areas
- A reduction in the number of measurable objectives
Although highly extensive (currently 358 measurable objectives), the group ( committee writing the Healthy People objectives claims that they had reduced the number of measurable objectives compared to previous editions of the objectives. What is essentially true is that the way the objectives are written now is way clearer and more applicable than before.
 |
| Image "Criteria for Selecting the Leading Health Indicators for Healthy People 2030", The National Academy Sciences, Engineering and Medicine, Public Domain. |
The idea of having these tools (the National Census, the Social Determinants of Health, the Social Ecologic Model, and the Healthy People 2030) is for public health professionals to be able to link the resources to better measure the impact/outcomes of public health intervention programs. A series of materials known as 'tools for action,' or just, 'tools kits' have been developed by the organizations representing the mentioned sources, so, public health practitioners can easily apply the content provided by these tools, which include among others, templates for planning and evaluation; dissemination of results including final reports. An example of this is the tool kit: "Use Healthy People 2030 in Your Work," which is recommended for 'Communities, states, and organizations across the country use Healthy People objectives to set their priorities.'[11] Another example of the application and use of the content discussed above is the County and Health Ranking Roadmaps (CHR) model of health determinants.
The Healthy People (HP) 2030 Objectives are used to measure health by providing the leading health indicators for the nation (United States).
County and Health Ranking Roadmaps (CHR) model of Health Determinants
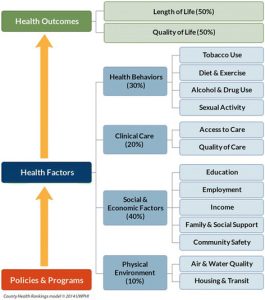
Although there is not a set of rules that says which tool to use first, most county health departments, use the County and Health Ranking Roadmaps (CHR) to plan and assess their communities, the CHR is a practical approach to looking at and using the health determinants concepts. The CHR is a program of the University of Wisconsin Population Health Institute, and it measures the health of all counties in the United States by ranking them within states. The rankings come from information obtained at the county level and from a series of national and other sources of health data available at the state. The measures reported by the CHR are standardized and a combination of these data is also used to prepare the reports. A visualization of the CHR system is presented in the following figure: [12].
 |
| Image "County Health Rankings," from the CHR website (Health Rankings main menu), Public Domain. |
As the "County Health Rankings,' image represents, the CHR model is a type of roadmap that can be used to describe that health outcomes depend on a series of community and societal factors reflecting the policies and programs that enhance health. On the top of the graph, the quality of life (indicator) and length of life (also an indicator) represent the health outcomes. Below these health outcomes, the health factors are listed and these include: the physical environment, social and economic factors, clinical care, and health behavior, each major factor has a percent (ranking) assigned, and also has sub-factors or, components that explain the type of physical environment that is measured by the air and water quality of the community and the housing and transit resources also available in the community.[13] In sum, the CHR health ranking model is very useful and highly popular among public health agencies and media outlets that can use it to write their news and reports; but for the public health practitioner, a combination of models or, an expanded version of the Social Determinants of Health is probably the best choice augmented with the Social Ecological Model framework, which provides a robust list of factors that influence the health of the individual and the community as a whole.
The series of models and theoretical frameworks presented above in this book represent major tools that the public health student and professional can use to understand and measure/operationalize the concept of health.
After covering the content above, there is a question that follows: how to use the health indicators information? The general answer to this question is health indicators are used by public health departments to assess the health of a population. Once the assessment is completed, the information is used to prepare health reports that are used by public health organizations, health insurance companies, for research, and among others, also for the media.
Health Data
In the context of this chapter, frequently, when referring to health data, people are not talking about databases that collect and contain raw data, most of the time, it refers to data that had been summarized and analyzed already, and that is available in health reports that contain the health indicators information.
Common health indicators of the health of a population
Contrary to what most people think, the most common available information about the health of a population is not the information about being alive, but the information about who had died and for what reasons, these data is called, mortality data. But to start with a positive side of the picture, the following are examples of common health indicators used in public health:
| Common Health Indicators - United States 2020 | |
|---|---|
| Infant Mortality Rate | 5.4 deaths per 1,000 live births |
| Neonatal (0-27 days of life) Mortality Rate | 3.52 deaths per 1,000 live births |
| Maternal Mortality Rate | 23.8 deaths per 100,000 live births |
| Fertility Rate | 1.6 births per 1,000 women in reproductive age (15-50) |
| Birth rate | 11.91 births per 1000 people |
Note: to prepare the table's content, several websites of information were used to obtain and compare the number. If interested in those sources visit the respective reference (click on the superscript number).[14]
To get an idea how well the United States is doing in the health of its people, take five indicators [from what you have learned in this chapter] and compare with other countries (developed or, in development]. Use the World Bank website to find the information, start for example, with the infant mortality indicator, compare the U.S. with these countries. When reporting your results, elaborate a short summary that include your comments or recommendations.
Applications of the models
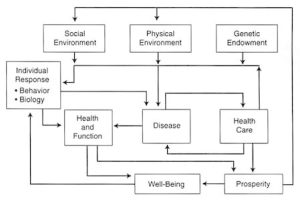
To apply the theoretical concepts learned so far, it can be helpful to identify the factors that affect people's health. One way to do this is to use the Health Field Model developed by Evans and Stoddart (1990). [15]This model groups the determinants of health into interconnected categories that influence the individual's health status and overall well-being. [16]See image below.
 |
| "Social Determinants of Health" Image from the Institute of Medicine (US) Committee on Using Performance Monitoring to Improve Community Health.[17] |
Based on the Health Field Model, the major factors influencing a population's health are the environment (physical and social) and the individual's genetic makeup. [18] These categories are presented in more detail in the following paragraphs.
Social Environment
These factors listed at the top of the above presented flowchart include: family structure, the educational system, social networks, social class, work setting, and level of prosperity. Also, stress (usually classified as psychological) is also part of this category.
Family Structure
Research has found that the structure of a family impacts the physical and mental health of children. Typically, children from single-parent families do not perform as well on measures of development, mental health, and performance when compared to children from two-parent families. The quality of a child's relationship with their parents, level of social support, nurturing, and self-efficacy are all factors that have been shown to influence their physical and mental well-being, as well as their future economic productivity. [19]
Education
Education affects health status separate from its influence on income. Although most research is based on years of formal schooling, evidence suggests a broader relationship that includes the preschool period. An assessment at age 19 of participants in the Perry Preschool Study, which randomized children into a Head Start-like program, showed that participation in the preschool program was correlated with better school performance, attending college, and avoiding involvement with the criminal justice system.[20] Critical periods for education, particularly at young ages, may prove to be important in determining health. In addition, studies show that maternal educational attainment is a key determinant of child welfare and survival. [21]
Social Networks
The term “social networks" refers to an individual's connections with others in their community or institutions. Studies have shown that having more close contact and frequent interactions with others has a strong inverse correlation with mortality from all causes. The pathways responsible for the effects of social networks are not yet completely known. Social networks have a positive impact on health. [22], [23]
Social class
Independent of income, social class is another well-described determinant of health. Several research studies have demonstrated a clear relationship between social class (based on job classification) and mortality. The relationship persists throughout the social hierarchy and is unchanged after adjusting for confounders such as income and smoking. The effect of social class is always a controversial issue in the United States but is important to consider in dealing with issues of health and equity.[24]
Work-related factors
The health effects of work-related factors on cardiovascular mortality have been observed in studies that examine job decision latitude and autonomy. [25] Also, it has been reported that involuntary unemployment negatively affects both mental and physical health. In general, economic prosperity is also correlated with better health. Throughout history, the poor have, on average, died at younger ages than the rich. [26]
Physical Environment
The physical environment has a significant impact on our health and can lead to various diseases. For instance, it can expose us to harmful substances that cause lung diseases or cancers. Furthermore, safety measures at home and work can affect the frequency of injuries. Living in poor housing conditions and overcrowded areas can increase the likelihood of violence, transmission of infectious diseases, and mental health problems. Additionally, there are differences in cancer rates between urban and rural areas. [27]
Genetic Factors
The most common categories of genetic factors include genetic makeup, gender (sex), and age. These group of factors help to are closely related to personal and inborn features of individuals. It is recognized that genetic factors have a significant influence on the health of the individual. Without negating the influences of the environment in a person’s health, in many ways, genetic factors contribute to a greater or lesser to the category of risk factors. There is always controversial to blame genetics for certain behaviors but studies have shown that some behaviors are molded at certain level by genetics without so much without so much influence of the environment, and this has been and will be a controversial health topic. [28]
Behavior
In general behavior is a response that can be found in all the health determinants and it is accepted as an "intermediate" determinant of health. Behavior is shaped by many forces, especially the social and physical environments and genetic factors, as previously described. Behaviors related to health care, such as adherence to treatment regimens, are influenced by these forces as are behaviors that directly influence health, such as smoking cigarettes, or, chronic use of alcohol and other substances. [29]
Health Care
The role of health care as a determinant of health is enormous, access or no access to it can have a tremendous impact in the life of an individual. In general, the improvement in life expectancy in recent decades can be highly attributed to the improvement of health services, curative, or preventive. One of the major health gains has been attributed to the diagnosis and treatment of coronary heart disease and its related factors. [30]
In summary, using the health field model as a way to understand how social determinants influence health is another useful way to apply the concepts learned throughout the content of this chapter. Another way to see the impact of the determinants of health in the United States Population is to look at the leading causes of death and also life expectancy. The first that will be reviewed is the overall trend in mortality in the United States.
United States Leading Causes of Death
Compared to the previous century, in the almost first quarter of the 21st Century, the United States had seen a significant change in the leading causes of death, this is presented in the table included below. [31]
| Ten Leading Causes of Death in the United States | Numbers (per 100,000 population) |
|---|---|
| 1. Heart disease | 696,962 |
| 2. Cancer | 602,350 |
| 3. COVID-19 | 350,831 |
| 4. Accidents (unintentional injuries) | 200,955 |
| 5. Stroke (cerebrovascular diseases) | 160,264 |
| 6. Chronic lower respiratory diseases | 152,657 |
| 7. Alzheimer’s disease | 134,242 |
| 8. Diabetes | 102,188 |
| 9. Influenza and pneumonia | 53,544 |
| 10. Nephritis, nephrotic syndrome, and nephrosis | 52,547 |
As happens with most developed (High-income countries) nations, since the past century, the United States has experienced a decline in the number of infectious diseases with an increase in the number of non-communicable (Non-infectious) diseases. The pattern has been recently affected by the COVID-19 pandemic, however, in general, the decrease in the rate of infectious diseases in the nation has been significant due to access to vaccines, drugs (antimicrobials and antivirals), and prevention, especially sanitation and health education. [32]Access to health education has been one of the greater factors in addressing the root causes of the problem by providing educational messages that address the main risk factors associated with the leading causes of death. When the leading causes of death and their associated risk factors are compared, the situation makes a lot of sense.
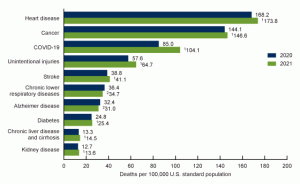 |
| "Age-adjusted death rate for the 10 leading causes of death in 2021: United States, 2020 and 2021," image from the National Center for Health Statistics (NCHS), CDC. |
Although the leading causes of death in the United States have been also affected by COVID-19, the major causes of death continue to be Heart Disease and Cancer, which points to the need for prevention and more prevention. Even with the advancement of diagnosis technology, drugs, and related measures, the best way to approach the situation is to prevent, which is easier to say than to do it because without investing in health education and promotion, health education interventions fall short due to the number of venues that are competing with health message posted by everyday social media outlets and companies that invest millions of dollars in their products, which the public health system with its limited allocated budget just cannot compete with the market at a very modest level, because health education and promotion done effectively is not cheap. A message that should resonate in the heads of politicians and policymakers who decide how much budget is allocated to public health. More political will is needed in the United States to invest in health.
The factors behind the numbers
Although looking at the leading causes of death helps to get a picture of the main diseases and health problems that are contributing to the mortality of the U.S. population, it is considered also important to look at what I call, "the factors behind the numbers," this is also known as underlying factors of death. Starting with the number one cause of death in the United States, heart disease continues to be the number one killer, what are the factors behind this problem? The factors behind dying from heart disease are preventable factors such as smoking, lack of physical activity, and diet, especially a low-fat and high-fiber content diet. About the second cause of death, cancer, although there are several associated risk factors, early detection, and prompt treatment contributes significantly to the survival of a person suffering from cancer. And, for every mentioned leading cause of death, a similar list of risk factors including lifestyle and behavior factors can be identified as contributing factors, which help to explain the numbers.
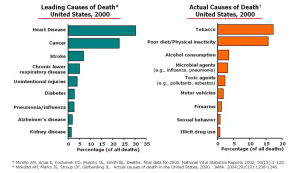 |
Let's Interact with the data...
The information about the Ten major causes of Death in the U.S. is useful, but not that useful if we don't look at what is, in reality, killing people in the U.S., what are the factors behind these numbers? More specifically, what are the health factors (use the image of the Community Health Rankings-CHR model), environmental (from the Social Ecological Model), policies and regulations (from more than one model listed in this chapter), gender, racial issues, income, occupation, etc. (to refer to the Social Determinants of Health), etc. that are contributing to these health problems? Think about it and make a list of some of these factors.
Life Expectancy and health equity in the U.S. population
It is important to note that the same factors (or, health determinants) that are associated with the leading causes of death have also an impact on life expectancy in the United States. The country has seen great improvement in terms of natality (who is born) and mortality (who dies), reducing both significantly since the previous century. Although the COVID pandemic affected the U.S. life expectancy at birth experienced a drop to 76.1 in 202 compared to 79 years in 2019. During 2020 and 2021, COVID-19 became the main cause for about 50 percent. [34] No major changes were reported in 2022 but by the year 2023, the life expectancy rises again to about 79.11 years.[35] Although it is not as recent as the numbers presented above, the following is an image that helps to visually, the topic of life expectancy in the U.S.[36]
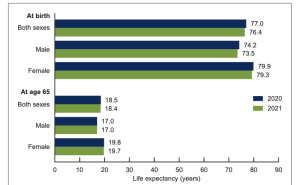 |
| "Life expectancy at birth and age 65, by sex: United States, 2020 and 2021," Image from the National Center for Health Statistics (NCHS), CDC. |
Is Life Expectancy the same for all people in the U.S.?
The answer to this question is no. Life expectancy in the United States is not the same for everyone, there are several inequalities in life expectancy being the most notorious, the differences between the rich and the poor, and those also separated by race/ethnicity and income. In addition, there is also the gender gap which is the fact that women tend to live longer compared to men, but this is not all good news because it has been found that also, inequalities in life expectancy widen for women. Also, life expectancy changes significantly by age, being one of the most significant, life expectancy at birth and infant mortality rates. It is not enough to talk about living longer in the United States without addressing these mentioned issues, and that is the main purpose of this section. More of these mentioned examples will be discussed in the following paragraphs.
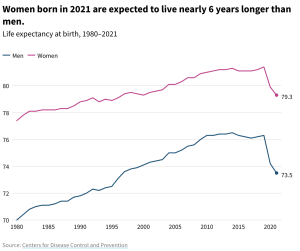 |
| “Life expectancy for men and women,” image from CDC, Public domain. |
Health Equity
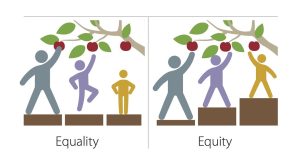
If life expectancy in the United States is not the same for everyone, this brings another reality, the lack of equity in health. What is health equity? Health equity means the attainment of the highest level of health for all people, where everyone has a fair and just opportunity to attain their optimal health regardless of race, ethnicity, disability, sexual orientation, gender identity, socioeconomic status, geography, preferred language, or other factors that affect access to care and health outcomes. [37]. To better understand the issue of health equity is useful to look at examples of health inequality, which will be covered as follows.
 |
| “Equality vs Equity”, image from Flickr, Licensed CC BY-NC 2.0 DEED. |
Inequalities in Life Expectancy
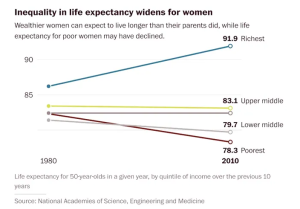
The case of women: several inequalities in life expectancy for women have been observed. The main factor associated with these inequalities is income, wealthier women tend to live longer [38]
 |
| "Inequalities in life expectancy widens for women," image from a publication in The Daily Herald. |
Another example is the health expectancy inequality observed by age. Researchers at Stanford University in the U.S. reported that when the inequality in life expectancy is measured in a population, the graph does not follow the normal distribution, on the contrary, there is nothing less than normal, which means that when the data is presented in a graph, the distribution of life expectancy in the U.S. shows the inequality that exists. [39] See the image presented as part of the mentioned publication:
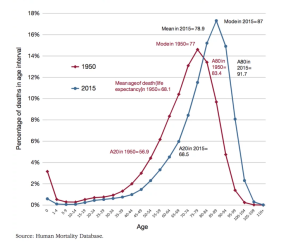 |
| "Distribution of Death at Age in the United States, 1950 and 2015." Image from the Stanford Institute for Economic and Policy Research (SIEPR). The figure above shows the age distribution of deaths in 1950 and 2015. For 2015, the mean is 79 years, but the mode (the most frequent age of death) is 87. It would be equal to the mean if the distribution were normal. According to 2015 age-specific mortality rates, almost 60 percent of the 2015 birth cohort will live past 80, while more than 20 percent will die before 70. |
The above presented health inequalities have been also observed in other population indicators such as race/ethnicity, social class, access to care, etc. All of this information is very useful especially for the development of public health policies that address the issues at the state and federal level.
Summary
This chapter has covered several concepts that consider public health fundamentals. The first has been the critical review of the definitions of health, starting with the World Health Organization (WHO) initial (1948) definition and its subsequent update in 1986 and a review of other definitions found in the public health literature. After the mentioned content, the chapter covered the importance of measuring health (how do we measure health?), and the use of health indicators as practical tools to assess and measure health. The content continues with a general overview of models used to understand the health status of the population as a practical application of measuring health. The models included in the chapter include the social determinants of health, the socio-ecological model, and the health field model as an integration of both. Applications of the models were also covered, and the chapter ends with the leading causes of death in the United States, life expectancy, and health equity.
- World Health Organization (WHO). (2006, Oct 9). Constitution of World Health Organization. From https://www.who.int/publications/m/item/constitution-of-the-world-health-organization ↵
- [footnote]Felman, A. (2020, April 19). What is good health? Medical News Today. From https://www.medicalnewstoday.com/articles/150999 ↵
- The Lancet Editorial. (2009, March 7). What is health? The ability to adapt, 373(9666),781. From https://www.thelancet.com/journals/lancet/article/PIIS0140-6736(09)60456-6/fulltext Or directly from the DOI information: https://doi.org/10.1016/S0140-6736(09)60456-6 ↵
- Oxford Dictionary. (n.d.). Oxford Languages and Google dictionaries. From https://languages.oup.com/google-dictionary-en/ ↵
- Wright, J., Williams, R., & Wilkinson, J. R. (1998). Development and importance of health needs assessment. BMJ (Clinical research ed.), 316(7140), 1310–1313. https://doi.org/10.1136/bmj.316.7140.1310 ↵
- CDC. (n.d.). Social Determinants of Health: Know what affects health. From https://www.cdc.gov/socialdeterminants/ ↵
- [footnote]Felman, A. (2020, April 19). What is good health? Medical News Today. From https://www.medicalnewstoday.com/articles/150999 ↵
- No author. (n.d.). United States Census Bureau. From https://www.census.gov/ ↵
- Healthy People 2030. From https://health.gov/healthypeople ↵
- U.S. Dept. of Health and Human Services (HHS) Office of Disease Prevention and Health Improvement (ODPHP). (n.d.). Healthy People 2030. From https://health.gov/healthypeople ↵
- Healthy People 2030. (n.d.). Use Healthy People 2030 in Your Work. From https://health.gov/healthypeople/tools-action/use-healthy-people-2030-your-work ↵
- No author. (n.d.). County Health Rankings and Roadmaps (CHR). From https://www.countyhealthrankings.org/ ↵
- Stiefel, M. C., Straszewski, T., Taylor, J. C., Huang, C., An, J., Wilson-Anumudu, F. J., & Cheadle, A. (2020). Using the County Health Rankings Framework to Create National Percentile Scores for Health Outcomes and Health Factors. The Permanente journal, 25, 1. https://doi.org/10.7812/TPP/20.012 ↵
- For the table on common health indicators Visited websites: World Bank Data: https://data.worldbank.org/indicator/SP.DYN.IMRT.IN CDC Infant Mortality: https://www.cdc.gov/reproductivehealth/maternalinfanthealth/infantmortality.htm Maternal Mortality: https://www.cdc.gov/nchs/data/hestat/maternal-mortality/2020/maternal-mortality-rates-2020.htm Births and Natality: https://www.cdc.gov/nchs/fastats/births.htm Fertility Rate: https://data.worldbank.org/indicator/SP.DYN.TFRT.IN ↵
- Evans, R.G., Stoddar, G.L. (1990). Producing Health, Consuming Health Care, Social Science and Medicine 31:1359. ↵
- Durch JS, Bailey LA, Stoto MA, editors. (1997). Improving Health in the Community: A Role for Performance Monitoring. Washington (DC): National Academies Press (US), 2, Understanding Health and Its Determinants. Available from: https://www.ncbi.nlm.nih.gov/books/NBK233009/ ↵
- "Social Determinants of Health" Image from the Institute of Medicine (US) Committee on Using Performance Monitoring to Improve Community Health. Durch JS, Bailey LA, Stoto MA, editors. (1997). Improving Health in the Community: A Role for Performance Monitoring. Washington (DC): National Academies Press (US), 2, Understanding Health and Its Determinants. Available from: https://www.ncbi.nlm.nih.gov/books/NBK233009/ ↵
- Institute of Medicine. 1996. Using Performance Monitoring to Improve Community Health: Conceptual Framework and Community Experience. Washington, DC: The National Academies Press. https://doi.org/10.17226/5514. ↵
- Behere, A. P., Basnet, P., & Campbell, P. (2017). Effects of Family Structure on Mental Health of Children: A Preliminary Study. Indian journal of psychological medicine, 39(4), 457–463. https://doi.org/10.4103/0253-7176.211767 ↵
- Social Programs that Work. (n.d.). The Perry Preschool Project. From https://evidencebasedprograms.org/programs/perry-preschool-project/#_ftn1 ↵
- Zajacova, A., & Lawrence, E. M. (2018). The Relationship Between Education and Health: Reducing Disparities Through a Contextual Approach. Annual review of public health, 39, 273–289. https://doi.org/10.1146/annurev-publhealth-031816-044628 ↵
- Several literature sources on the “social network” topic can be found at https://www.sciencedirect.com/topics/agricultural-and-biological-sciences/social-network ↵
- Cohen, S., Brissette, I., Skoner, DP. Doyle, WJ. (2000). Social Integration and Health: The Case of the Common Cold. Journal of Social Structure, 1. From https://www.cmu.edu/joss/content/articles/volume1/cohen.html ↵
- Wami, W., McCartney, G., Bartley, M. et al. (2020). Theory driven analysis of social class and health outcomes using UK nationally representative longitudinal data. Int J Equity Health 19, 193. https://doi.org/10.1186/s12939-020-01302-4 ↵
- Karasek, R., Baker, D., Marxer, F., Ahlbom, A., & Theorell, T. (1981). Job decision latitude, job demands, and cardiovascular disease: a prospective study of Swedish men. American journal of public health, 71(7), 694–705. https://doi.org/10.2105/ajph.71.7.694 ↵
- Macassa, G., Rodrigues, C., Barros, H., & Marttila, A. (2021). Experiences of involuntary job loss and health during the economic crisis in Portugal. Porto biomedical journal, 6(1), e121. https://doi.org/10.1097/j.pbj.0000000000000121 ↵
- EPA (Environmental Protection Agency). (2023). What are the trends in human disease and conditions for which environmental contaminants may be a risk factor? From https://www.epa.gov/report-environment/disease-and-conditions ↵
- Hernandez LM, Blazer DG, editors. (2006). Genes, Behavior, and the Social Environment: Moving Beyond the Nature/Nurture Debate. Washington (DC): National Academies Press (US), 3, Genetics and Health. Available from: https://www.ncbi.nlm.nih.gov/books/NBK19932/ ↵
- Institute of Medicine. 1996. Using Performance Monitoring to Improve Community Health: Conceptual Framework and Community Experience. Washington, DC: The National Academies Press. https://doi.org/10.17226/5514. ↵
- Durch JS, Bailey LA, Stoto MA, editors. (1997). Improving Health in the Community: A Role for Performance Monitoring. Washington (DC): National Academies Press (US), 2, Understanding Health and Its Determinants. Available from: https://www.ncbi.nlm.nih.gov/books/NBK233009/ ↵
- CDC. (n.d.). Leading Causes of Death 2020. From https://www.cdc.gov/nchs/fastats/leading-causes-of-death.htm ↵
- Xu JQ, Murphy SL, Kochanek KD, Arias E. (2022). Mortality in the United States, 2021. NCHS Data Brief, 456. Hyattsville, MD: National Center for Health Statistics. DOI: https://dx.doi.org/10.15620/ cdc:122516. ↵
- CDC. (March 9, 2004). Physical Inactivity and Poor Nutrition Catching up to Tobacco as Actual Cause of Death. From https://www.cdc.gov/media/pressrel/fs040309.htm ↵
- Fleck, A. (Sep 1, 2022). U.S. Life Expectancy Hits Lowest Point Since 1996. Statista HEALTH. From https://www.statista.com/chart/20673/us-life-expectancy-higher/ ↵
- Macrotrends. (n.d.). U.S. Life Expectancy 1950-2024. From https://www.macrotrends.net/countries/USA/united-states/life-expectancy#:~:text=The%20current%20life%20expectancy%20for,a%200.08%25%20increase%20from%202021. ↵
- Xu JQ, Murphy SL, Kochanek KD, Arias E. (2022). Mortality in the United States, 2021. NCHS Data Brief, 456. Hyattsville, MD: National Center for Health Statistics. DOI: https://dx.doi.org/10.15620/ cdc:122516. ↵
- Centers for Medicare and Medicaid Services (CMS). (n.d.). Health equity. From https://www.cms.gov/pillar/health-equity ↵
- The Daily Herald. (Sept. 19, 2025). The expanding gap in life expectancy between the rich and the poor. From https://www.columbiadailyherald.com/story/news/local/2015/09/19/the-expanding-gap-in-life/25695073007/ ↵
- Fuchs, V.R., Eggleston, K. (April 2028). Life Expectancy and Inequality in Life Expectancy in the United States. Stanford Institute for Economic and Policy Research (SIEPR). From https://siepr.stanford.edu/publications/policy-brief/life-expectancy-and-inequality-life-expectancy-united-states ↵
an old English word for disease.
when and individual suffer physical harm or damage, for example, a work related injury.
In a tangible (that can be quantified for example) way. This helps since a lot of what we know as health, is very subjective.
One common way to measure health is to use certain health indicators that can be quantified or, assessed in a manner that provides specific results that can be used to get an overall idea of the health of an individual and in some cases, of a population as it is the case in public health, which studies population health.
A concept or, framework that is used to explain how the interaction among several factors (individual, community, education, access to health care, social context, etc) promote or, contribute to the health of an individual or, community.
It is a commonly use model in public health, and it is composed of a series of domains or, categories that include: the individual, relationships, community and society.
those institutions and programs that are available to the individual to promote its health and well-being.
a term used to represent the role of the community in shaping the individual.
those policies and health laws and regulations that are available to the individual to promote its health and well-being.
World Health Organization
It is often referred as, just 'Census,' or, 'National Census,' which reflects collected information about the entire population of the United States, and it is done every 10 years.
A document that contains the healthy objectives for the nation. It visualizes where do we want to be in the next decade (10 years) in the country.
CHR = County and Health Ranking Roadmaps (CHR) model of Health Determinants
put into practice or, use. For example, designing a research project, writing a grant proposal for funding, etc.
Data that has not been summarized or analyzed, it is usually data that has been cleaned of errors, and it is available for analysis.
summarized data refers to data that is available in the form of counts, rates, ratios, and other statistical methods of presenting data.
It is model that groups the determinants of health into interconnected categories that influence the individual's health status and overall well-being.
