7.4 Water Consumption and Scarcity
Water Consumption and Scarcity
Water Use
Freshwater is used in a variety of ways. The way most people think of first is as everyday domestic use (washing dishes, brushing your teeth, drinking, etc.) which is often supplied by a public water supply. Other uses include industrial uses (manufacturing of consumer goods, washing of equipment, etc.), mining, water for livestock, water for aquaculture, energy production, manufacturing, and irrigation (agriculture).
Consider, for example, these approximate water requirements for some things people in the developed world use every day
- one tomato = 3 gallon
- one kilowatt-hour of electricity from a thermoelectric power plant = 21 gallons
- one loaf of bread = 150 gallons
- one pound of beef = 1,600 gallons
- one ton of steel = 63,000 gallons
Human beings require only about 1 gallon per day to survive. Still, a typical person in a U.S. household uses approximately 100 gallons per day, which includes cooking, washing dishes and clothes, flushing the toilet, and bathing. The water demand of an area is a function of the population and other uses of water.
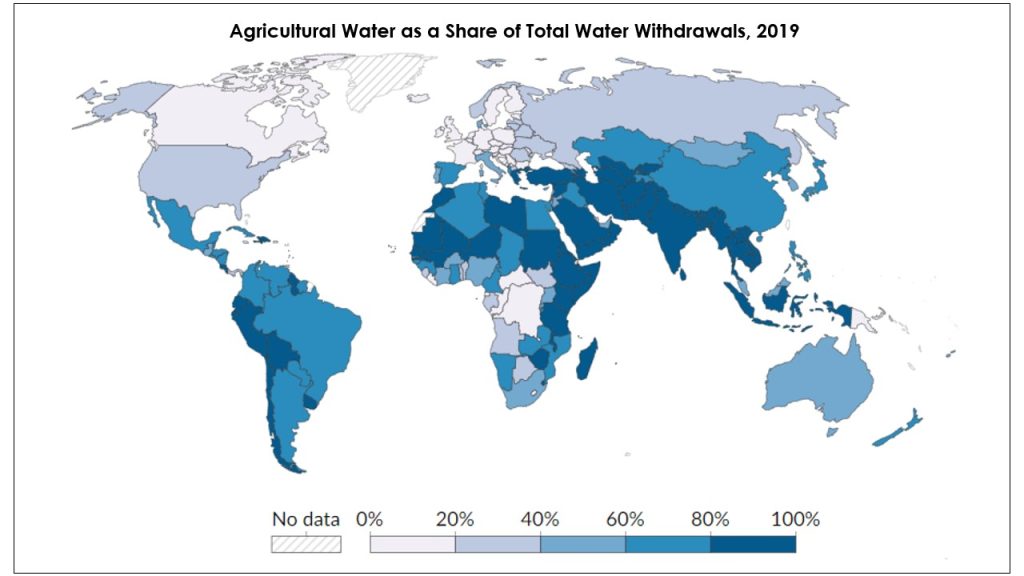
Globally, the largest use of freshwater is for irrigation purposes. On average 70% of all water usage is used for irrigation, however, that varies significantly by country (Figure 1) and income level. Low-income countries use on average 90% of water withdrawals for agriculture, while middle-income countries use 79%, and high-income countries use only 41%.
Freshwater usage has changed over time in the United States. The total volume of water being used for irrigation has stayed about constant since the mid-1950s, but the percentage of total water used for irrigation has declined since that time. In the 1950s the US used about the world average of 70% of its water for irrigation, but this declined as thermoelectric water usage increased and reached a peak in the 1970s through 2000s (Figure 2). Presently between 40-50% of water usage is irrigation.
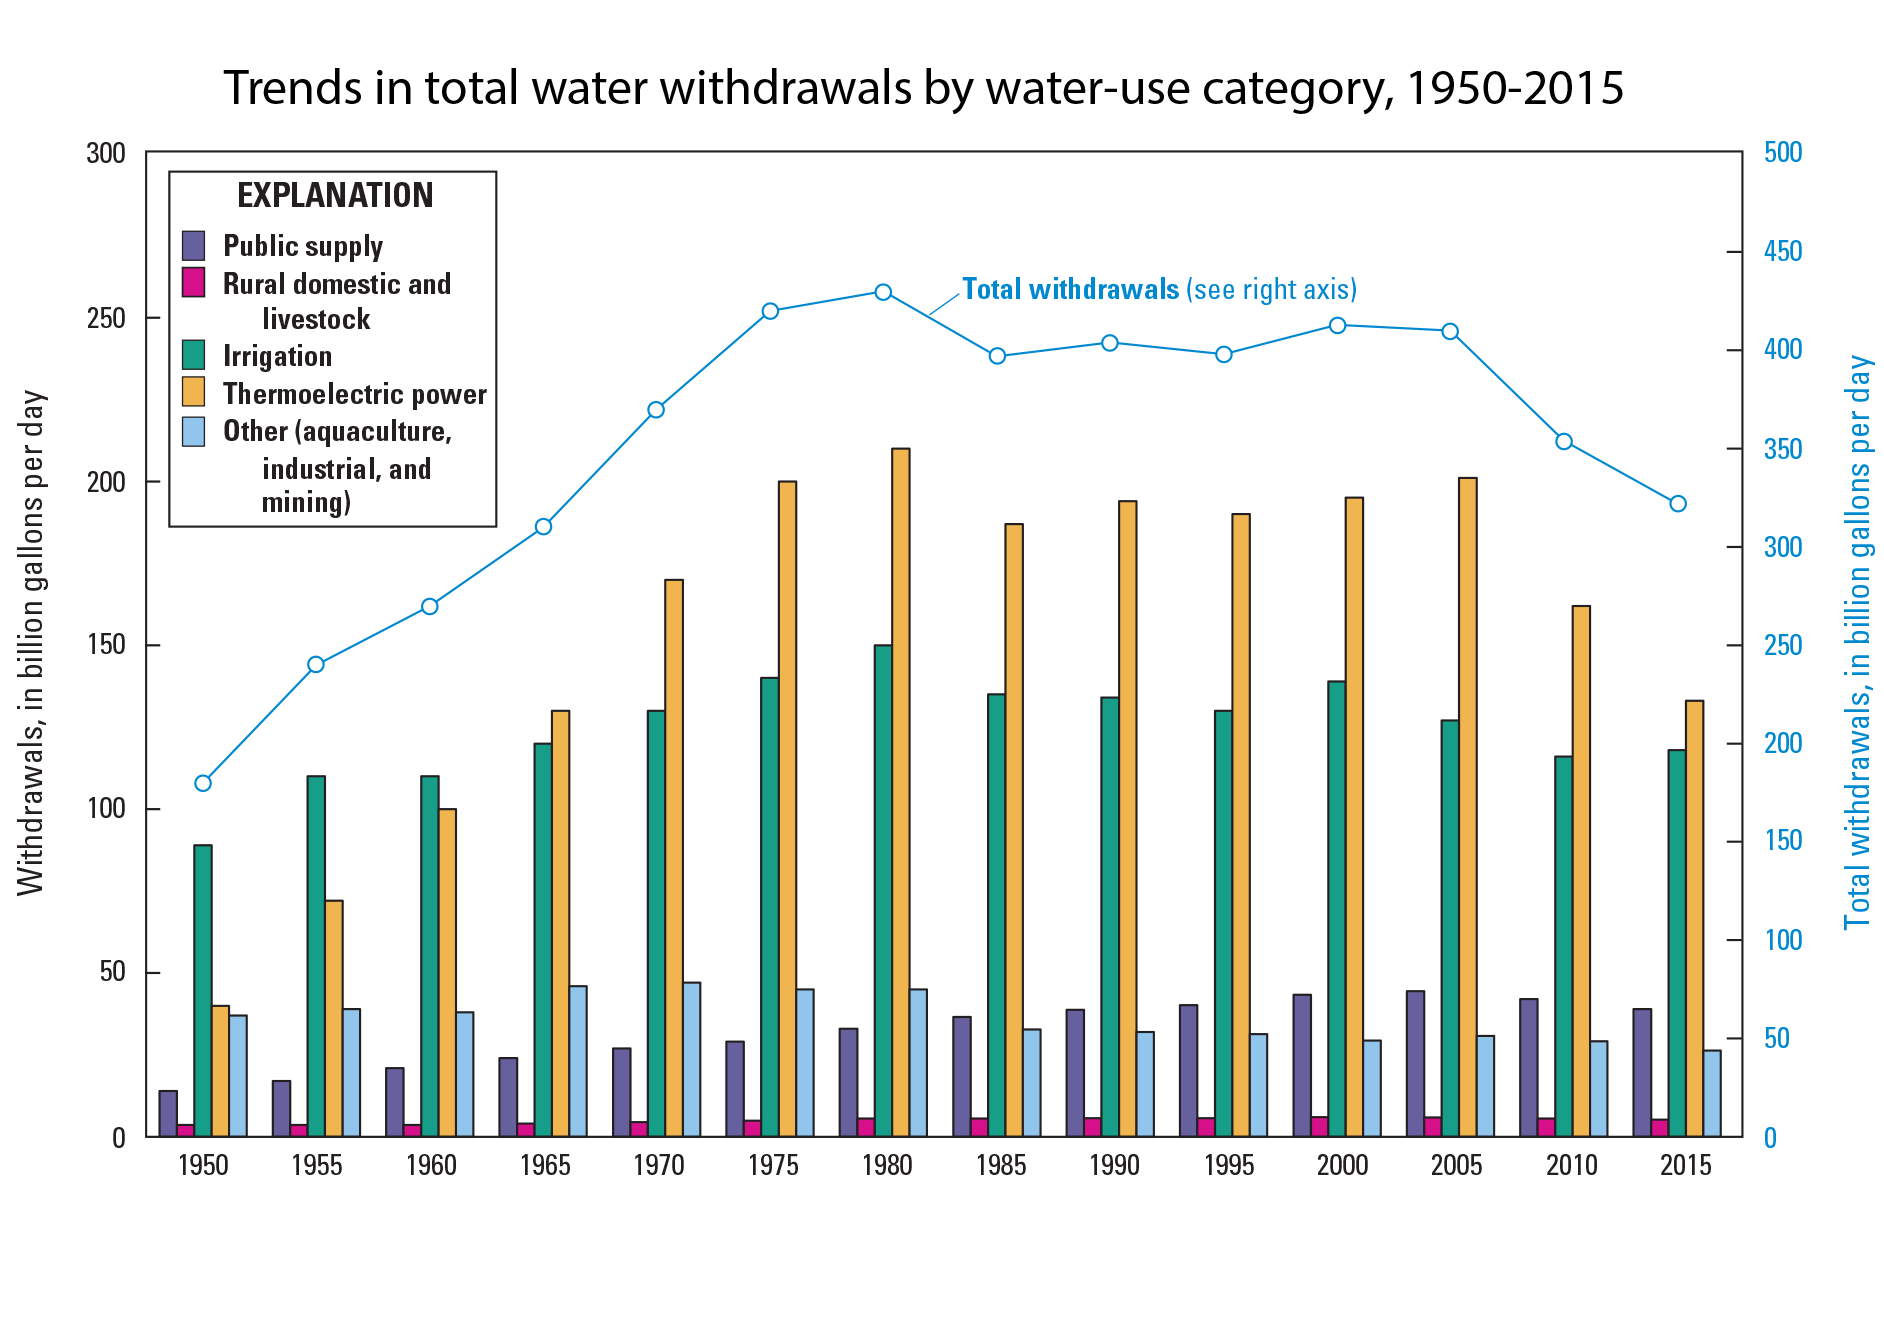
Thermoelectric water is water used in electricity production facilities (i.e., a coal fired power plant) for cooling purposes – this is not the same as a hydroelectric facility. The overall declines in water use since the mid-2000s have mainly been a result of a changing energy supply in the United States. As the US has shifted from coal fired power plants to natural gas and renewables as main sources of power, this has created a decreased need for cooling water (powerplant cooling water needs for natural gas are less than coal and many renewables require no cooling water at all).
Water Scarcity
Water scarcity is already a major issue for the planet and will only get worse as climate change causes more changes to water availability (i.e., droughts), which then affects agriculture and food availability. The world demand for water is expected to increase significantly in the coming decades as growing populations drive increased consumption. However, the availability of water is finite, so it is not clear how this increased need for water can be met, particularly with climate change making some areas of the world wetter and others drier causing different regions to face increasing floods and droughts, respectively.
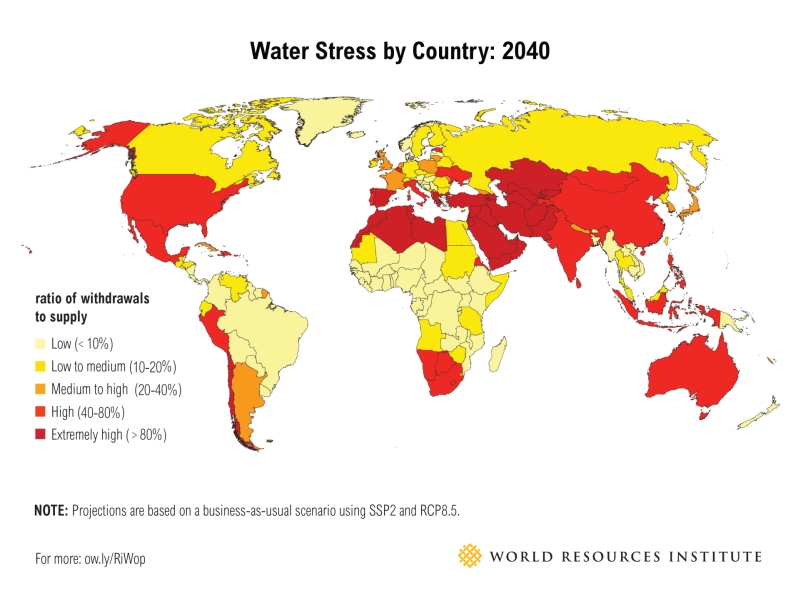
Figure 3 is a world map color coded to show water stress (measured by water usage compared to water availability) by country in 2040 if no changes are made regarding water usage and human impact on climate change. An estimated 3.2 billion people (46% of the global population) live under water stressed conditions for at least 1 month of the year every year. But this water stress is not distributed equally around the globe; around 80% of the water stressed population lives in Asia, dominantly in India, Pakistan, and northern China.
Poor and marginalized groups are typically the first to feel the effects of water stress, as the ability to access clean water is often more difficult for these groups due to rising costs and lack of water infrastructure systems. This directly impacts the ability to maintain good health, protect families, or even earn a living. For women and girls in some areas of the world, water scarcity means a longer walk to collect fresh water, potentially putting them in unsafe conditions or precluding them from having time for work or education. Lack of easily accessible water can be particularly harmful for pregnant women and babies.
Balancing future water needs for the natural environment and humans will become more challenging as changes to climate, changing demographics (increasing size of urban centers), and changing socioeconomic conditions drive changes in water availability and water use. Ensuring these needs and the needs for agricultural water require sustainability practices to be emplaced.
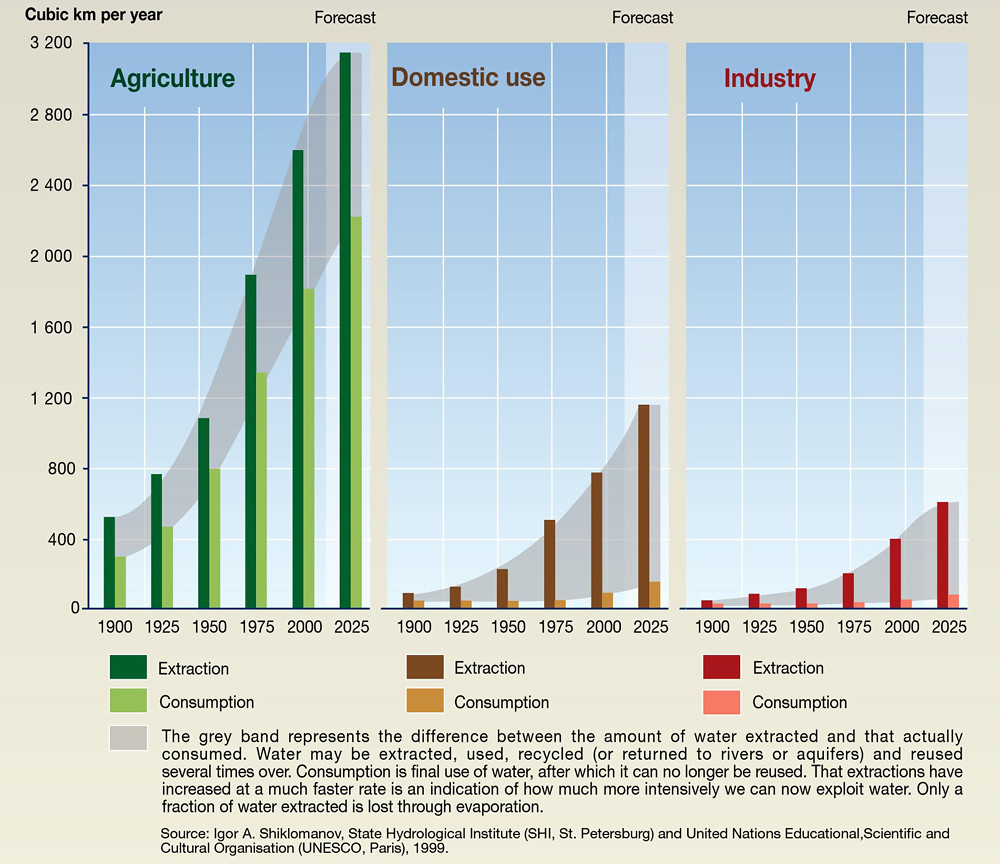
Global total water use is steadily increasing at a rate greater than world population growth. During the 20th century global population tripled, and water demand grew by a factor of six. The increase in global water demand beyond the population growth rate is due to an improved standard of living without an offset by water conservation. Increased production of goods and energy entails a large increase in water demand. The major global water uses are irrigation (68%), public supply (21%), and industry (11%).

The Aral Sea is a lake located east of the Caspian Sea between Uzbekistan and Kazakhstan in central Asia. This area is part of the Turkestan desert, which is the fourth largest desert in the world; it is produced from a rain shadow effect by Afghanistan’s high mountains to the south. Due to the arid and seasonally hot climate, there is extensive evaporation and limited surface waters. Summer temperatures can reach 60οC (140οF)! The Aral Sea’s water supply is mainly from the Amu Darya and the Syr Darya, which carry snowmelt from mountainous areas. In the early 1960s, the then-Soviet Union diverted the Amu Darya and Syr Darya Rivers for irrigation of one of the driest parts of Asia to produce rice, melons, cereals, and especially cotton. The Soviets wanted cotton or white gold to become a major export. They were successful, and today Uzbekistan is one of the world’s largest exporters of cotton. Unfortunately, this action eliminated any river inflow to the Aral Sea and caused it to disappear almost completely.

In 1960, the Aral Sea was the fourth largest inland water body; only the Caspian Sea, Lake Superior, and Lake Victoria were larger. Since then, it has progressively shrunk due to rivers’ evaporation and lack of recharge. Before 1965, the Aral Sea received 2060 km3 of fresh water per year from rivers, and by the early 1980s, it received none. By 2007, the Aral Sea shrank to about 10% of its original size, and its salinity increased from about 1% dissolved salt to about 10% dissolved salt, which is three times more saline than seawater. These changes caused an enormous environmental impact. A once thriving fishing industry is dead, as are the 24 species of fish that used to live there; the fish could not adapt to the more saline waters. The current shoreline is tens of kilometers from former fishing towns and commercial ports. Large fishing boats lie in the dried-up lakebed of dust and salt. A frustrating part of the river diversion project is that many irrigation canals were poorly built, allowing abundant water to leak or evaporate. An increasing number of dust storms blow salt, pesticides, and herbicides into nearby towns, causing various respiratory illnesses, including tuberculosis.

The wetlands of the two river deltas and their associated ecosystems have disappeared. The regional climate is drier and has greater temperature extremes due to the absence of moisture and moderating influence from the lake. In 2003, some lake restoration work began on the northern part of the Aral Sea, and it provided some relief by raising water levels and reducing salinity somewhat. The southern part of the Aral Sea has seen no relief and remains nearly completely dry. The destruction of the Aral Sea is one of the planet’s biggest environmental disasters caused entirely by humans. Lake Chad in Africa is another example of a massive lake nearly disappearing for the same reasons as the Aral Sea. The Aral Sea and Lake Chad are the most extreme examples of large lakes destroyed by unsustainable diversions of river water. Other lakes that have shrunk significantly due to human water diversions include the Dead Sea in the Middle East, Lake Manchar in Pakistan, and Owens Lake and Mono Lake in California.
Attribution:
Portions of this section are cloned from:
- Introduction to Environmental Sciences and Sustainability, by Emily P. Harris, University of West Florida, published using Pressbooks, under a CC BY (Attribution) license.
- Environmental Geology, by Lindsay J. Iredale, Normandale Community College, published using Pressbooks, under a CC BY-NC.SA 4. (Attribution-NonCommercial-ShareAlike 4.0 International; https://creativecommons.org/licenses/by-nc-sa/4.0/) .
Media Attributions
- Private: Ag water usage worldwide
- test_wtr17-00-2011-fig.16
- Private: water stress US
- 32363106455_feaa116cae_b
