"

7.2 The Hydrological Cycle

The Hydrologic Cycle (AKA: Water Cycle)

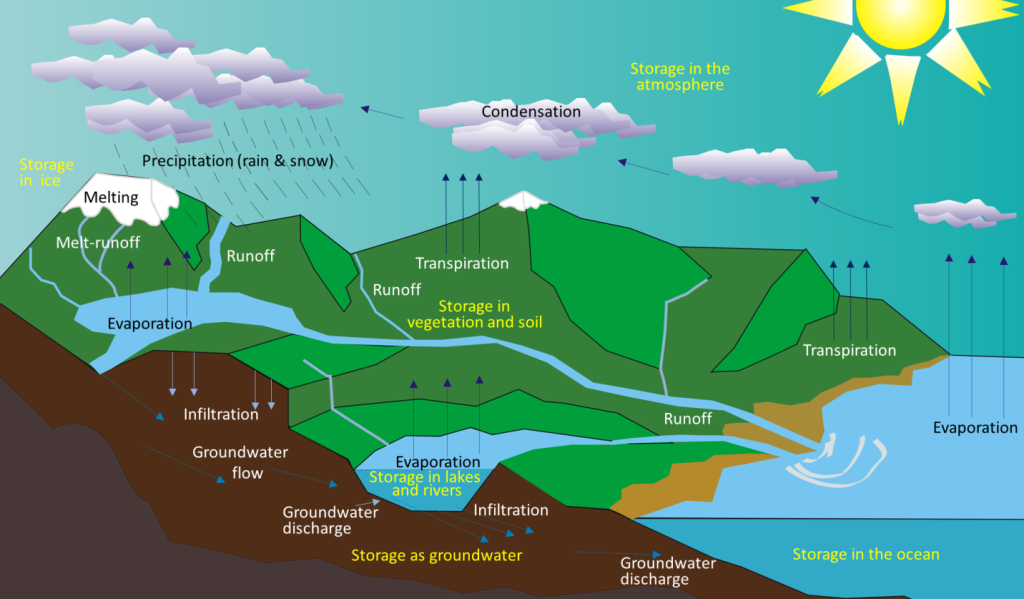
All water on the planet is connected through the hydrologic cycle. This cycle is a closed system, which means the volume of water on the planet today is the same as it always has been. No new water has been introduced to the planet and water has not left either – it has just changed where it is located and the form it has. 

Stores are locations where water “sits” in the hydrologic cycle. Flows are the processes that move water from one store to the next.

Water on the planet is constantly on the move. It travels from one location (called a reservoir or store) to the next through processes called flows. It is evaporated from the oceans, lakes, streams, the surface of the land, and plants (transpiration). It is transported in its gaseous form through the atmosphere by the wind and condenses to form clouds of water droplets or ice crystals. It falls to the Earth’s surface as rain or snow (precipitation) and flows through streams, into lakes, and eventually back to the oceans. Surface water, including water in streams and lakes,  infiltrates the ground to become groundwater, a process called infiltration. Groundwater slowly flows through soils, surficial materials, and pores and cracks in the rock, a process called percolation. The groundwater flow paths can intersect with the surface and the water can then move back into streams, lakes and oceans or be taken up by soil and plants (Figure 1).


Illustration of the stores and flows in the water cycle. Ocean water evaporates to become atmosphere water which condenses to become precipitation (rain and snow) which falls on the ground and becomes surface water (streams and lakes) or glacial ice. Surface water either runs off into oceans, is evaporated into the atmosphere or infiltrates into soil or groundwater. Ice can melt and runoff into surface water or infiltrate into soil or groundwater. Groundwater flows and discharges into surface water or oceans. Vegetation and soil store water that has been taken up (plant uptake) from groundwater or surface water water in the soil. Plants transpire to return water to the atmosphere.
Figure 1. The various components of the water cycle. Black or white text (accompanied by arrows) indicates the movement or transfer of water from one reservoir to another (flows). Yellow text indicates the storage of water (stores) Source: Steven Earle (2015), CC BY-SA 3.0. Found here.

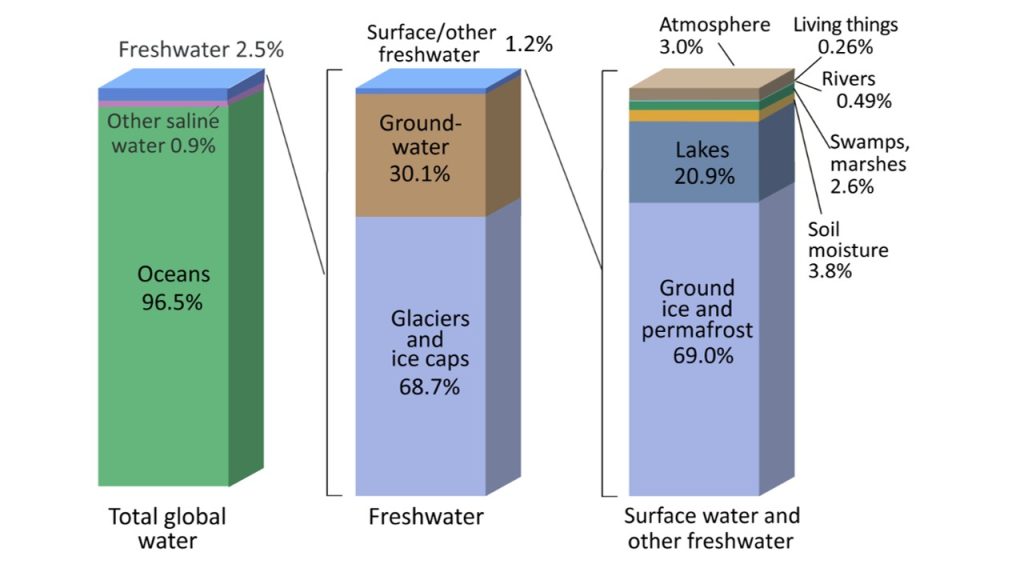
There are 332.5 million cubic miles of water on the planet and most of this is salt water (the oceans hold close to 97% of all water on the planet). Of the total freshwater, over 68 percent is locked up in ice and glaciers. Another 30 percent of freshwater is in the ground. Fresh surface-water sources, such as rivers and lakes, only constitute about 22,300 cubic miles (93,100 cubic kilometers), which is about 1/150th of one percent of total water. Yet, rivers and lakes are the sources of most of the water people use every day (Figure 2).


Three bar graphs showing water storage on the planet as described in the figure caption.
Figure 2. Bar charts showing percentages of where water exists on the planet. Left Bar: All water on the planet, 96.5% is oceans, 2.5% is freshwater, and the remaining 1% is saline lakes and groundwater. Center Bar: Breakdown of the freshwater portion of global water. 68.6% is frozen, 30.1% is groundwater, 1.3% is surface water and other freshwater. Right Bar: Breakdown of the surface and other freshwater portion of global water. The majority, 73.1%, is frozen as ice and snow, lakes have 20.1%, and rivers have only 0.49% even though rivers are where humans get most of their freshwater from. Source: USGS. Public Domain. Found here.

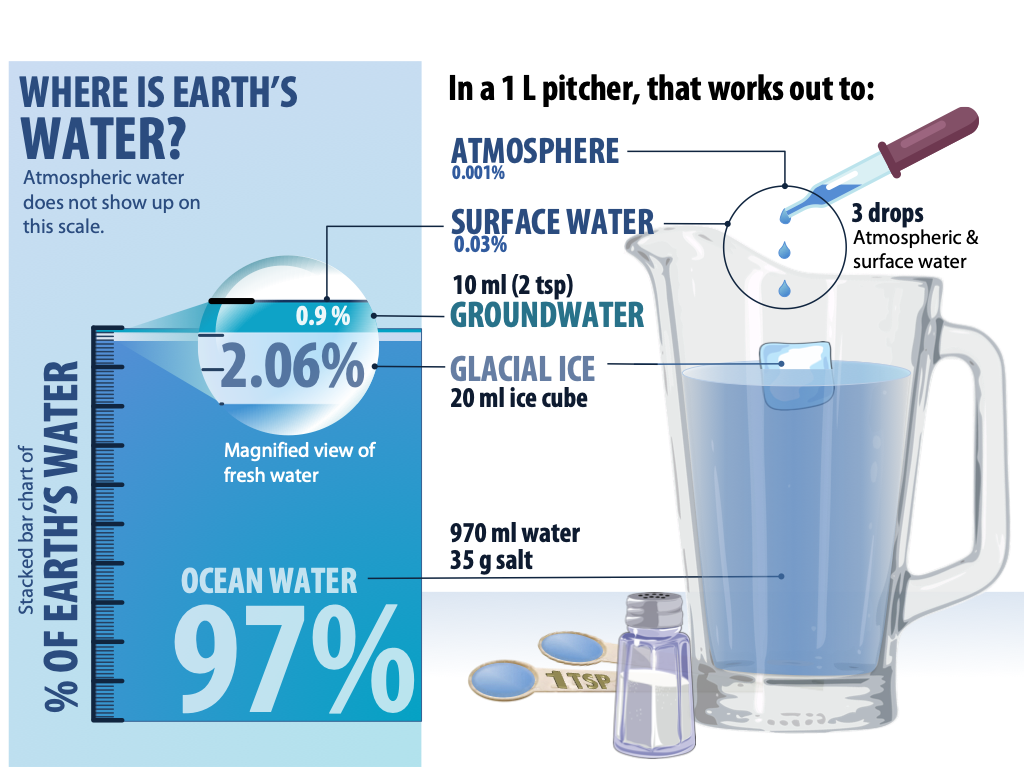
To put these percentages in perspective, pretend a one liter (1000 ml or about 4 cups) jug of water represents the entirety of Earth’s water supply (Figure 3). The 970 ml in the jug is all the saltwater on Earth. One regular sized ice cube (~20 ml) represents frozen freshwater (glaciers/ice caps), and two teaspoons (~10 ml) are groundwater. All the visible surface water on the planet (lakes/rivers/streams) is represented by the three drops of water being added by the eyedropper. The saltwater, frozen water, and most of the groundwater is not easily accessible/readily available water, which is why humans mainly rely on surface freshwater, which is only a tiny fraction of Earth’s water resources. This is why taking care to keep our water resources clean and use them sustainably is so important!

Illustration to visualize the relative amounts of water in each store of the hydrologic cycle as described in the text and figure caption.
Figure 3. All of Earth’s water in a 1 liter container: the small ice cube represents all the frozen water on the planet, two teaspoons represents the groundwater, and three drops represents all fresh water in lakes, streams, and wetlands, plus all atmospheric water. Left: Earth’s water reservoirs shown in a stacked bar chart. Source: Earth’s water reservoirs shown in a stacked bar chart, and using the analogy of a 1 L pitcher. Source: Karla Panchuk (2021), CC BY-SA 4.0. Found here.


Water Diversion, Retention, and Withdrawal

Humans have found the need to divert or store water for a variety of reasons. The implications of this on water supply and ecosystems is immense. Here we will just briefly touch upon some of the major aspects of these practices.

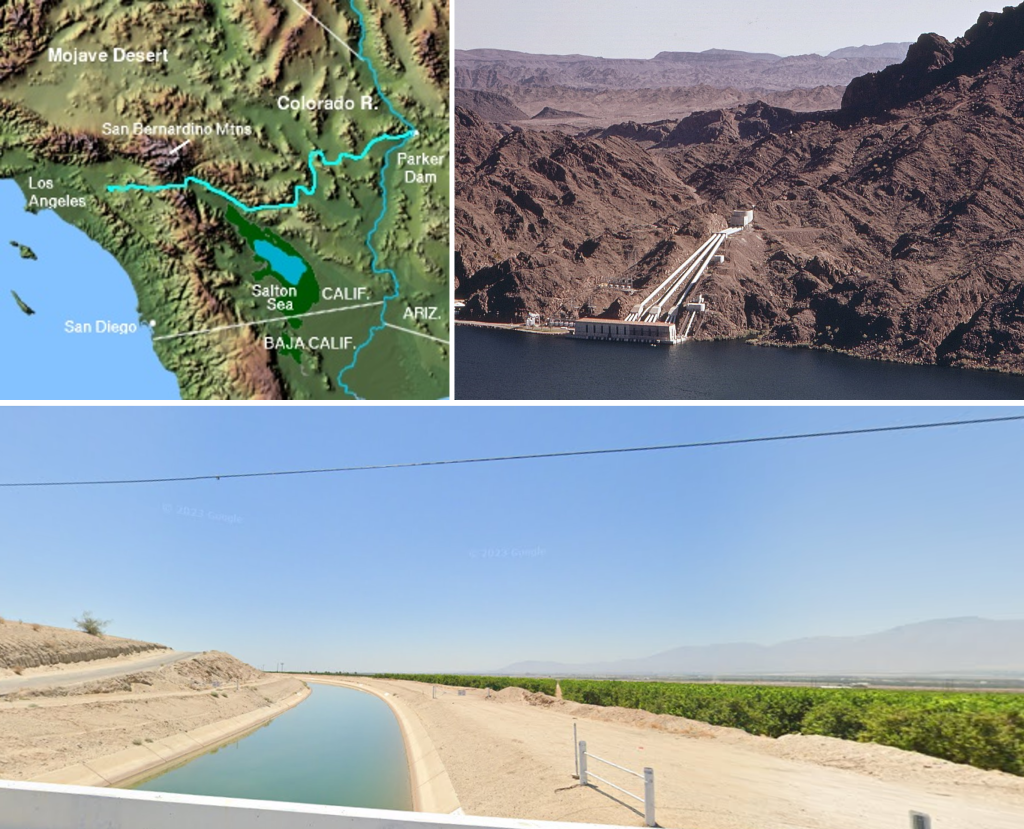
Water diversions can include drainage and irrigation ditches, pumping for the purpose of irrigation, flood control, municipal and industrial water use, and flood control levees. Since these practices are so diverse and widespread, it can be difficult to assess the impact. However, some diversion projects can be massive in scale. Whole cities, such as Los Angeles, Phoenix, and Las Vegas, have been built which rely on water diverted from other areas.

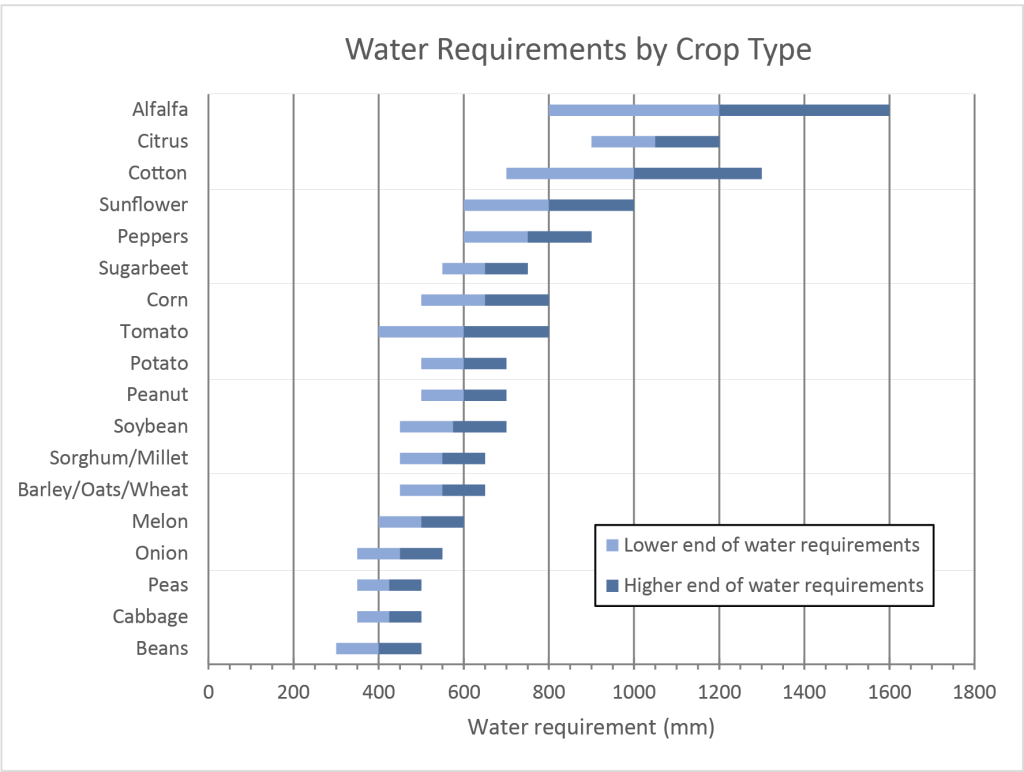
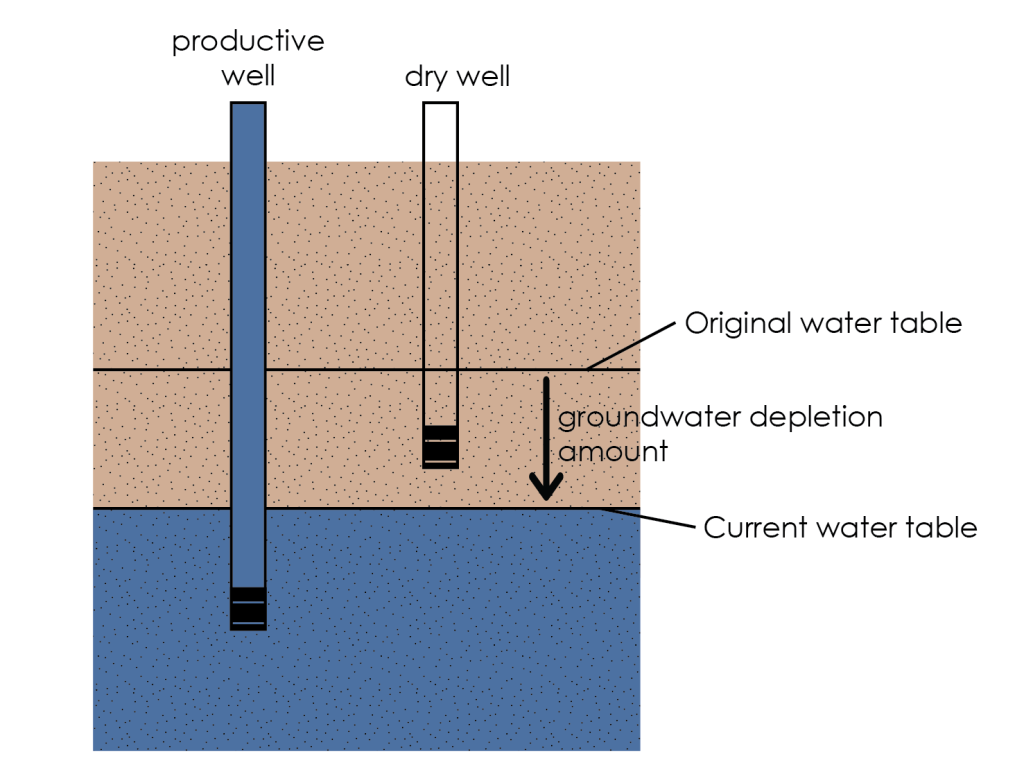
Agriculture is one of the largest sources of water diversions. One emerging and contentious practice in Minnesota is tile drainage, which involves pumping groundwater from fields into local waterways for the purpose of drying crop fields. Local water management agencies have often been tasked with regulating these practices. Groundwater is also diverted as irrigation for the purpose of watering crops. Much of the U.S. agricultural system is dependent on irrigation. Groundwater depletion can result in subsidence (sinking of the ground), well failure, saltwater intrusions into wells, and, of course, a lack of groundwater for use by future generations.


Bar graph showing water requirements for common crops in millimeters. Beans: 300 - 500 mm, median 400 mm. Cabbage: 350 - 500 mm, median 425 mm. Peas: 350 - 500 mm, median 425 mm. Onion: 350 - 550 mm, median 450 mm. Melon: 400 - 600 mm, median 500 mm. Barley/Oats/Wheat: 450 - 650 mm, median 550 mm. Sorghum/Millet: 450 - 650 mm, median 550 mm. Soybean: 450 - 700 mm, median 575 mm. Peanut: 500 - 700 mm, median 600 mm. Potato: 500 - 700 mm, median 600 mm. Tomato: 400 - 800 mm, median 600 mm. Corn: 500 - 800 mm, median 650 mm. Sugarbeet: 550 - 750 mm, median 650 mm. Peppers: 600 - 900 mm, median 750 mm. Sunflower: 600 - 1000 mm, median 800 mm. Cotton: 700 - 1300 mm, median 1000 mm. Citrus: 900 - 1200 mm, median 1050 mm. Alfalfa: 800 - 1600 mm, median 1200 mm.
Figure 4. Water requirements by crop type. Water requirements are millimeters of water needed during the growing season. Light blue portion is the lower end of water requirements and dark blue portion is the higher end of water requirements. Where the two colors join is the median water requirement for the crop. Source: Lindsay Iredale (2024). CC BY-4.0. Created using data from FAO-UN. Found here.


Map of California showing the location of the Central Valley which is a long, wide valley that is shaped like a long oval oriented north-south in the interior of California. The southern half is the San Joaquin Valley that extends from a latitude just north of Los Angeles to about that of San Francisco. The northern half is the Sacramento Valley which extends from a latitude of San Francisco north to Redding.Bottom left: photo of a woman hold a long pole with measurements on it. A sign at the top is labeled 1965 and at the ground surface is 2016. There is a height difference of 8.6ft between the two year signs. Right: Photograph of a man standing beside a large pole with three year signs on it. The top one is 1925, halfway down is 1955, and the ground surface has 1977. From 1955 to 1977 is a height difference of 29.5 ft.
Figure 5. Top Left: Map of California showing the location of the Central Valley, comprised of the Sacramento Valley (northern portion, blue) and the San Joaquin Valley (southern portion, yellow). Bottom Left: Photograph showing subsidence amount of 2.6 m (8.6 ft) from 1965 to 2016 in one location in the San Joaquin Valley. Right: Photograph showing subsidence amount of 9 m (29.5 ft) from 1925 to 1977 in another location in the San Joaquin Valley. Source: Top Left: Lindsay Iredale (2024) CC BY-4.0 base map from Google Maps. Bottom Left: USGS (2017). Public Domain. Found here. Right: USGS (1977). Public Domain. Found here.

diagram showing the unsaturated zone in beige, and the saturated zone in blue. Current water table is the top of the saturated zone. Partway through the unsaturated zone is a horizontal line labeled "original water table". There is an arrow pointing from the original water table to the current water table labeled "groundwater depletion amount". A well extends from the service down into the saturated zone and is labeled "productive well". Another well extends from the surface to just below the original water table depth, but is now in the unsaturated zone and is labeled "dry well".
Figure 6. Simplified cross section diagram illustrating how groundwater depletion (lowering of the water table in an aquifer) can cause some wells to become dry wells. Source: Lindsay Iredale (2024). CC BY-4.0

Wetlands play critical roles in hydrology and have huge ecological importance, providing hotspots of biodiversity, unique habitat, and resources to neighboring and migrating populations. However, these ecosystems have been extensively impaired, drained and destroyed for the purpose of agriculture, road construction, and urban development. In Minnesota, it is estimated that 50% of wetlands have disappeared. Local and state agencies have developed regulations to protect further impacts to wetlands. Federal agencies, such as the Army Corp of Engineers, are also responsible for enforcing laws related to wetland management. However, the interpretation of these laws is constantly changing, causing confusion.

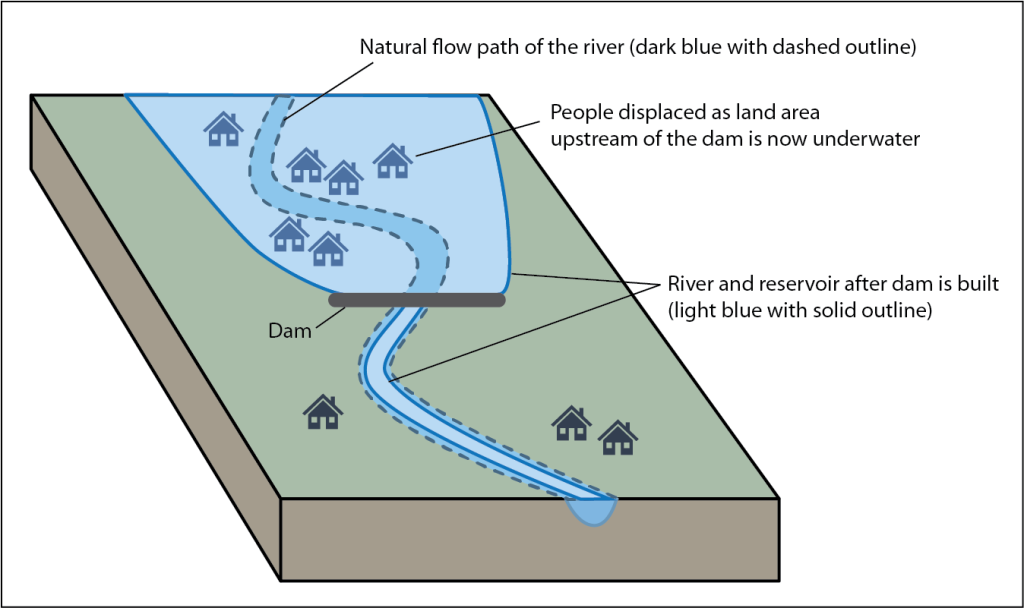
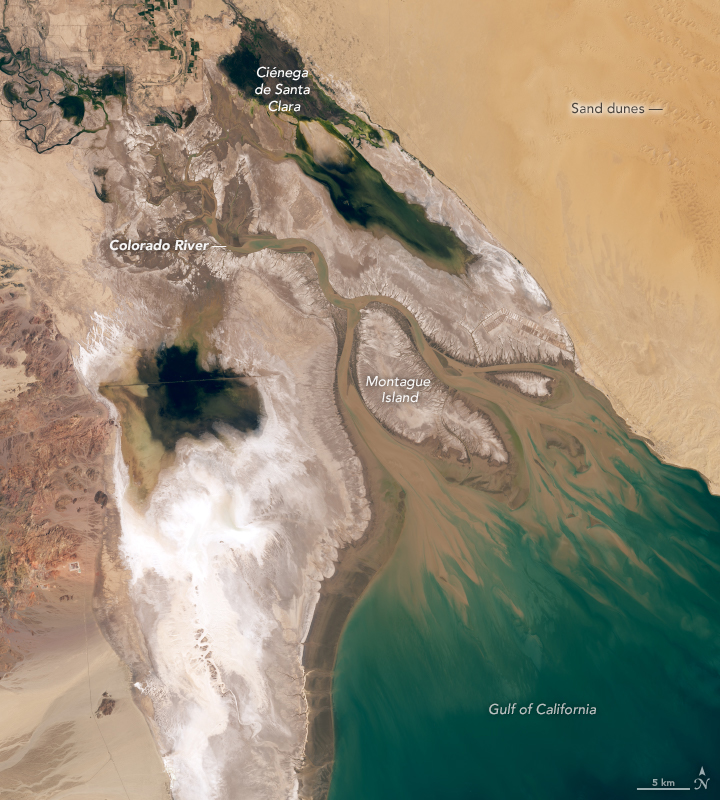
Water retention, particularly in the form of large dams, can have many purposes. Dams have been constructed for the purpose of irrigation, municipal water supply, recreation, and hydropower. For example, the Colorado River has numerous dams, including the Hoover Dam. The ecological and hydrological impacts of these projects are huge, changing the nature of whole river systems. Because of these impacts, the U.S. has moved away from this practice and many existing dams are being targeted for removal. This topic will be revisited in the chapter discussing hydroelectric power.


illustration showing a river flowing naturally with houses on either side. Superimposed over this is a dam and the new location of the river and reservoir upstream of the dam. The reservoir is flooding areas where upstream houses used to be. Downstream of the dam, the river is narrower than before.
Figure 7. River location before and after dam emplacement. Natural river flow is shown as darker blue water with a dashed outline. After the dam is emplaced, a reservoir develops upstream, and the downstream river is narrower as shown with light blue water and a solid outline. Source: Lindsay Iredale (2024). CC BY-4.0


Top left: Map with the path of the aqueduct that brings water from the California/Arizona border all the way to Los Angeles on the west coast. Top right: Photograph of a pumping station that bring water out of Lake Havasu and pumps it up through large pipes over the mountains. Bottom: Photograph of an aqueduct which is a 15-20ft wide open air channel running through a completely sandy desert landscape. The only green vegetation in the photograph is the neighboring field which is being water using water from the aqueduct
Figure 8. Colorado River Aqueduct. Top Left: Map showing path of the aqueduct from Parker Dam west into the Los Angeles area. Top right: Photograph of a pumping station at Lake Havasu. Bottom: Photograph of an open canal section of the aqueduct in southern California. Note the desert landscape surrounding the aqueduct next to lush agricultural land being grown in this area with the use of aqueduct water. Source: Top left: Decumanus (2005). CC BY-SA 3.0 Found here. Top right: Charles O’Rear (1941). Public Domain. Found here. Bottom: Google Maps street view (2023).


Satellite image showing the Colorado River Delta where the river empties into the Gulf of California in Mexico. The area is very dry with sand dunes and salt flats with only some very small pockets of wetlands. When the river ran freely the entire area would have been covered in wetlands.
Figure 9. Satellite image of the Colorado River Delta. The delta area is a zone of white colored salt flats, sand colored dunes, and dry river channels with some small pockets of wetland, notably the Cienega de Santa Clara. When the river ran freely, the entire delta would have been wetlands. Source: NASA Earth Observatory. Public Domain. Found here.

Inequitable Impacts of Groundwater Withdrawals for Irrigation

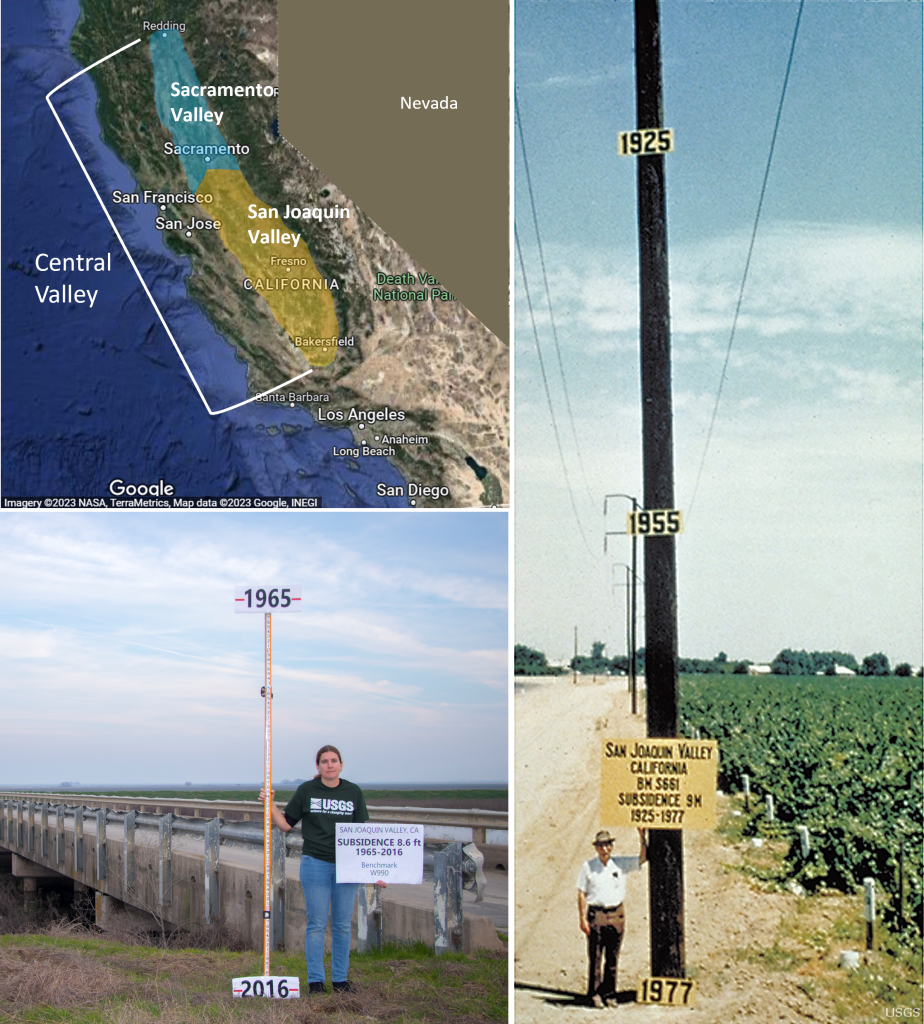
Long-term groundwater depletion and land subsidence has damaged thousands of public and private groundwater wells throughout the Central Valley. In some areas, due to long-term lowering of the water table, wells are no longer deep enough to reach groundwater. In other areas, wells are still deep enough to reach groundwater except during times of drought or overpumping by neighboring wells.

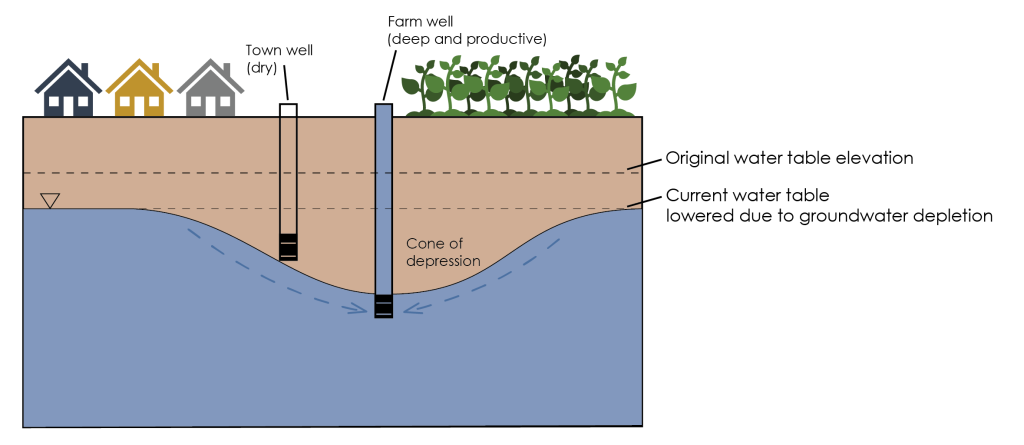
During drought conditions, the water diverted to the Central Valley via aqueducts for farms decreases, so farmers rely more heavily on pumping groundwater. Large farms and farms owned by large agricultural businesses have the economic resources available to install deep wells that reach far below the water table, ensuring the well will not run dry. These wells pump more groundwater than usual during a drought, which means the water table in the nearby area is artificially lowered in a cone shape as water is drawn into the pumping well (Figure 10). This cone shaped depression in the water table is aptly named the cone of depression and if this affects nearby wells, they will run dry. Such is the case with many residential drinking water supply wells in the Central Valley.


Cross section diagram showing unsaturated zone and saturated zone. On the left is a town with a well and on the right is a farm with a deeper well. Both wells reach to a depth that is below the water table, even with the water table being lowered due to groundwater depletion. The farm well is pumping strongly creating a localized zone where the water table has been pulled deeper in a cone shape around the well (cone of depression). The base of the town well is within the cone of depression which means the water table has now been pulled down below the town well and the town well is now dry.
Figure 10. Diagram illustrating how excessive pumping creates a large cone of depression that can lead to nearby wells becoming dry even if they are below the water table. Source: Lindsay Iredale (2024). CC BY-4.0

The districts that control pumping allowances in these areas have largely set pumping restrictions that address what growers want, while failing to address how this affects residential water supplies. The areas hardest hit by these conditions are rural communities in the Central Valley. These are largely comprised of lower income and Latino farm workers.


Attribution:

This section is cloned from Environmental Geology, by Lindsay J. Iredale, Normandale Community College, published using Pressbooks, under a CC BY-NC.SA 4. (Attribution-NonCommercial-ShareAlike 4.0 International; https://creativecommons.org/licenses/by-nc-sa/4.0/) . It may differ from the original.

Media Attributions

  • Slide1
  • Private: crop water needs
  • Private: San Joaquin Valley
  • Private: groundwater depletion © Lindsay Iredale is licensed under a CC BY (Attribution) license
  • Private: dams and reservoirs
  • Private: CRA
  • Private: cone of depression © Lindsay Iredale is licensed under a CC BY (Attribution) license

License

Icon for the Creative Commons Attribution-NonCommercial-ShareAlike 4.0 International License

Environmental Science Issues Copyright © by Bill Freedman; Brent Silvis; Emily P. Harris; and Lindsay Iredale is licensed under a Creative Commons Attribution-NonCommercial-ShareAlike 4.0 International License, except where otherwise noted.