12.3 Renewable Energy Sources
Renewable Energy Sources
Hydropower

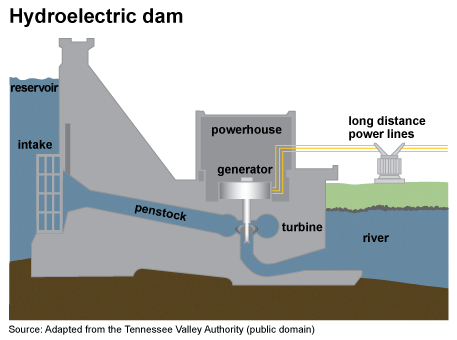
Hydropower (hydroelectric) relies on water to spin turbines and create electricity. This is most often accomplished by building a dam that blocks the flow of water allowing it to collect into a reservoir upstream of the dam. Water from the reservoir is then directed through a pipe (called the penstock) to drive turbines located within the dam structure and generate electricity (Figure 2).
Hydropower is considered a clean and renewable source of energy because it does not directly produce pollutants and because the source of power is regenerated. Hydropower provides 35% of the United States’ renewable energy consumption.
Hydropower dams and the reservoirs they create can have environmental impacts. For example, migration of fish to their upstream spawning areas can be obstructed by dams. In areas where salmon must travel upstream to spawn, such as along the Columbia River in Washington and Oregon, the dams block their way. This problem can be partially alleviated by using “fish ladders” that help salmon get around the dams. Fish traveling downstream, however, can get killed or injured as water moves through turbines in the dam. Reservoirs and operation of dams can also affect aquatic habitats due to changes in water temperatures, water depth, chemistry, flow characteristics, and sediment loads, all of which can lead to significant changes in the ecology and physical characteristics of the river both upstream and downstream. As reservoirs fill with water, natural areas, farms, cities, and archeological sites may be inundated and populations forced to relocate.
Small hydropower systems

Large-scale dam hydropower projects are often criticized for their impacts on wildlife habitat, fish migration, and water flow and quality. However, small run-of- the-river projects are free from many of the environmental problems associated with their large-scale relatives because they use the natural flow of the river, and thus produce relatively little change in the stream channel and flow. The dams built for some run-of-the-river projects are very small and impound little water, and many projects do not require a dam at all. Thus, effects such as oxygen depletion, increased temperature, decreased flow, and impeded upstream migration are not problems for many run-of-the-river projects.
Small hydropower projects offer emissions-free power solutions for many remote communities throughout the world, such as those in Nepal, India, China, and Peru, as well as for highly industrialized countries like the United States. Small hydropower systems are those that generate between .01 to 30 MW of electricity. Hydropower systems that generate up to 100 kilowatts (kW) of electricity are often called micro hydropower systems (Figure 3). Most of the systems used by home and small business owners would qualify as micro hydropower systems. In fact, a 10 kW system generally can provide enough power for a large home, a small resort, or a hobby farm.
Municipal Solid Waste
Municipal solid waste (MSW) is commonly known as garbage and can create electricity by burning it directly or by burning the methane produced as it decays. Waste to energy processes are gaining renewed interest as they can solve two problems at once: disposal of waste and production of energy from a renewable resource. Many of the environmental impacts are similar to those of a coal plant: air pollution, ash generation, etc. Because the fuel source is less standardized than coal and hazardous materials may be present in MSW, incinerators and waste-to-energy power plants need to clean the gases of harmful materials. The U.S. EPA regulates these plants very strictly and requires anti-pollution devices to be installed. Also, while incinerating at high temperature many of the toxic chemicals may break down into less harmful compounds. The ash from these plants may contain high concentrations of various metals that were present in the original waste. If ash is clean enough it can be “recycled” as an MSW landfill cover or to build roads, cement block and artificial reefs
Biofuel
Biomass
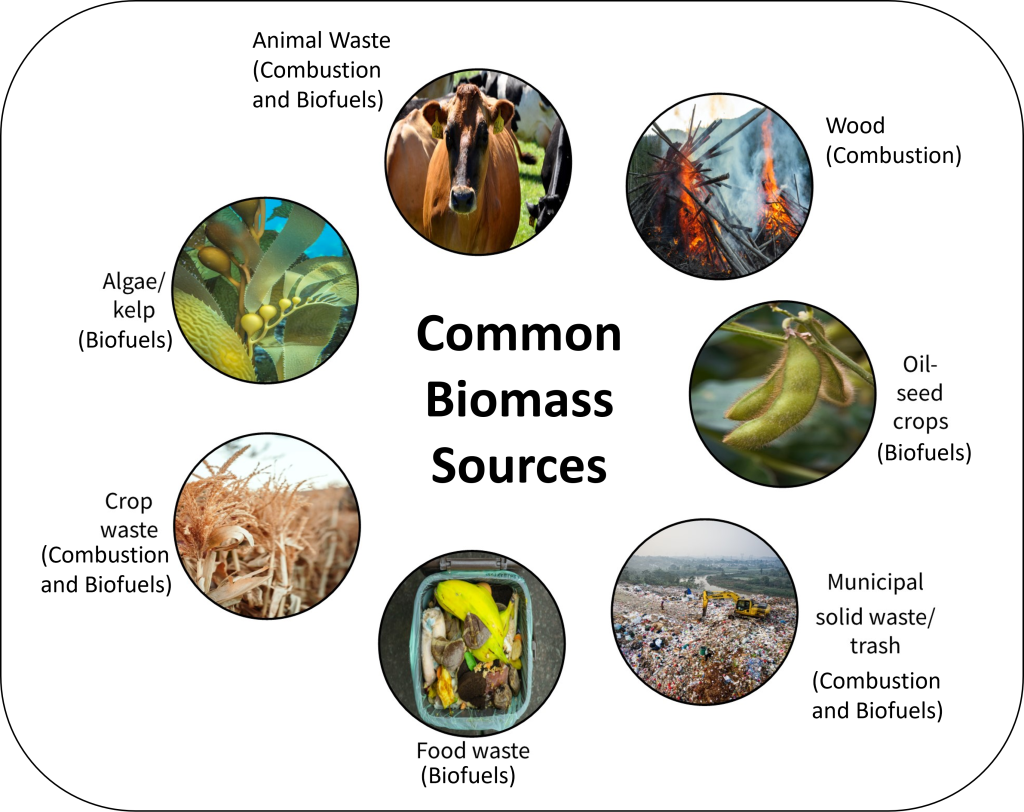
Biomass refers to material made by organisms, such as cells and tissues. Probably the best example of biomass is firewood which is burn in residential woodstoves to heat the home. In terms of energy production, biomass is almost always derived from plants, and to a lesser extent, algae. In addition to firewood, sustainable biomass can come from waste material, such as lumber mill sawdust, paper mill sludge, yard waste, or oat hulls from an oatmeal processing plant, material that would otherwise just rot. Livestock manure and human waste could also be considered biomass.
The use of biomass can help mitigate climate change because when burned it adds no new carbon to the atmosphere. Thinking back to the carbon cycle, you will recall that photosynthesis removes CO2 through the process of carbon fixation. When biomass is burnt, CO2 is created, but this is equal to the amount of CO2 captured during carbon fixation. Thus, biomass is a carbon neutral energy source because it doesn’t add new CO2 to the carbon cycle. Each type of biomass must be evaluated for its environmental and social impact in order to determine if it is really advancing sustainability and reducing environmental impacts. For example, cutting down large swaths of forests just for energy production is not a sustainable option because our energy demands are so great that we would quickly deforest the world, destroying critical habitat.

Using wood, and charcoal made from wood, for heating and cooking can replace fossil fuels and may result in lower CO2 emissions. If wood is harvested from forests or woodlots that have to be thinned or from urban trees that fall down or needed be cut down anyway, then using it for biomass does not impact those ecosystems. However, wood smoke contains harmful pollutants like carbon monoxide and particulate matter. For home heating, it is most efficient and least polluting when using a modern wood stove or fireplace insert that are designed to release small amounts of particulates. However, in places where wood and charcoal are major cooking and heating fuels such as in undeveloped countries, the wood may be harvested faster than trees can grow resulting in deforestation.
Biomass can be used in small power plants to produce electricity. For instance, Colgate College has had a wood-burning boiler since the mid-1980’s and in one year it processed approximately 20,000 tons of locally and sustainably harvested wood chips, the equivalent of 1.17 million gallons (4.43 million liters) of fuel oil, avoiding 13,757 tons of emissions and saving the university over $1.8 million in heating costs. The University’s steam-generating wood-burning facility now satisfies more than 75% of the campus’s heat and domestic hot water needs.
Landfill Gas or Biogas
Landfill gas (biogas) is a sort of man-made “biogenic” gas as discussed above. Methane is formed as a result of biological processes in sewage treatment plants, waste landfills, anaerobic composting, and livestock manure management systems. This gas is captured and burned to produce heat or electricity. The electricity may replace electricity produced by burning fossil fuels and result in a net reduction in CO2 emissions. The only environmental impacts are from the construction of the plant itself, similar to that of a natural gas plant.
Bioethanol and Biodiesel
Bioethanol and biodiesel are liquid biofuels manufactured from plants, typically crops. Bioethanol can be easily fermented from sugar cane juice, as is done in Brazil. Bioethanol can also be fermented from broken down corn starch, as is mainly done in the United States. Soybean crops can be converted to biodiesel.
The economic and social effects of growing plants for fuels need to be considered, since the water, land, fertilizers, and energy used to grow biofuel crops could be used to grow food crops instead. The competition of land for fuel vs. food can increase the price of food, which has a negative effect on society. It could also decrease the food supply increasing malnutrition and starvation globally. Also, in some parts of the world, large areas of natural vegetation and forests have been cut down to grow sugar cane for bioethanol and soybeans and palm-oil trees to make biodiesel. This is not sustainable land use.
Biofuels may be derived from parts of plants not used for food, such as stalks, thus reducing that impact. Biodiesel can be made from used vegetable oil and has been produced on a very local basis. Compared to petroleum diesel, biodiesel combustion produces less sulfur oxides, particulate matter, carbon monoxide, and unburned and other hydrocarbons, but it produces more nitrogen oxide.
Liquid biofuels typically replace petroleum and are used to power vehicles. Although ethanol-gasoline mixtures burn cleaner than pure gasoline, they also are more volatile and thus have higher “evaporative emissions” from fuel tanks and dispensing equipment. These emissions contribute to the formation of harmful, ground level ozone and smog. Gasoline requires extra processing to reduce evaporative emissions before it is blended with ethanol.
- What are the various forms of biofuel?
- What are the pros and cons of each?
- Can any biofuels be considered “carbon neutral”? Why or why not?
Geothermal Energy
There are two types of geothermal energy: passive (or direct) and geothermal power plans. Passive geothermal is used simply to heat or cool buildings. These systems utilize a heat-exchange system that runs in the subsurface about 20 feet (5 meters) below the surface where the ground is at a constant temperature. The system uses the earth as a heat source (in the winter) or a heat sink (in the summer). This reduces the energy consumption required to generate heat from gas, steam, hot water, and conventional electric air-conditioning systems. These applications have almost no negative impact on the environment.
In areas where there is a high geothermal potential (heat close to the surface), it may be feasible to develop geothermal power plants to generate electricity. With increasing depth inside the Earth, the temperature also increases, this is called the geothermal gradient. This internal heat is a combination of residual heat from the formation of the planet and heat generated through natural decay of radioactive isotopes inside the Earth. The geothermal gradient averages 20-25°C/km through crustal depths applicable to geothermal energy production. This can increase to over 100°C/km in active volcanic regions where hot magma is near the Earth’s surface.
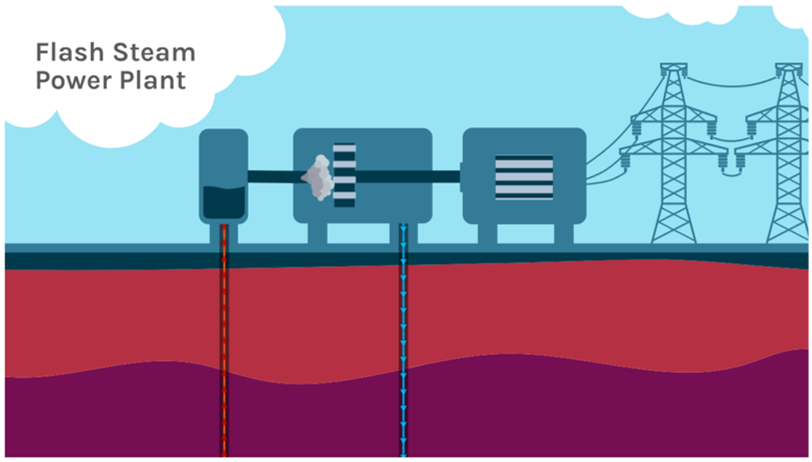
In simple terms, in a flash steam power plant water is pumped beneath the surface. The water is converted to steam which turns a turbine, producing electricity.
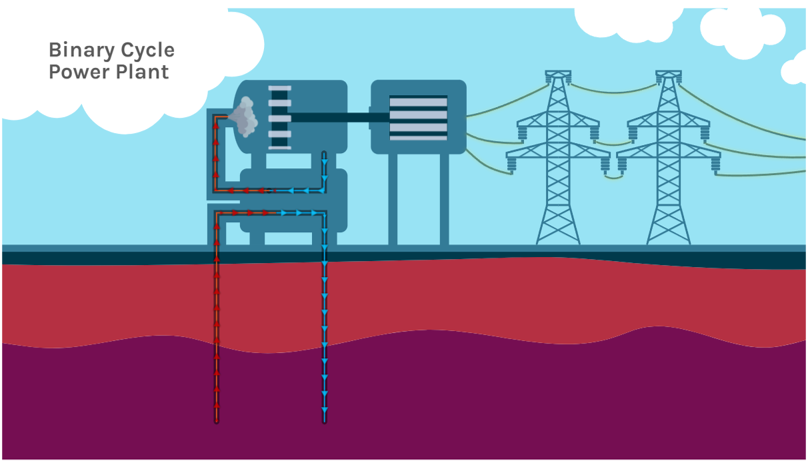
If there is not enough heat to convert the water to steam, a binary cycle power plant will use the heat in the water to convert a secondary (“binary”) fluid, which has a lower boiling point than water. The secondary fluid is then converted to vapor, turning the turbine.
Like the other steam powered energies, geothermal resources can provide constant energy. Geothermal power plants do not burn fuel to generate electricity so their emission levels are very low. They release less than 1% of the carbon dioxide emissions of a fossil fuel plant. Geothermal plants use scrubber systems to clean the air of hydrogen sulfide that is naturally found in the steam and hot water. They emit 97% less acid rain-causing sulfur compounds than are emitted by fossil fuel plants. After the steam and water from a geothermal reservoir have been used, they are injected back into the earth. With current technology, the U.S. Department of Energy estimates over 40 million homes could be powered by EGS derived energy by 2050.
Solar Energy

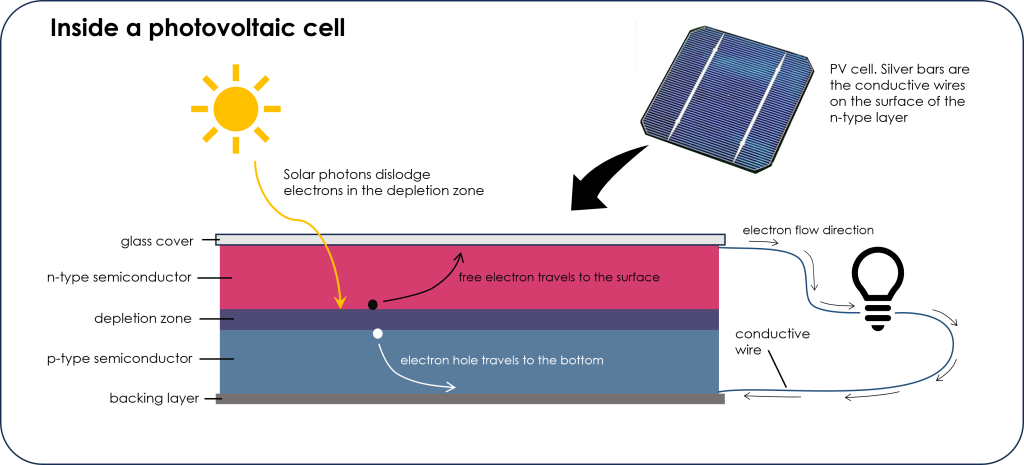
Solar power converts the energy of light into electrical energy and has minimal impact on the environment, depending on where it is placed. Electricity can be generated by harnessing solar power in a couple of ways, but the most widespread method uses photovoltaic (PV) cells, or solar cells. A PV cell is made up of semiconductor material (the most used semiconductor material is silicon although cadmium based PV cells are also used) sandwiched between a glass cover and a backing material. The semiconductor has two layers, a top layer that is negatively charged (n-type layer) and a bottom layer that is positively charged (p-type layer). The boundary between these two layers is called the depletion zone where an internal electric field is created that prevents electrons from flowing from the negatively charged side to the positively charged side to balance the charge difference. As photons from the sun pass through the glass and get absorbed by the semiconductor, they dislodge electrons from the atoms within the depletion zone. These free electrons flow to the surface of the semiconductor n-type layer and the electron hole created by the dislodging of the electron flows down to the p-type layer. By connecting the negatively charged, n-type, layer with the positively charged, p-type, layer with a conductive material such as a metallic wire, the electrons will flow from the n-type layer back to the p-type layer to fill the electron hole (Figure 11). This flow of electrons is electricity!
A single PV cell is anywhere from 0.5 to 4 inches across and can generate 1-2 watts of electricity. This is enough to power small items like a calculator or a watch. PV cells are connected to create larger solar panels, like would be seen on a house roof or in a solar farm. An individual solar panel can generate 300-600 watts of electricity and is roughly 2 meters long by 1 meter wide.
The potential to generate solar power is not the same everywhere or even consistent throughout the day. The three main factors affecting solar power are latitude, cloud cover, and daylight hours. The intensity of incoming solar radiation varies across the planet. At latitudes closer to the equator, solar radiation is more direct and therefore has the potential to generate more power. The solar power potential is also affected by cloud cover as clouds scatter incoming rays reducing solar power. Finally, at nighttime when the sun is not shining, solar energy cannot be generated. Polar locations have up to 24 hours of sunlight during the summer and regions at 45°N or S have over 15 hours of sunlight on the longest days of the year, making solar energy potential high in the summertime. However, winter in these areas can be very dark with minimal sunlight. Equatorial regions on the other hand have a near constant number of daylight hours throughout the year, which makes the solar energy potential more consistent throughout the year. Regardless of the number of daylight hours, the intensity of solar radiation changes throughout the day. Solar radiation is strongest when the sun is high, so midday hours instead of morning and evening hours.
The variations in solar radiation throughout the day and year mean solar energy is intermittent, not constant, and not necessarily available during peak usage times. Solar energy can be stored to be used at times when it is not being actively produced. The two main methods of storing excess energy are pumped hydroelectric storage and batteries. With pumped hydroelectric storage the energy is used to pump water uphill to a holding reservoir where it can be later released and sent through a turbine to generate electricity. This form of storage is usually done once the solar energy has been delivered to the electrical grid and is the main form of electrical grid energy storage for all types of stored energy (solar, wind, etc.). Battery storage is done from the electrical grid or directly on the solar farm prior to supplying the electrical grid.
Solar energy is inexhaustible and clean, with no greenhouse gas emissions associated with actual energy production. The greenhouse gas emissions and environmental impacts are connected to mining raw materials to make solar panels and the batteries, the construction and emplacement of the panels, and the disposal of panels at the end of their lifespan. Silicon for the panels, copper and silver for conductive metals, lithium and nickel for batteries, along with many other metals are required to make solar energy function and all these materials must be mined. To decrease the harmful impacts associated with mining for solar panel and battery components, or really for any mining activity, new methods of recycling old materials, more stringent environmental regulations that are applied equally in all countries, and research into new technologies that reduce mining impacts are required. The need for mineral resources that allow renewable energies to be utilized is not going away so more sustainable ways of mining must emerge.
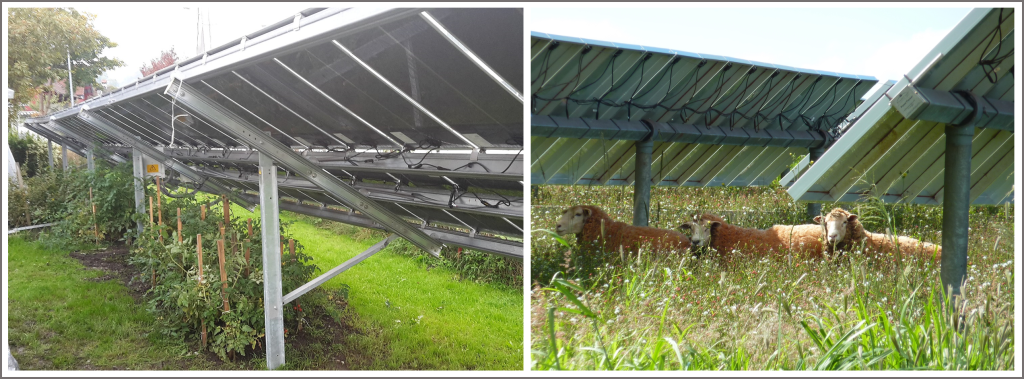
Solar panels are a very versatile source of electricity as they can be installed as large solar farms or used on a smaller scale by being installed directly on homes and businesses. This also reduces the land area required for producing electricity, which is relatively high when installed as solar farms, requiring more land than other energy sources per amount of electricity produced except for some styles of coal and hydroelectric power plants. Solar panels are not placed directly beside each other as this causes neighboring solar panels to shade each other throughout the day, reducing efficiency. In recent decades, research into how to maximize land use in solar farms has developed a method called agrivoltaic farming. This turns solar farm areas into dual use with agricultural land. Crops are planted in the spaces around and between solar panels to maximize land use (Figure 12, left). This style of agrivoltaics can be particularly useful in very hot and sunny climates as the solar panels help to shade the crops and reduce evapotranspiration. Solar panels co-located with ranching can be installed high enough to allow animals to graze the grassy areas underneath while also providing needed daytime shade for the animals (Figure 12, right).
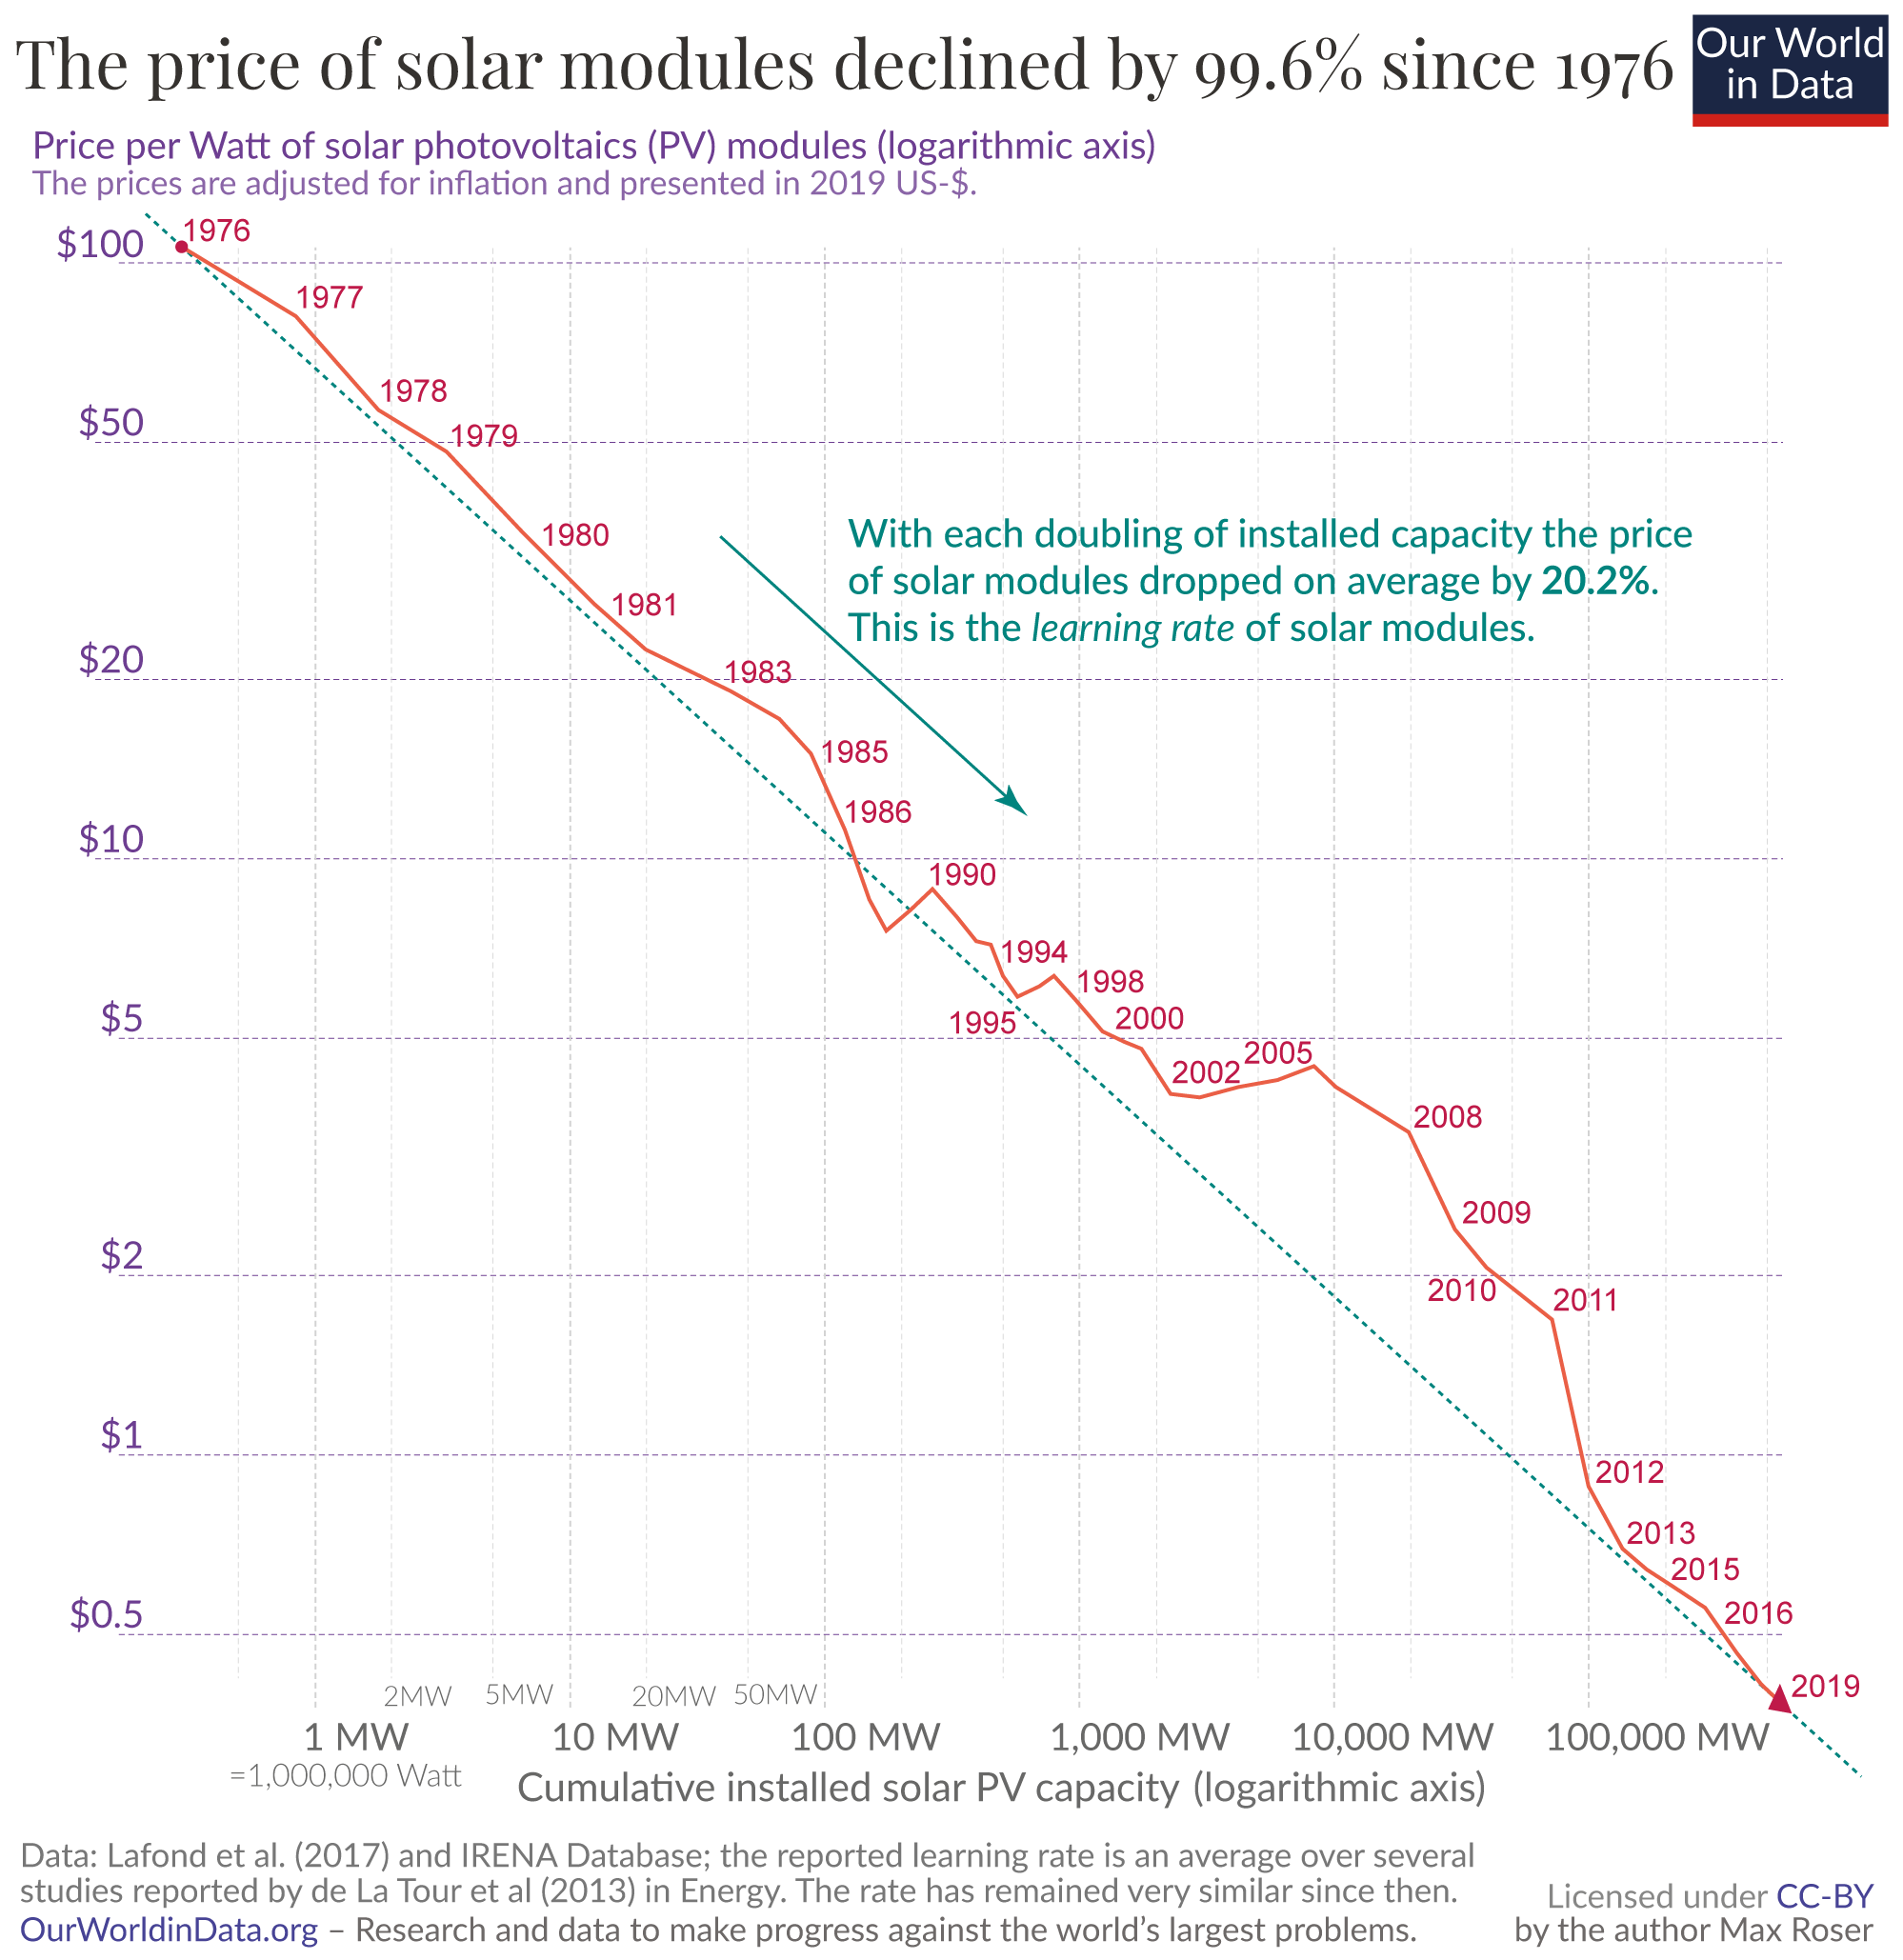
Solar panels used to be among the most expensive of all energy resources, but advances in technology and increasing demand have drastically decreased the cost of solar panels (Figure 13). Solar energy is now the cheapest energy source, with wind energy a close second. A comparable price decrease is seen for lithium batteries used in energy storage.
Minnesota Connection: Mining in Northern Minnesota
Iron mining has a long history in northern Minnesota dating back to the 1880s. In the late 1940s copper-nickel deposits were discovered in this area as well. Exploration and research into the extent and viability of extracting copper and nickel were carried out after that, and through the late 1970s and early 1980s mining of these resources seemed imminent. However, declining copper prices at this time put an end to thoughts about mining these ores.
Since the early 2000s there has been renewed interest in mining these deposits as the push for renewable energy has created a new demand for nickel. Nickel is an important element in lithium-ion batteries, which is the main battery technology for electric vehicles and renewable energy storage from sources like wind and solar.
Two major projects by the PolyMet Mining Corporation and Twin Metals Minnesota are proposing new mining projects to extract copper-nickel resources in northern Minnesota, both in areas that are close to the Boundary Waters Canoe Area Wilderness (BWCAW), a vast wilderness reserve along the Minnesota-Canada border. Both projects have been embroiled in regulatory battles for at least a decade while environmental impact assessments were carried out. As of 2023, both projects have been denied permits or had permits revoked due to environmental impacts such as wetland degradation or freshwater contamination risk.
This is a is a hot topic through northern Minnesota as the economy has historically relied on mining with many of the towns through the area being mining towns for generations. In more recent decades though, the economy has transitioned to also relying on outdoor recreational tourism in the many wilderness areas including the BWCAW. Battles over mine permitting have put mining in direct competition with tourism, pitting the two most important economic factors in the area against each other. Both of these projects have uncertain futures but seem unlikely for the time being.
Wind Energy
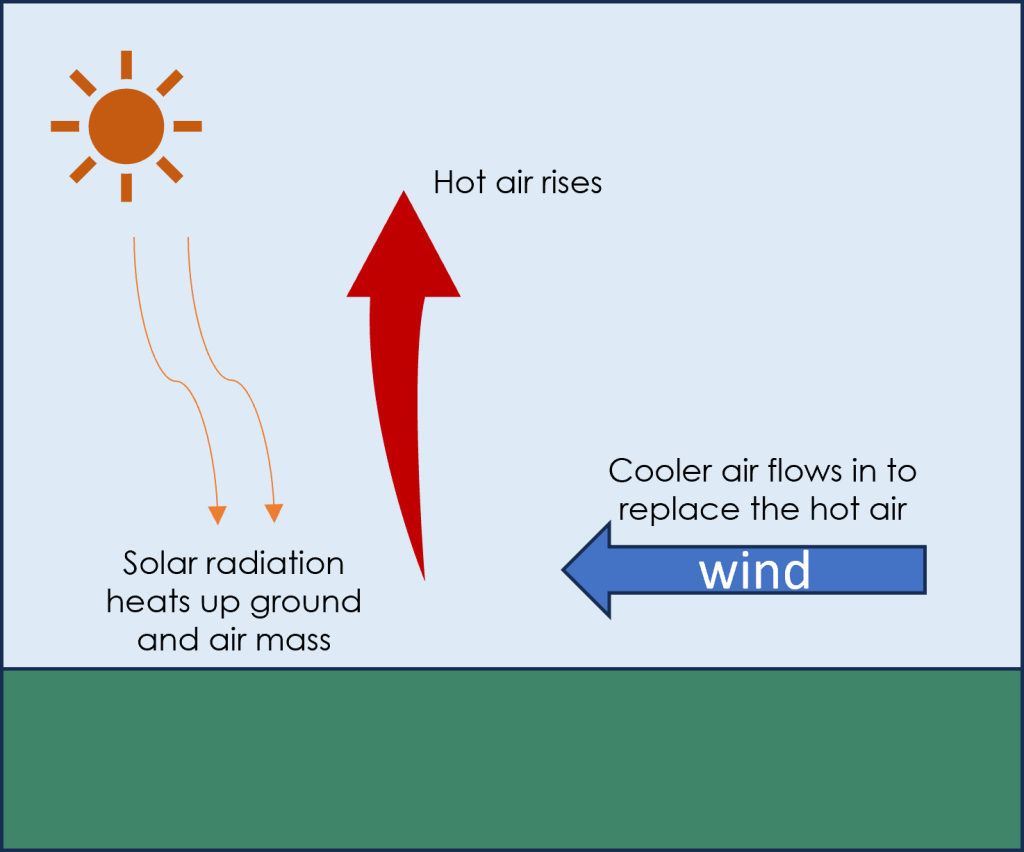
Wind energy is a renewable energy source that is clean and has very few environmental challenges. Wind turbines are becoming a more prominent sight across the United States, even in regions that are considered to have less wind potential. Wind turbines (often called windmills) do not release emissions that pollute the air or water (with rare exceptions), and they do not require water for cooling.
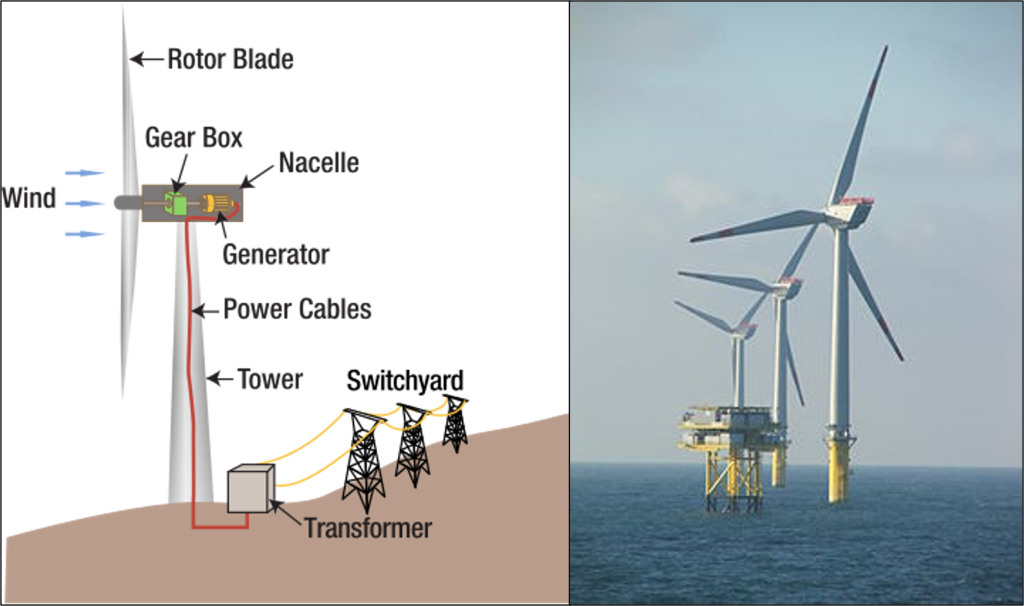
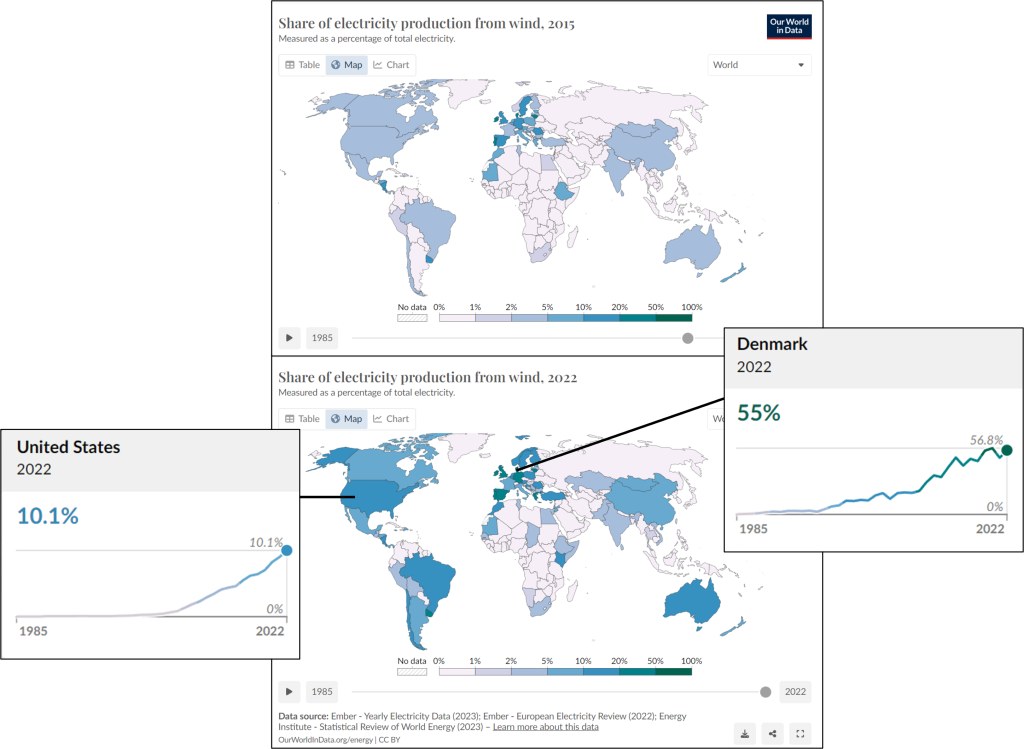
Wind energy technologies capture the power of moving air by using it to rotate the blades on wind turbines, which are connected to a generator to create electricity (Figure 15). Wind energy is among the fastest growing renewable energy sources (solar is the fastest growing), supplying 7.5% of global electricity in 2022, up from 3.5% in 2015 (Figure 16). Wind power has grown in the U.S. to be 10.1% of electricity production in 2022. The world leader in wind power is Denmark, producing 55% of its electricity from the wind.
Because a wind turbine has a small physical footprint relative to the amount of electricity it produces, many wind farms are located on crop and pasture land. They contribute to economic sustainability by providing extra income to farmers and ranchers, allowing them to stay in business and keep their property from being developed for other uses. For example, energy can be produced by installing wind turbines in the Appalachian mountains of the United States instead of engaging in mountain top removal for coal mining. Offshore wind turbines on lakes or the ocean may have smaller environmental impacts than turbines on land.

Wind turbines do have a few environmental challenges. There are aesthetic concerns to some people when they see them on the landscape. A few wind turbines have caught on fire, and some have leaked lubricating fluids, though this is relatively rare. Some people do not like the sound that wind turbine blades make. Turbines have been found to cause bird and bat deaths particularly if they are located along their migratory path. This is of particular concern if these are threatened or endangered species. There are ways to mitigate that impact and it is currently being researched. There are some small impacts from the construction of wind projects or farms, such as the construction of service roads, the production of the turbines themselves, and the concrete for the foundations. However, overall analysis has found that turbines make much more energy than the amount used to make and install them.
Interest in Renewable Energy
Strong interest in renewable energy in the modern era arose in response to the oil shocks of the 1970s, when the Organization of Petroleum Exporting Countries (OPEC) imposed oil embargos and raised prices in pursuit of geopolitical objectives. The shortages of oil, especially gasoline for transportation, and the eventual rise in the price of oil by a factor of approximately 10 from 1973 to 1981 disrupted the social and economic operation of many developed countries and emphasized their precarious dependence on foreign energy supplies. The reaction in the United States was a shift away from oil and gas to plentiful domestic coal for electricity production and the imposition of fuel economy standards for vehicles to reduce consumption of oil for transportation. Other developed countries without large fossil reserves, such as France and Japan, chose to emphasize nuclear (France to the 80% level and Japan to 30%) or to develop domestic renewable resources such as hydropower and wind (Scandinavia), geothermal (Iceland), solar, biomass and for electricity and heat. As oil prices collapsed in the late 1980s interest in renewables, such as wind and solar that faced significant technical and cost barriers, declined in many countries, while other renewables, such as hydropower and biomass, continued to experience growth.
The increasing price and volatility of oil prices since 1998, and the increasing dependence of many developed countries on foreign oil (60% of United States and 97% of Japanese oil was imported in 2008) spurred renewed interest in renewable alternatives to ensure energy security. A new concern, not known in previous oil crises, added further motivation: our knowledge of the emission of greenhouse gases and their growing contribution to climate change. An additional economic motivation, the high cost of foreign oil payments to supplier countries (approximately $350 billion/year for the United States at 2011 prices), grew increasingly important as developed countries struggled to recover from the economic recession of 2008. These energy security, carbon emission, and climate change concerns drive significant increases in fuel economy standards, fuel switching of transportation from uncertain and volatile foreign oil to domestic electricity and biofuels, and production of electricity from low carbon sources.
Physical Origin of Renewable Energy
Although renewable energy is often classified as hydro, solar, wind, biomass, geothermal, wave and tide, all forms of renewable energy arise from only three sources: the light of the sun, the heat of the earth’s crust, and the gravitational attraction of the moon and sun. Sunlight provides by far the largest contribution to renewable energy. The sun provides the heat that drives the weather, including the formation of high- and low-pressure areas in the atmosphere that make wind. The sun also generates the heat required for vaporization of ocean water that ultimately falls over land creating rivers that drive hydropower, and the sun is the energy source for photosynthesis, which creates biomass. Solar energy can be directly captured for water and space heating, for driving conventional turbines that generate electricity, and as excitation energy for electrons in semiconductors that drive photovoltaics. The sun is also responsible for the energy of fossil fuels, created from the organic remains of plants and sea organisms compressed and heated in the absence of oxygen in the earth’s crust for tens to hundreds of millions of years. The time scale for fossil fuel regeneration, however, is too long to consider them renewable in human terms.
Geothermal energy originates from heat rising to the surface from earth’s molten iron core created during the formation and compression of the early earth as well as from heat produced continuously by radioactive decay of uranium, thorium and potassium in the earth’s crust. Tidal energy arises from the gravitational attraction of the moon and the more distant sun on the earth’s oceans, combined with rotation of the earth. These three sources – sunlight, the heat trapped in earth’s core and continuously generated in its crust, and gravitational force of the moon and sun on the oceans – account for all renewable energy.
Capacity and Geographical Distribution
Although renewable energies such as wind and solar have experienced strong growth in recent years, they still make up a small fraction of the world’s total energy needs. The largest share comes from traditional biomass, mostly fuel wood gathered in traditional societies for household cooking and heating, often without regard for sustainable replacement. Hydropower is the next largest contributor, an established technology that experienced significant growth in the 20th Century. The other contributors are more recent and smaller in contribution: water and space heating by biomass combustion or harvesting solar and geothermal heat, biofuels derived from corn or sugar cane, and electricity generated from wind, solar and geothermal energy.
Wind and solar electricity, despite their large capacity and significant recent growth, still contributed less than 1% of total energy in 2008. One of the largest obstacles to wind and solar is their intermittency. Both of these energy sources experience periods where they are unable to produce electricity. During these periods, either other energy sources must be utilized or we must rely on stored energy. Energy storage, primarily in the form of chemical batteries, is very expensive and we have not yet developed batteries that can economically store utility-scale amounts of energy.
The potential of renewable energy resources varies dramatically. Solar energy is by far the most plentiful, delivered to the surface of the earth at a rate of 120,000 Terawatts (TW), compared to the global human use of 15 TW. To put this in perspective, covering 100×100 km2 of desert with 10% efficient solar cells would produce 0.29 TW of power, about 12% of the global human demand for electricity. To supply all of the earth’s electricity needs (2.4 TW in 2007) would require 7.5 such squares, an area about the size of Panama (0.05% of the earth’s total land area). The world’s conventional oil reserves are estimated at three trillion barrels, including all the oil that has already been recovered and that remain for future recovery. The solar energy equivalent of these oil reserves is delivered to the earth by the sun in 1.5 days.
The geographical distribution of useable renewable energy is quite uneven. Sunlight, often thought to be relatively evenly distributed, is concentrated in deserts where cloud cover is rare. Winds are up to 50% stronger and steadier offshore than on land. Hydroelectric potential is concentrated in mountainous regions with high rainfall and snowmelt. Biomass requires available land that does not compete with food production, and adequate sun and rain to support growth.
Attribution:
Portions of this section adapted from:
- Environmental Biology, by Matthew R. Fisher, Oregon Coast Community College, published using Pressbooks, under a CC BY (Attribution: https://creativecommons.org/licenses/by/4.0/) license.
- Environmental Geology, by Lindsay J. Iredale, Normandale Community College, published using Pressbooks, under a CC BY-NC.SA 4. (Attribution-NonCommercial-ShareAlike 4.0 International; https://creativecommons.org/licenses/by-nc-sa/4.0/).
Media Attributions
- Private: biomass sources
- Private: heating-value
- chart2
- nuclear disaster
- CloudTypes
- Private: PV cell
- Private: agrivoltaics
- Private: solar-pv-prices-vs-cumulative-capacity
- Private: wind creation
- Private: wind turbine
- Private: wind energy worldwide
