12.2 Non-Renewable Energy Sources
Non-Renewable Energy Sources
Fossil Fuels
Fossil fuels are energy sources that are derived from ancient organic matter of plants, algae, and cyanobacteria. When organic matter dies it is typically broken down and oxidized (joined with oxygen) quickly (weeks to years) to make carbon dioxide. However, if the organic matter settles into an area that is low in oxygen, or anoxic, the oxidation process will not occur, and the organic matter can be buried and preserved in sediments. If the temperature and pressure conditions are right for this buried organic matter it can, over millions of years, be turned into a fossil fuel. These are rich in carbon that has been bonded with hydrogen molecules through chemical reactions giving them their other name, hydrocarbons. The type of fossil fuel made will depend on the type of organic matter buried, the location where it was buried, and the pressure and temperature conditions it underwent. The three primary types of fossil fuels are oil, coal, and natural gas.
Fossil Fuels and Carbon Dioxide Emissions
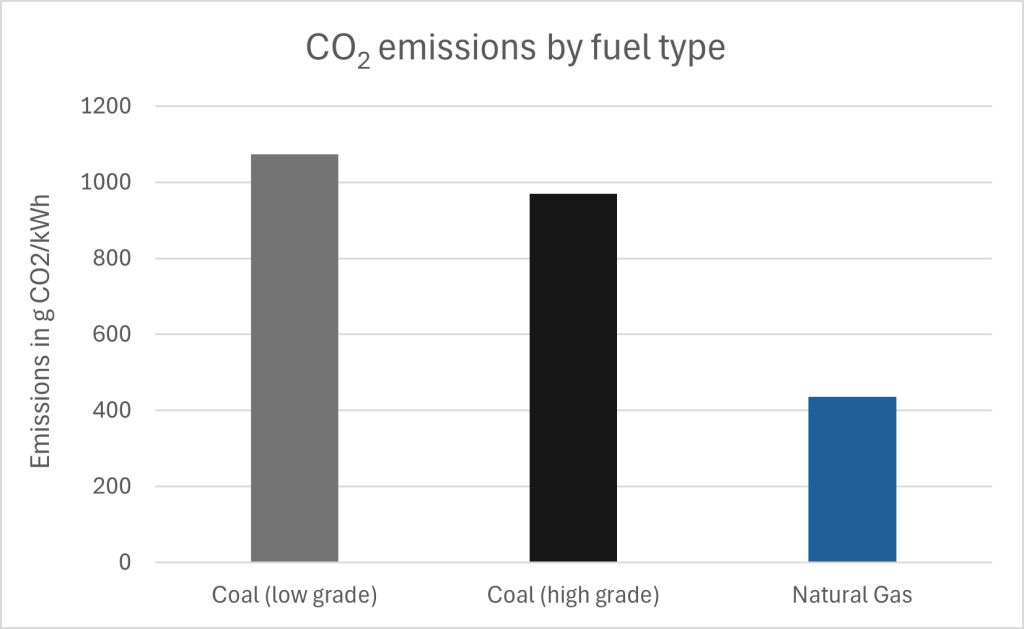
Each fossil fuel is unique, with unique advantages and disadvantages, but all fossil fuels produce carbon dioxide when combusted (Figure 1).
Formation of Fossil Fuels
Formation of Coal
Coal is a black, brittle, carbon rich sedimentary rock that forms from vegetation buried in swamps. Swamps are commonly anoxic waters, so as vegetation accumulates in this oxygen-free setting the lack of oxygen prevents organic matter decay. As such, the carbon is not released as carbon dioxide, but instead is buried where it gets compressed and heated to transform into coal. Different grades or ranks of coal form as the organic matter becomes progressively more heated and compressed for longer periods of time (Figure 3).
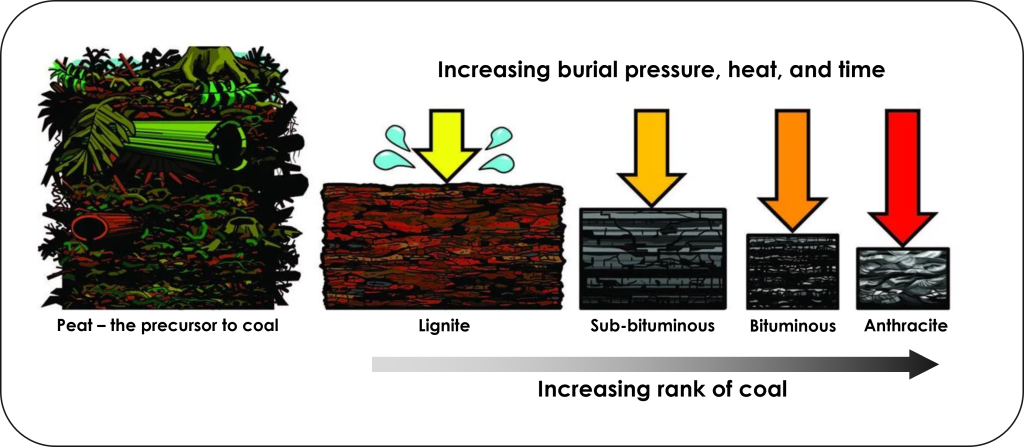
The precursor to coal is peat; a moist, organic rich accumulation of partially decayed vegetation. As peat is buried and subjected to higher temperatures and pressures over time, it is transformed into coal. Higher ranks of coal contain higher amounts of carbon and produce more heat energy when burned. The lowest rank of coal is lignite, then they increase in rank through sub-bituminous, bituminous, and finally anthracite coal is highest rank.
The first coal bearing rocks formed roughly 360-300 million years ago during the Carboniferous Period, named because the rocks from this time are carbon rich. During this time, land plants thrived, and large swamps were present on the landscape. The huge amount of carbon that was buried, and as a result removed long term from the atmosphere, during this time was a contributing factor in the Late Paleozoic Ice Age that began roughly 340 million years ago.
Formation of Natural Gas and Oil
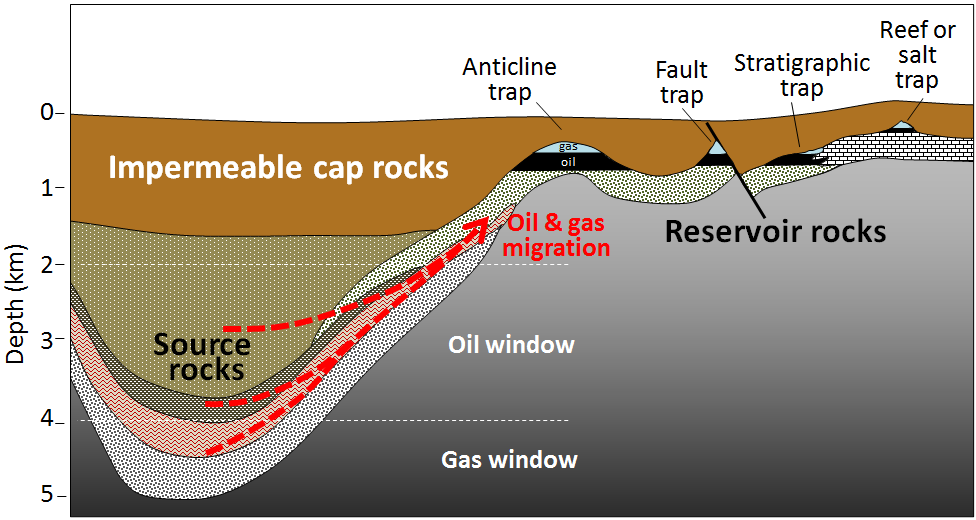
Oil and gas form similarly to coal in that organic matter accumulates and is buried under anoxic conditions. However, while almost all coal forms on land from terrestrial vegetation, oil and gas is primarily derived from marine micro-organisms that accumulate within sea-floor sediments. Increasing burial pressures and temperatures convert the organic matter in the sea-floor sediments to hydrocarbons. Oil formation occurs at depths greater than about 2 km, and at temperatures ranging from 60° to 120°C (oil window). At higher temperatures, methane gas is formed (gas window) (Figure 3C.2.3).
The rock containing organic matter where the formation of gas and oil takes place is called the source rock. As both liquid oil and gaseous methane are lighter than water, they tend to migrate slowly out of the source rock toward the surface and into reservoir rocks. Reservoir rocks are typically relatively porous and permeable because that allows migration of the fluids from the source rocks, and also facilitates recovery of the oil or gas. Oil and gas become contained in the reservoir rocks by overlying impermeable rocks called cap rocks. The orientation or geometries of the source rock and reservoir rock to the cap rock need to be correct in order for the oil and gas to become trapped. This keeps the oil and gas in the ground instead of letting it seep to the surface. Traps for oil and gas include specific types of rock folds (called anticlines), faults, stratigraphic (rock layer) changes, or in association with reefs and salt domes (Figure 4).
Extraction and Use of Fossil Fuels
Coal Extraction and Use
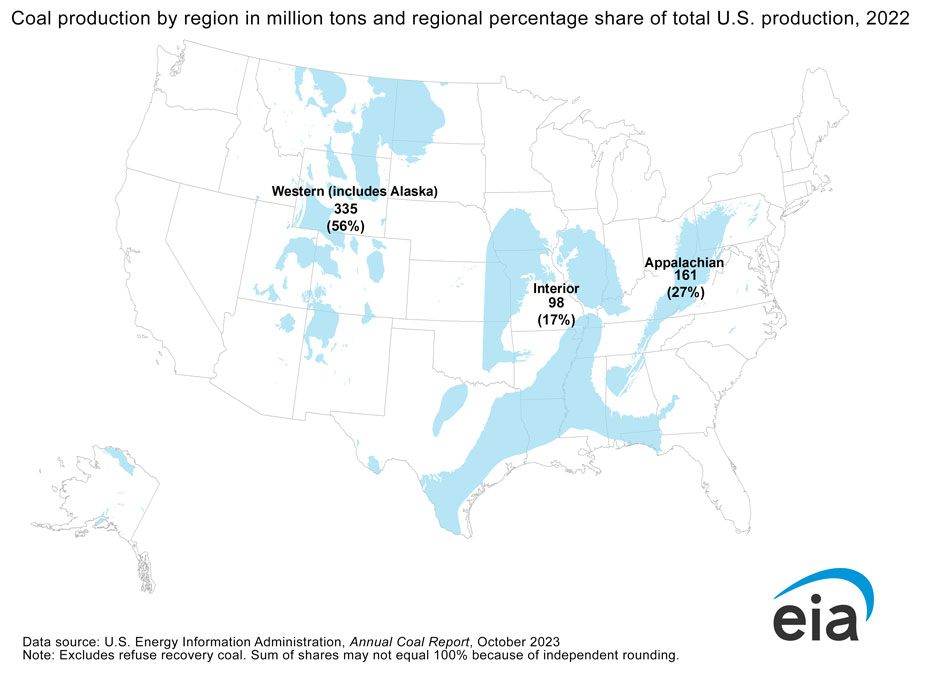
Coal is removed from the ground through mining. The type of mining used, whether underground or open pit, is based on how deep and how thick the coal seam is. In the United States, coal is mined from three main regions, the Western region, the Interior region, and the Appalachian region (Figure 5). Wyoming, within the Western region, is the top coal producer in the country, providing over 40% of U.S. coal. Coal from Wyoming is dominantly sub-bituminous. The Appalachian region produces 27% of U.S. coal, most of which comes from West Virginia, Pennsylvania, and Kentucky. Coal in the Appalachian region is higher grade bituminous and anthracite coal.
Due to its relatively low cost and abundance, coal is used to generate about half of the electricity consumed in the United States. Coal is the largest domestically produced source of energy. Coal production increased rapidly in the 20th century, but has recently declined (Figure 6). Current world reserves are estimated at 826,000 million tonnes, with nearly 30% of that in the United States. It is a major fuel resource that the United States controls domestically.

Natural Gas Extraction and Use
Natural gas is often found along with deposits of oil or coal, and gas can be extracted and captured along with these other resource. Natural gas meets 20% of world energy needs and 25% of United States needs. In the last few years a new reserve of natural gas has been identified: shale resources. The United States possesses 2,552 trillion cubic feet (Tcf) (72.27 trillion cubic meters) of potential natural gas resources, with shale resources accounting for 827 Tcf (23.42 tcm). As natural gas prices increased it has become more economical to extract the gas from shale. The development of the process called fracking, explained below, has allowed for the extraction of gas from shale rock. This gas was not recoverable prior to the development of fracking. Fracking has allowed for a huge increase in gas production in recent decades in places like the Marcellus Shale of Pennsylvania. Figure 7 shows the past and forecasted U.S. natural gas production and the various sources. The current reserves are enough to last about 110 years at the 2009 rate of U.S. consumption (about 22.8 Tcf per year -645.7 bcm per year).

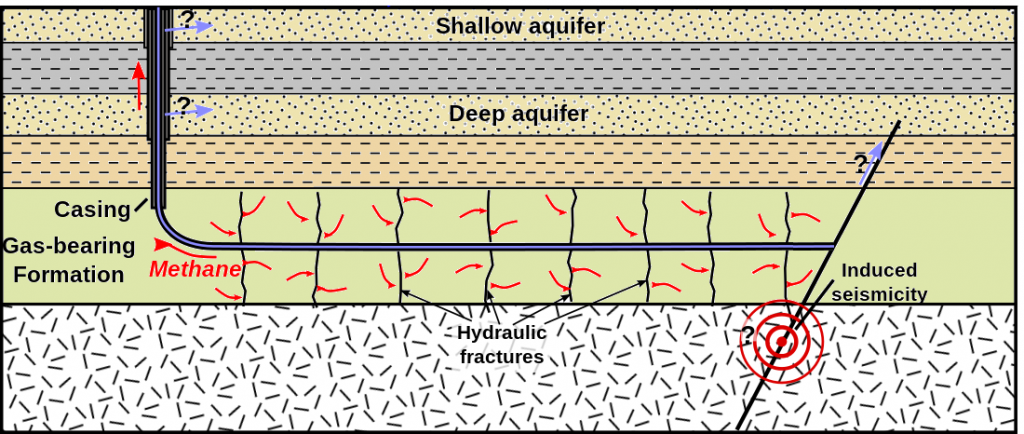
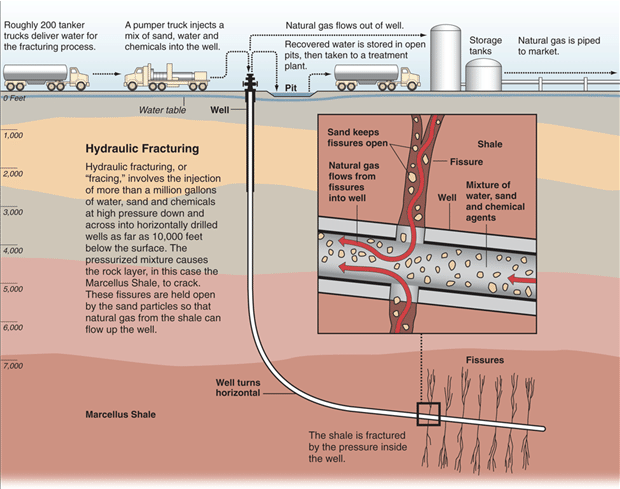
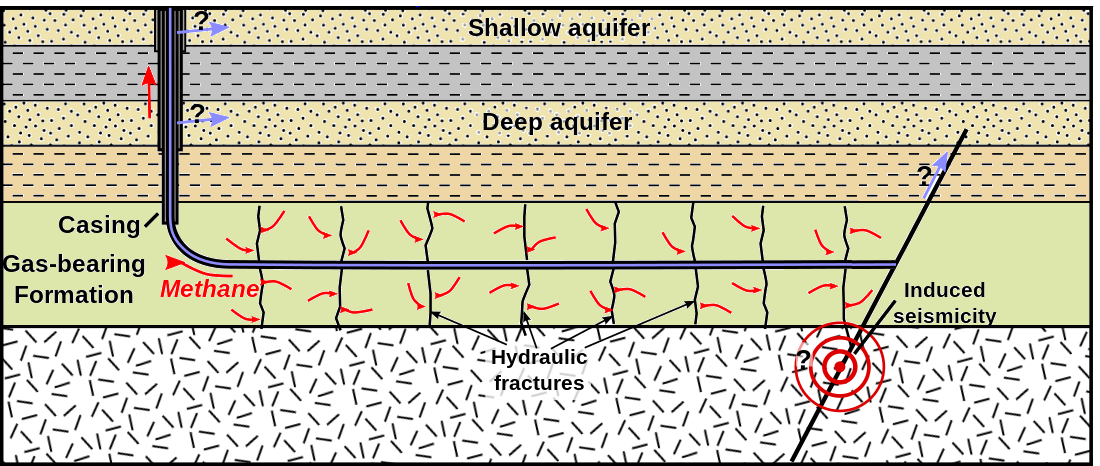
Oil and gas are extracted from the reservoir rock through drilling deep wells and pumping the oil and gas out of the ground. To aid in removing oil and gas, hot fluids and steam can be injected into wells placed in the reservoir rocks to help “thin” the oil and make pumping easier. Another method to increase pumping efficiency is hydrofracturing or “fracking”. This is where high pressure fluids are injected into wells to cause the rocks to break up or fracture, which can help release oil and gas (Figure 8). Fracking is particularly useful when oil and gas are locked into relatively impermeable rocks such as shales which means regular pumping extraction is difficult and inefficient.
Oil Extraction and Use
Thirty seven percent of the world’s energy consumption and 43% of the United States energy consumption comes from oil. Scientists and policy-makers often discuss the question of when the world will reach peak oil production, the point at which oil production is at its greatest and then declines. It is generally thought that peak oil will be reached by the middle of the 21st Century, although making such estimates is difficult because a lot of variables must be considered. Currently world reserves are 1.3 trillion barrels, or 45 years left at current level of production.
There are other domestic sources of oil that are being considered as conventional resources and are being depleted. These include tar sands – deposits of moist sand and clay with 1-2 percent bitumen (thick and heavy petroleum rich in carbon and poor in hydrogen). These are removed by strip mining. Another source is oil shale, which is sedimentary rock filled with organic matter that can be processed to produce liquid petroleum. Extracted by strip mining or creating subsurface mines, oil shale can be burned directly like coal or baked in the presence of hydrogen to extract liquid petroleum. However, the net energy values are low and they are expensive to extract and process. Both of these resources have severe environmental impacts due to strip mining, carbon dioxide, methane and other air pollutants similar to other fossil fuels.
The Global Dependence of Transportation on Oil
Two-thirds of oil consumption is devoted to transportation, providing fuel for cars, trucks, trains and airplanes. For the United States and most developed societies, transportation is woven into the fabric of our lives, a necessity as central to daily operations as food or shelter. The concentration of oil reserves in a few regions or the world makes much of the world dependent on imported energy for transportation. The rise in the price of oil in the last decade makes dependence on imported energy for transportation an economic as well as an energy issue. The United States, for example, now spends upwards of $350 billion annually on imported oil, a drain of economic resources that could be used to stimulate growth, create jobs, build infrastructure and promote social advances at home.
Impacts of Fossil Fuels
Impacts of Coal
Coal is plentiful and inexpensive, when looking only at the market cost relative to the cost of other sources of electricity, but its extraction, transportation, and use produces a multitude of environmental impacts that the market cost does not truly represent. Coal emits sulfur dioxide, nitrogen oxide, and mercury, which have been linked to acid rain, smog, and health issues. Burning of coal emits higher amounts of carbon dioxide per unit of energy than the use of oil or natural gas. Coal accounted for 35% of the total United States emissions of carbon dioxide released into the Earth’s atmosphere in 2010. Ash generated from combustion contributes to water contamination. Some coal mining has a negative impact on ecosystems and water quality, and alters landscapes and scenic views (such as with mountaintop mining).
There are also significant health effects and risks to coal miners and those living in the vicinity of coal mines. Traditional underground mining is risky to mine workers due to the risk of entrapment or death. Over the last 15 years, the U.S. Mine Safety and Health Administration has published the number of mine worker fatalities and it has varied from 18-48 per year. Twenty-nine miners died on April 6, 2010 in an explosion at the Upper Big Branch coal mine in West Virginia, contributing to the uptick in deaths between 2009 and 2010. In other countries, with less safety regulations, accidents occur more frequently. In May 2011, for example, three people died and 11 were trapped in a coalmine in Mexico for several days. There is also risk of getting black lung disease (pneumoconiosis). This is a disease of the lungs caused by the inhalation of coal dust over a long period of time. It causes coughing and shortness of breath. If exposure is stopped the outcome is good. However, the complicated form may cause shortness of breath that gets increasingly worse.
Coal often contains minerals high in iron sulfide (like pyrite, a.k.a. fool’s gold) and old mines or mine waste piles that are improperly reclaimed can result in acid mine drainage (AMD). AMD changes the chemistry of rivers, creating acidic waters that are high in heavy metals and toxic to the environment. As the highly acidic waters leaching out of the mine or waste pile mix with river water the pH rises slightly (but is still very acidic) allowing iron hydroxides to precipitate in the water. This iron hydroxide is called yellow boy and gives the water the characteristic yellow-orange color associated with AMD (Figure 9).

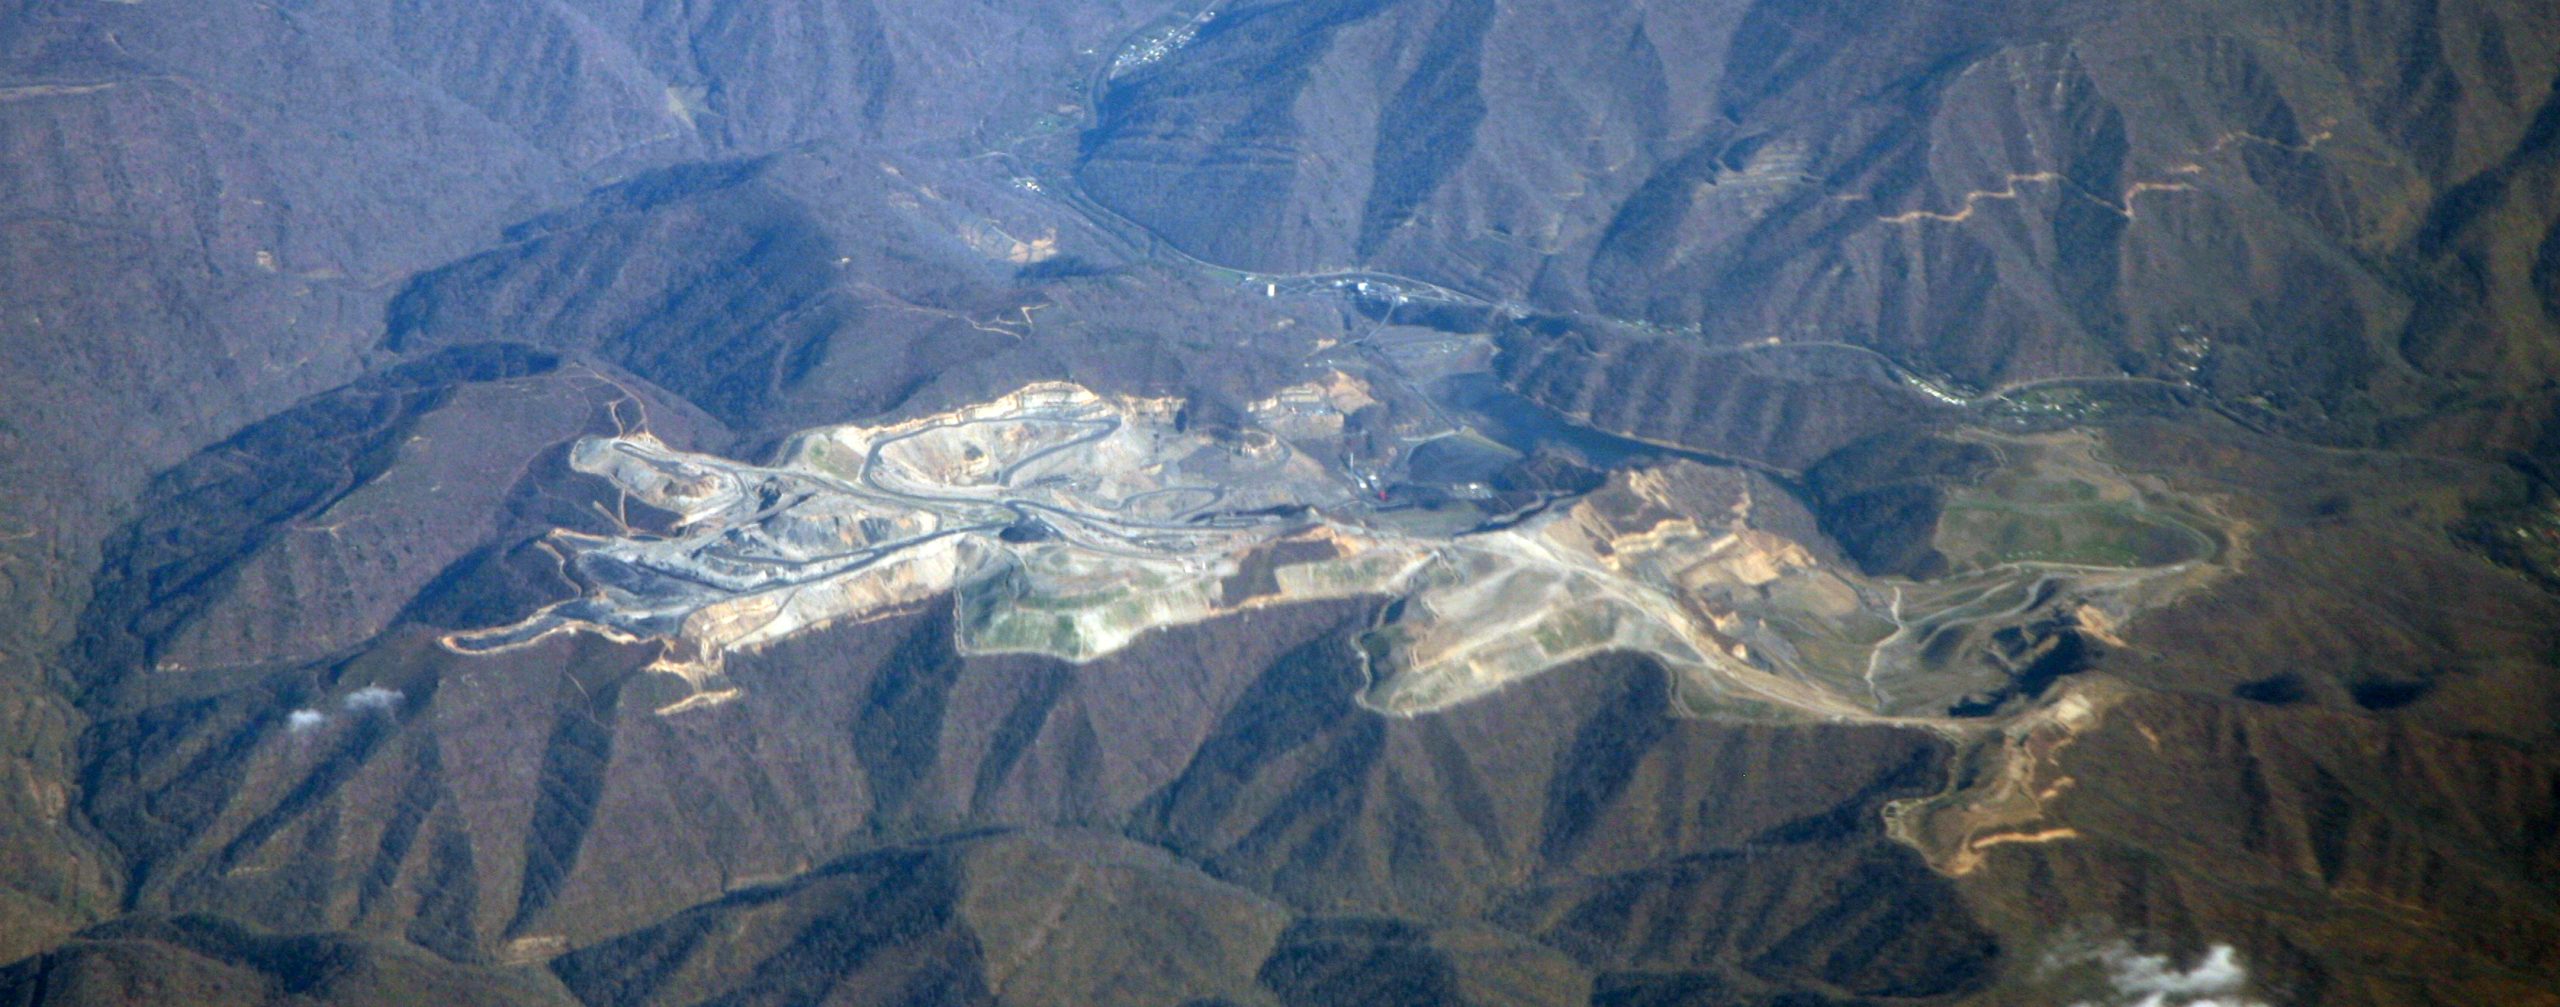
Mountaintop mining (MTM), while less hazardous to workers than traditional mining, has particularly detrimental effects on land resources. MTM is a surface mining practice involving the removal of mountaintops to expose coal seams, and disposing of the associated mining waste in adjacent valleys. This form of mining is very damaging to the environment because it literally removes the tops of mountains, destroying the existing habitat. Additionally, the debris from MTM is dumped into valleys burying streams and other important habitat.
Kingston Fossil Plant Coal Ash Slurry Spill
On December 22, 2008, the dike surrounding a coal ash slurry impoundment associated with the Tennessee Valley Authority’s (TVA) Kingston Fossil Plant (a coal fired power plant) ruptured, releasing 1.1 billion gallons of coal ash slurry (Figure 11). The coal slurry flowed into the Emory and Clinch Rivers, both of which are tributaries of the Tennessee River. As of 2023, this is the largest coal slurry spill in U.S. history, topping the former record holder, the Martin County coal spill in West Virginia, which released 306 million gallons of coal slurry.
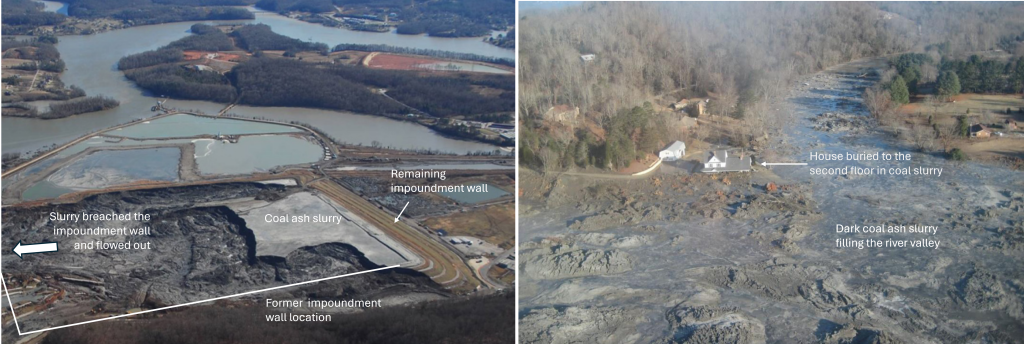
Coal ash slurry is the waste mixture of water and coal ash created by burning coal for electricity. At the TVA site, this waste was being stored using a wet pond method, which has higher potential for spills than a dry pond method. TVA engineers had raised concerns about this impoundment and leaks had been found for decades, with minor repairs being made instead of switching to a dry storage method due to the costs that would incur.
Significantly elevated levels of toxic metals including arsenic, lead, mercury, and copper were found in samples of slurry and river water following the spill. Within 10 years of the disaster, hundreds of the cleanup workers were ill and more than 30 had died with causes believed to be linked to the cleanup.
Impacts of Natural Gas
Natural gas is a preferred fossil fuel when considering its environmental impacts. Specifically, when burned, much less carbon dioxide (CO2), nitrogen oxides, and sulfur dioxide are omitted than from the combustion of coal or oil. It also does not produce ash or toxic emissions. However, natural gas is mainly composed of methane (CH4), and when methane is released directly into the atmosphere it is a very potent greenhouse gas.
Natural gas is released into the atmosphere from coal mines, oil and gas wells, and natural gas storage tanks, pipelines, and processing plants. These leaks are the source of about 25% of total U.S. methane emissions, which translates to three percent of total U.S. greenhouse gas emissions. When natural gas is produced but cannot be captured and transported economically, it is “flared,” or burned at well sites, which converts it to CO2. This is considered to be safer and better than releasing methane into the atmosphere because CO2 is a less potent greenhouse gas than methane.
Natural gas production can result in the production of large volumes of contaminated water. This water has to be properly handled, stored, and treated so that it does not pollute land and water supplies. Extraction of shale gas is more problematic than traditional sources due to fracking, since it requires large amounts of water (Figure 12). The technique uses high-pressure fluids to fracture the normally hard shale deposits and release gas and oil trapped inside the rock. To promote the flow of gas out of the rock, small particles of solids are included in the fracturing liquids to lodge in the shale cracks and keep them open after the liquids are depressurized. The considerable use of water may affect the availability of water for other uses in some regions and this can affect aquatic habitats. If mismanaged, hydraulic fracturing fluid can be released by spills, leaks, or various other exposure pathways. The fluid contains potentially hazardous chemicals such as hydrochloric acid, glutaraldehyde, petroleum distillate, and ethylene glycol. The risks of fracking have been highlighted in popular culture in the documentary, Gasland (2010).
The raw gas from a well may contain many other compounds besides the methane that is being sought, including hydrogen sulfide, a very toxic gas. Natural gas with high concentrations of hydrogen sulfide is usually flared which produces CO2, carbon monoxide, sulfur dioxide, nitrogen oxides, and many other compounds. Natural gas wells and pipelines often have engines to run equipment and compressors, which produce additional air pollutants and noise.
Impacts of Oil
Oil is usually found one to two miles (1.6 – 3.2 km) below the Earth’s surface, whether that is on land or ocean. Once oil is found and extracted it must be refined, which separates and prepares the mix of crude oil into the different types for gas, diesel, tar, and asphalt. Oil refining is one of top sources of air pollution in the United States for volatile organic hydrocarbons and toxic emissions, and the single largest source of carcinogenic benzene. When petroleum is burned as gasoline or diesel, or to make electricity or to power boilers for heat, it produces a number of emissions that have a detrimental effect on the environment and human health:
- Carbon dioxide (CO2) is a greenhouse gas and a source of climate change.
- Sulfur dioxide (SO2) causes acid rain, which damages plants and animals that live in water, and it increases or causes respiratory illnesses and heart diseases, particularly in vulnerable populations like children and the elderly.
- Nitrous oxides (NOx) and Volatile Organic Carbons (VOCs) contribute to ozone at ground level, which is an irritant and causes damage to the lungs.
- Particulate Matter (PM) produces hazy conditions in cities and scenic areas, and combines with ozone to contribute to asthma and chronic bronchitis, especially in children and the elderly. Very small, or “fine PM,” is also thought to penetrate the respiratory system more deeply and cause emphysema and lung cancer.
- Lead can have severe health impacts, especially for children.
Fracking in North Dakota
Fracking technology led to the oil in North Dakota associated with the Bakken Formation. This shale formation contains large quantities of oil and gas that were not economical to extract prior to the advent of fracking because of the low permeability rock. The boom in North Dakota began around 2008, reached a peak around 2012 and tapered off as oil prices dropped around 2018.
While the economy of North Dakota was positively affected by this boom, the environment was not. While the bulk of fracking fluid is water, it also contains sand and other chemicals. As the fractures are made, sand is blown into them to keep the cracks open and provide porosity to increase extraction efficiency. The mix of the other chemicals is typically proprietary information, thereby making the potential health risks associated with spills or leaks into underground aquifers difficult to assess. In addition, fractures can also allow the oil and gas to migrate upward into drinking water aquifers, contaminating the drinking water supply.
The sheer quantity of water needed for fracking processes (1.5 – 9.7 million gallons of water per well) is also of concern at a time when freshwater supplies for drinking water, agriculture, and ecosystems are scarce. In addition, large volumes of wastewater are also produced. These contain dissolved chemicals and other pollutants and therefore must be contained and treated.
The injection of fluids at depth to manufacture porosity has also created earthquake swarms. While most of the earthquakes are small, some have been large enough to cause damage, which is a particular problem given they are occurring in areas that are ill equipped to deal with earthquakes given they are largely safe from natural earthquakes.
Air quality is affected by both the fracking and venting of natural gas but also through the mining of sand needed for the fracking fluid. This extends the environmental impact beyond just the region immediately surrounding the fracking. Fine silica sand dust can be inhaled causing lung infections and other respiratory illnesses. Minnesota and Wisconsin are the main mining locations for fracking sand in the U.S.
As the United States tries to extract more oil from its own dwindling resources, they are drilling even deeper into the earth and increasing the environmental risks. The largest United States oil spill to date began in April 2010 when an explosion occurred on Deepwater Horizon Oil Rig killing 11 employees and spilling nearly 200 million gallons of oil before the resulting leak could be stopped. Wildlife, ecosystems, and people’s livelihood were adversely affected. A lot of money and huge amounts of energy were expended on immediate clean-up efforts. The long-term impacts are still not known.
Contributions of Coal and Natural Gas to Electricity Generation
At present the fossil fuels used for electricity generation in the US are predominantly coal (44%) and natural gas (23%); petroleum accounts for approximately 1%. Coal electricity traces its origins to the early 20th Century, when it was the natural fuel for steam engines given its abundance, high energy density and low cost. Natural Gas is a later addition to the fossil electricity mix, arriving in significant quantities after World War II and with its greatest growth since 1990. Of the two fuels, coal emits almost twice the carbon dioxide as natural gas for the same heat output, making it significantly greater contributor to global warming and climate change.
The Future of Coal and Natural
The future development of coal and natural gas depend on the degree of public and regulatory concern for carbon emissions, and the relative price and supply of the two fuels. Supplies of coal are abundant in the United States, and the transportation chain from mines to power plants is well established. The primary unknown factor is the degree of public and regulatory pressure that will be placed on carbon emissions. Strong regulatory pressure on carbon emissions would favor retirement of coal and addition of natural gas power plants. This trend is reinforced by the recent dramatic expansion of shale gas reserves in the United States due to advances in drilling technology. Shale natural gas production has increased 48% annually in the years 2006 – 2010, with more increases expected. Greater United States production of shale gas will gradually reduce imports and could eventually make the United States a net exporter of natural gas.
Nuclear Power
Nuclear power is energy released from the radioactive decay of elements, such as uranium, which releases large amounts of energy. Nuclear power plants produce no carbon dioxide and, therefore, are often considered an alternative fuel (fuels that are neither fossil fuels nor renewable). Currently, world production of electricity from nuclear power is about 19.1 trillion KWh, with the United States producing and consuming about 22% of that. Nuclear power provides about 9% of the electricity in the United States.
![]()
Figure 13. Three Mile Island in Pennsylvania, site of a partial nuclear meltdown in 1979. Creative Commons Attribution-Share Alike 4.0 International. Source: https://commons.wikimedia.org/wiki/File:Exelon_Three_Mile_Island_Nuclear_Generating_Station.jpg
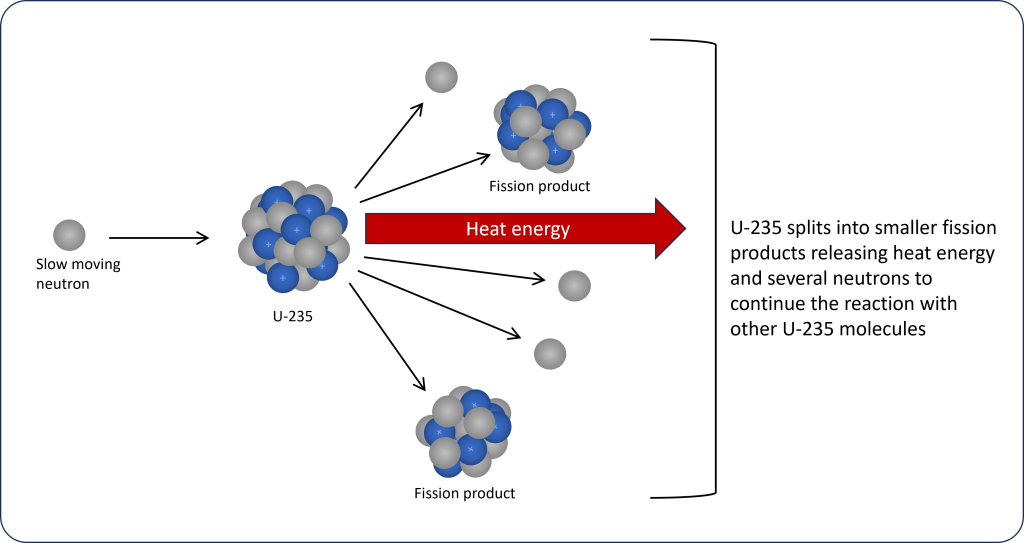
Nuclear reactors use an isotope of uranium, U-235, as fuel. The nuclear reaction starts with slow moving neutrons being introduced inside the nuclear reactor. These slow neutrons collide with the nucleus of a U-235 causing it to split apart into smaller molecules called fission products and releasing large amounts of heat energy. Several neutrons are also released during fission, which can then collide with other U-235 molecules leading to a chain reaction (Figure 14). This chain reaction allows the process to become self-sustaining once it has started.
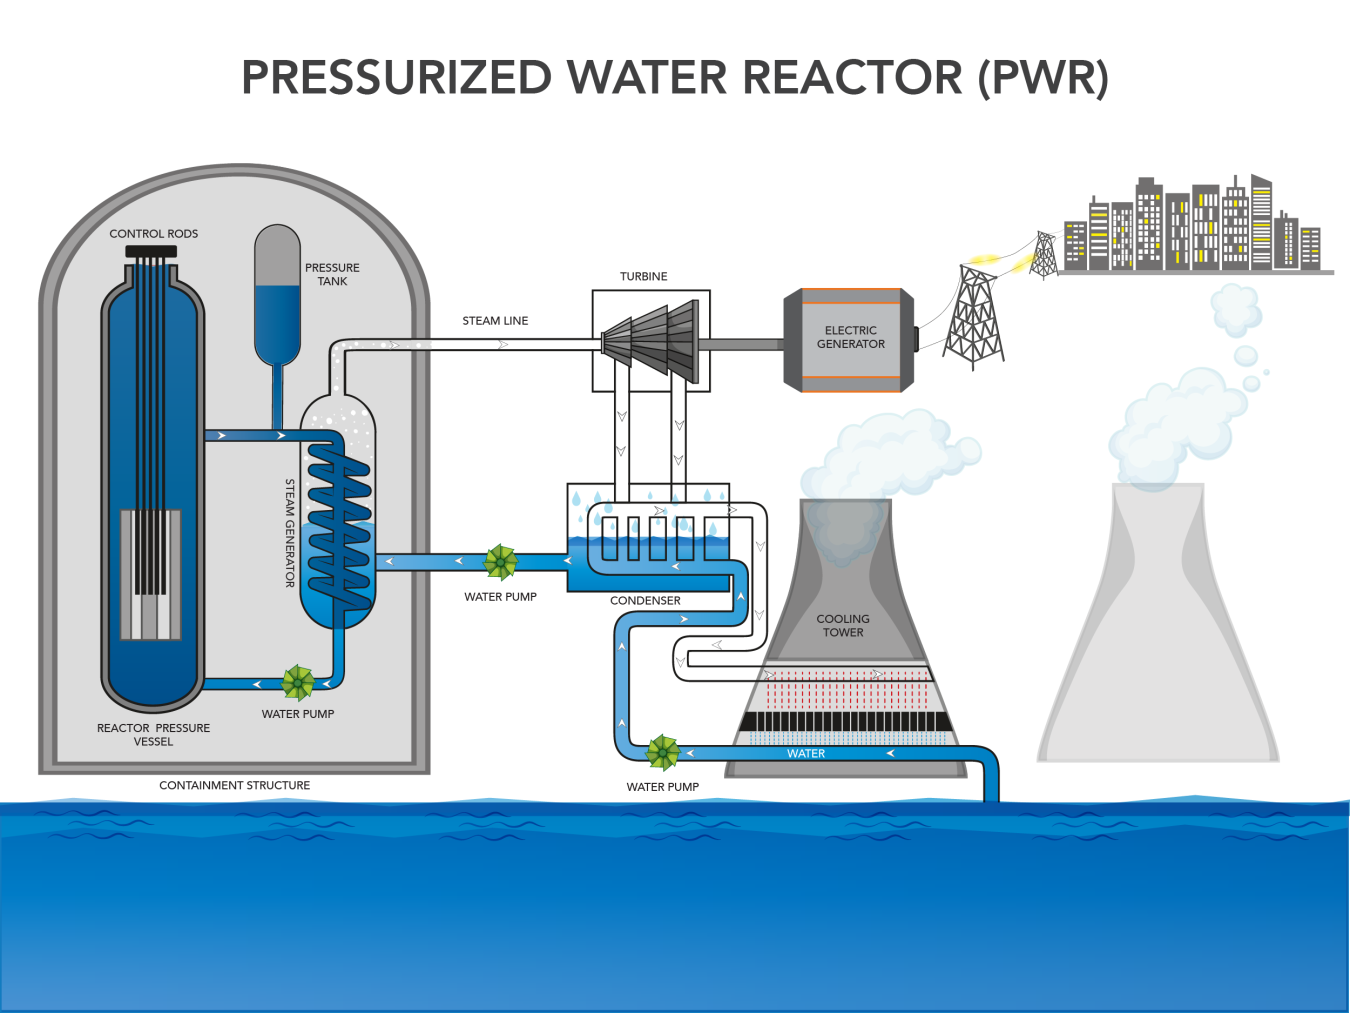
The heat energy generated during the fission of U-235 is captured by a cooling liquid inside the reactor. The heat in the reactor core is used to boil water to generate steam that is used to run a turbine and generate electricity. This steam is then cooled back down to water and reused in the process. There is not one standard nuclear reactor design so the mechanics of exactly how and where steam is generated in the reactor change based on design. Figure 15 shows the basic process for a pressurized water reactor, which is the main style of nuclear reactor in the U.S. In this reactor type, water in the reactor vessel is under pressure such that it can become superheated without turning to steam. It is then pumped to a separate steam vessel where its heat is transferred to water circulating in a separate set of pipes before it returns to the reactor vessel. Water in the separate pipes of the steam vessel absorbs the heat and boils, creating steam. This steam runs the turbine to generate electricity and then is cooled to be reused in the steam vessel. A lot of water is lost to steam during this process, so it is essential that nuclear power plants are located near a large and reliable source of water to replenish water lost to steam.
Impacts of Nuclear
There are environmental challenges with nuclear power. Mining and refining uranium ore and making reactor fuel demands a lot of energy. Also, nuclear power plants are very expensive and require large amounts of metal, concrete, and energy to build. The main environmental challenge for nuclear power is the wastes including uranium mill tailings, spent (used) reactor fuel, and other radioactive wastes. These materials have long radioactive half-lives and thus remain a threat to human health for thousands of years. The half life of a radioactive element is the time it takes for 50% of the material to radioactively decay. The U.S. Nuclear Regulatory Commission regulates the operation of nuclear power plants and the handling, transportation, storage, and disposal of radioactive materials to protect human health and the environment.
By volume, the waste produced from mining uranium, called uranium mill tailings, is the largest waste and contains the radioactive element radium, which decays to produce radon, a radioactive gas. High-level radioactive waste consists of used nuclear reactor fuel. This fuel is in a solid form consisting of small fuel pellets in long metal tubes and must be stored and handled with multiple containment, first cooled by water and later in special outdoor concrete or steel containers that are cooled by air. There is no long-term storage facility for this fuel in the United States.
Long term storage sites have strict requirements due to the dangerous nature of nuclear waste. The waste must be kept in a place that is safe from contaminating humans, water, and other natural resources with radiation. As the decay rate of nuclear fuel is very long (U-235 has a half-life of 704 million years) it is radioactive for much longer than any human lifespan, so its safe storage must be ensured long into the future. These sites must also be in an area that is safe from earthquakes so that ground disruptions cannot harm the storage casks or create faults that cause radiation to leak. Deep geologic repositories are the best solution for long term storage, but finding areas deep underground that meet all of the storage requirements is difficult. In the U.S., the location chosen for long term waste storage is underneath Yucca Mountain in the middle of the Nevada desert. This site was approved in the late 1980s with a pilot project for waste storage being built in the early 2000s. Since that time, use of Yucca Mountain as a nuclear storage site has been mired in controversy and has not opened for waste disposal collection, leaving U.S. nuclear waste in interim storage. The people of Nevada do not want to house the waste for an entire country, particularly because they are one of the few states that does not produce any nuclear energy and therefore create no nuclear fuel waste. Yucca Mountain is located on Western Shoshone treaty land and the burial of nuclear waste there is highly contested by the Western Shoshone Nation as they have strong ties to the land and burying nuclear waste on this land is antithetical to their culture. The suggestion to use this land is seen as environmental racism.
Recycling can potentially recover 96% of material in a spent fuel rod, however, this is not done in the U.S. for several reasons. Firstly, it is a safeguarding measure taken in response to signing the Nuclear Non-Proliferation Treaty in 1968, whose purpose is to prevent the spread of nuclear weapons. Recycling recovers materials such as plutonium that could be used in nuclear weapons production. The other reason recycling is not done in the U.S. is that it requires a different type of reactor not present in the U.S., and therefore high costs would be incurred to build new recycling reactors. Recycling fuel rods is not seen as not necessary in the U.S. given the availability of nuclear fuel currently. As nuclear fuel is non-renewable the availability will change in the future, but that is not expected for over 100 years, at which time, recycling could extend the lifetime of nuclear fuel for many hundreds of years more. France, Japan, Belgium, and Russia all recycle nuclear waste.
There are many other regulatory precautions governing permitting, construction, operation, and decommissioning of nuclear power plants due to risks from an uncontrolled nuclear reaction. The potential for contamination of air, water and food is high should an uncontrolled reaction occur. Even when planning for worst-case scenarios, there are always risks of unexpected events. Nuclear meltdowns result from out-of-control chain reactions that produce more heat than the cooling fluid can remove. This can raise temperatures inside the reactor to levels that will literally make the fuel rods melt. This is dangerous as nuclear fuel is highly radioactive and a meltdown would release enormous amounts of radiation. To prevent meltdowns, a set of control rods are present that can be inserted into the reactor between the fuel rods. Control rods are made of materials that absorb neutrons so when inserted they reduce or stop the nuclear reaction rate by removing excess neutrons.
International Nuclear and Radiological Event Scale
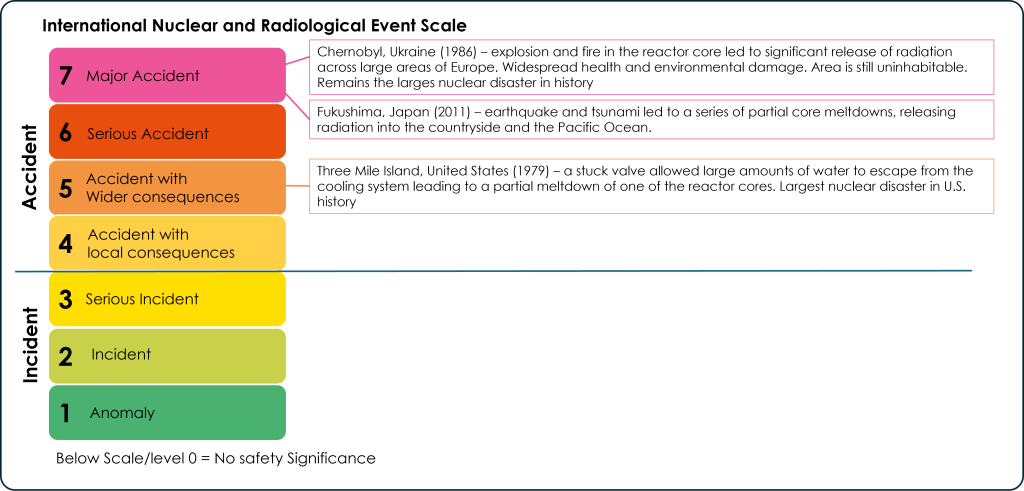
The International Nuclear and Radiological Event Scale (INES) was established to categorize the severity of nuclear accidents and incidents. It is divided into 7 levels, with 7 being a major accident and 1 being a small anomaly. The only level 7 accidents to have occurred are the Chernobyl, Ukraine nuclear disaster in 1986 and the Fukushima, Japan disaster in 2011. The most significant nuclear accident in the U.S. was a level 5 accident that occurred at the Three Mile Island nuclear plant in Pennsylvania in 1979 (Figure 16).
Most nuclear power issues are smaller, at the incident level (1-3 on the INES). Nuclear accidents have the potential to harm ecosystems through the release of radiation. This can poison habitats and waterways and contaminate agricultural land. Developmental damage and radiation poisoning can affect humans and animals and in cases of severe exposure can cause rapid death.
Debating Nuclear Energy
From a sustainability perspective, nuclear electricity presents an interesting dilemma. On the one hand, nuclear electricity produces no carbon emissions, a major sustainable advantage in a world facing anthropogenic climate change. On the other hand, nuclear electricity produces dangerous waste that i) must be stored out of the environment for thousands of years, ii) can produce bomb-grade plutonium and uranium that could be diverted by terrorists or others to destroy cities and poison the environment, and iii) threatens the natural and built environment through accidental leaks of long-lived radiation. Thoughtful scientists, policy makers, and citizens must weigh the benefit of this source of carbon-free electricity against the environmental risk of storing spent fuel, the societal risk of nuclear proliferation, and the impact of accidental or deliberate release of radiation. There are very few examples of humans having the power to permanently change the dynamics of the earth. Global climate change from carbon emissions is one example, and radiation from the explosion of a sufficient number of nuclear weapons is another. Nuclear electricity touches both of these opportunities, on the positive side for reducing carbon emissions and on the negative side for the risk of nuclear proliferation.
Nuclear electricity came on the energy scene remarkably quickly. Following the development of nuclear technology at the end of World War II for military ends, nuclear energy quickly acquired a new peacetime path for inexpensive production of electricity. Eleven years after the end of World War II, a very short time in energy terms, the first commercial nuclear reactor produced electricity at Calder Hall in Sellafield, England. The number of nuclear reactors grew steadily to more than 400 by 1990, four years after the Chernobyl disaster in 1986 and eleven years following Three Mile Island in 1979. Since 1990, the number of operating reactors has remained approximately flat, with new construction balancing decommissioning due to public and government reluctance to proceed with nuclear electricity expansion plans.
The outcome of this debate will determine whether the world experiences a nuclear renaissance that has been in the making for several years. The global discussion has been strongly impacted by the unlikely nuclear accident in Fukushima, Japan in March 2011. The Fukushima nuclear disaster was caused by an earthquake and tsunami that disabled the cooling system for a nuclear energy complex consisting of operating nuclear reactors and storage pools for underwater storage of spent nuclear fuel ultimately causing a partial meltdown of some of the reactor cores and release of significant radiation. This event, 25 years after Chernobyl, reminds us that safety and public confidence are especially important in nuclear energy; without them expansion of nuclear energy will not happen.
Attribution:
This section is adapted from:
- Environmental Biology, by Matthew R. Fisher, Oregon Coast Community College, published using Pressbooks, under a CC BY (Attribution: https://creativecommons.org/licenses/by/4.0/) license. It may differ from the original.
- Environmental Geology, by Lindsay J. Iredale, Normandale Community College, published using Pressbooks, under a CC BY-NC.SA 4. (Attribution-NonCommercial-ShareAlike 4.0 International; https://creativecommons.org/licenses/by-nc-sa/4.0/). It may differ from the original.
Media Attributions
- Private: CO2 by fossil fuel source
- Private: Coal ranks
- death-rates-from-energy-production-per-twh
- main
- chart2
- annual precipitation © Lindsay Iredale is licensed under a CC BY (Attribution) license
- Mountaintop_Removal_Mining (1)
- Private: coal slurry impoundment breach
- Private: nuclear reaction
- Private: nuclear disaster
