"

7.3 Freshwater Supply

Freshwater Supply

Primary Fresh Water Resources: Precipitation

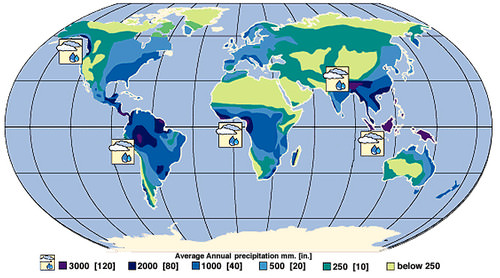
Precipitation levels are unevenly distributed around the globe, affecting freshwater availability (Figure 1). More precipitation falls near the equator, whereas less precipitation tends to fall near 30 degrees north and south latitude, where the world’s largest deserts are located. These rainfall and climate patterns are related to global wind circulation cells. The intense sunlight at the equator heats the air, causing it to rise and cool, which decreases the ability of the air mass to hold water vapor and results in frequent rainstorms. Around 30 degrees north and south latitude, descending air conditions produce warmer air, which increases its ability to hold water vapor and results in dry conditions. The dry air conditions and the warm temperatures of these latitude belts favor evaporation. Global precipitation and climate patterns are also affected by the size of continents, major ocean currents, and mountains.


World Rainfall Map
Figure 1. World Rainfall Map. The false-color map above shows the amount of rain that falls worldwide. High rainfall areas include Central and South America, western Africa, and Southeast Asia. Since these areas receive so much rainfall, they are where most of the world’s rainforests grow. Areas with very little rainfall usually turn into deserts. The desert areas include North Africa, the Middle East, western North America, and Central Asia. Source: United States Geological Survey Earth Forum, Houston Museum Natural Science

Surface Water Resources: Drainage Basins and Rivers

Surface Runoff
Figure 2. Surface runoff is part of overland flow in the water cycle Source: James M. Pease at Wikimedia Commons

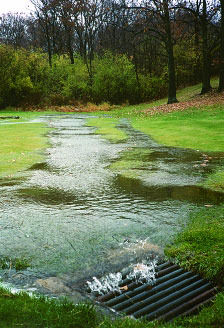
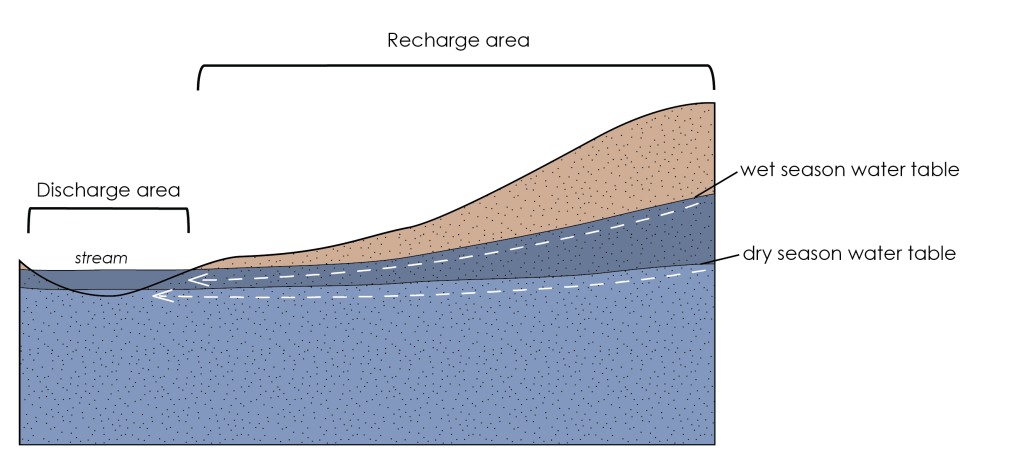
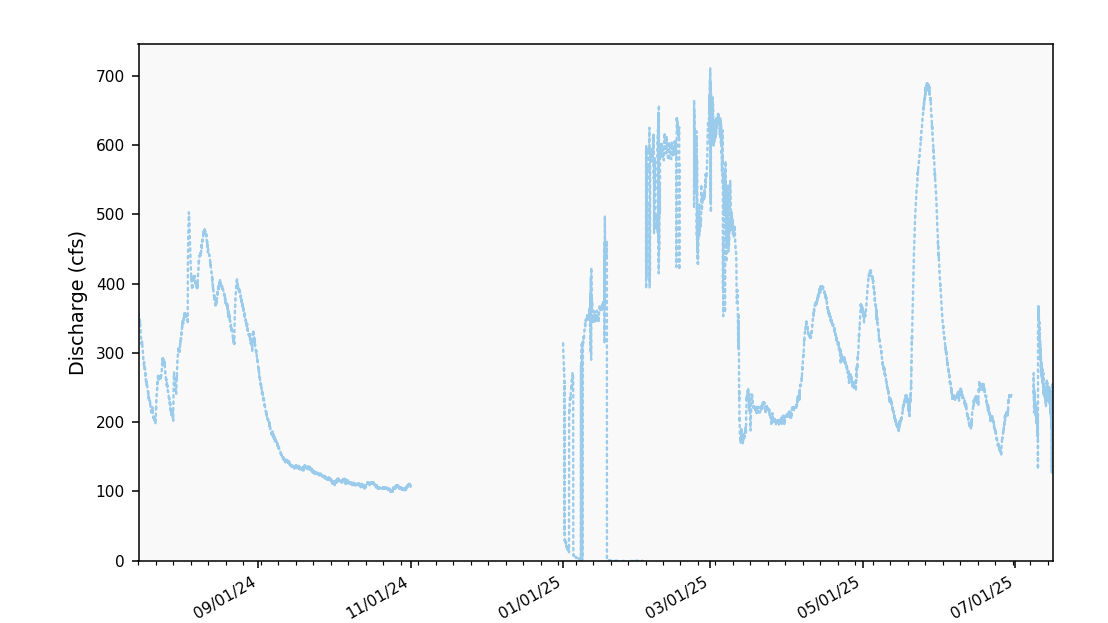
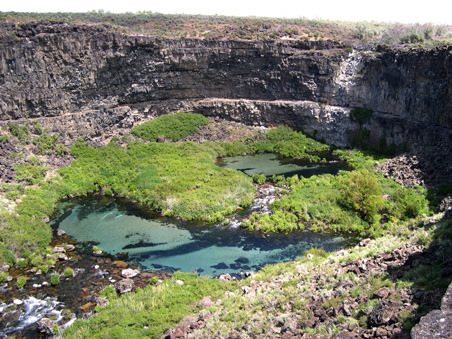
Flowing water from rain and melted snow on land enters river channels by surface runoff (Figure 2) and groundwater seepage (Figure 3). River discharge describes the volume of water moving through a river channel over time (Figure 4). The relative contributions of surface runoff vs. groundwater seepage to river discharge depend on precipitation patterns, vegetation, topography, land use, and soil characteristics. Soon after a heavy rainstorm, river discharge increases due to surface runoff. The steady normal flow of river water is mainly from groundwater that discharges into the river. Gravity pulls river water downhill toward the ocean. Along the way, the moving water of a river can erode soil particles and dissolve minerals. Groundwater also contributes a large amount of the dissolved minerals in river water.


Figure 3: Recharge: Groundwater contributes different volumes of water to streams at different times of year.


Figure 4: Leaf River discharge at Aldrich, MN. Source: https://www.dnr.state.mn.us/waters/csg/site.html?id=13056001

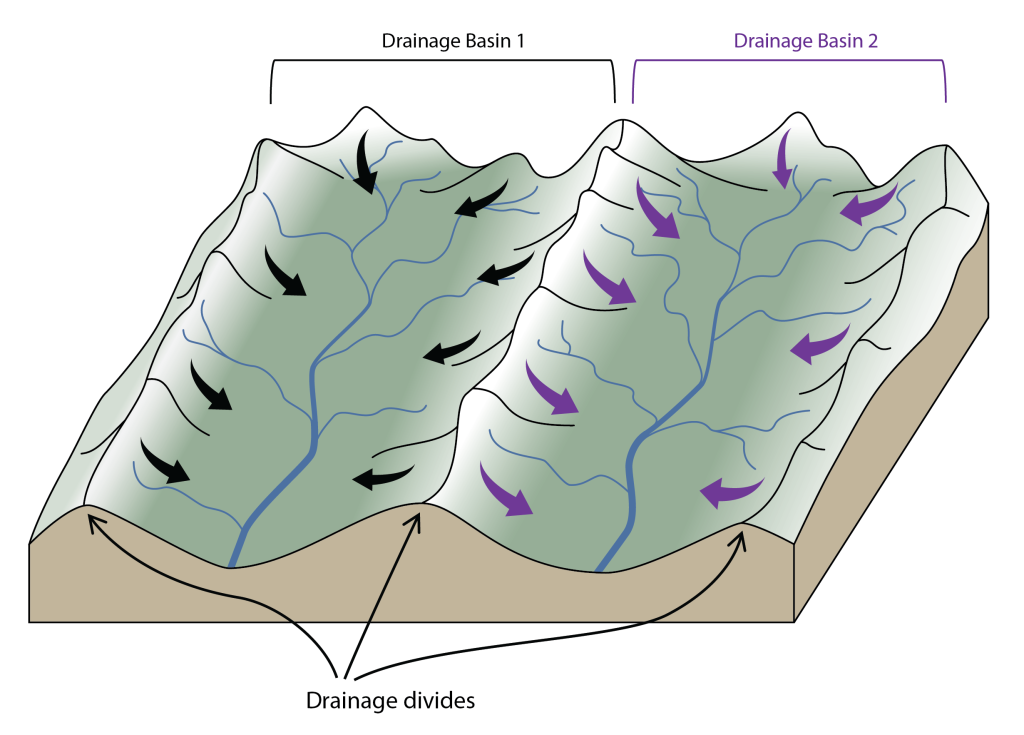
The area from which water flows to form a stream is known as its drainage basin (interchangeably referred to as a watershed in North America). All the precipitation (rain or snow), plus any meltwater or discharging groundwater within this area will eventually flows into its stream and then on to the final destination (typically the ocean), unless some of that water infiltrates into the ground, in which case, it may flow as groundwater into a different watershed. Neighboring watersheds are separated from each other by higher ridges and peaks on the landscape called drainage divides (Figure 5).

Illustration of two drainage basins (valley areas) with ridges between them and on their outside edges (drainage divides). All rain and surface water within drainage basin 1 will flow into the basin 1 river, and all rain and surface water within drainage basin 2 will flow into the basin 2 river.
Figure 5. Illustration of two drainage basins separated from neighboring basins by drainage divides. All precipitation falling or snow melting within drainage basin A (left) will flow into its river (black flow arrows) and all precipitation falling or snow melting within drainage basin B (right) will flow into its river (purple flow arrows). High mountains and ridges create the drainage divides between these basins and neighboring basins. Source: Lindsay Iredale (2024). CC BY-4.0

A tributary is the name given to a stream that flows into a larger stream.

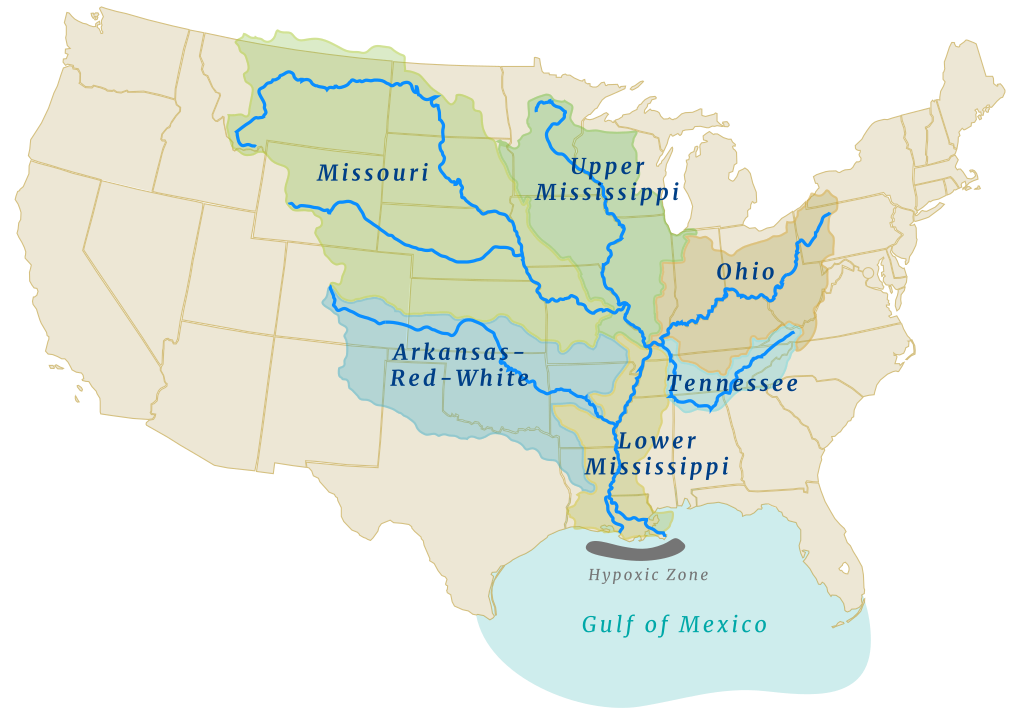
Watersheds can be discussed at different scales, and can be small, such as several small trickles coming together to make a small creek, or large, such as big rivers (and their associated tributaries) that come together to make a major river. The Mississippi-Missouri Watershed is the largest in the U.S. (and 3rd largest in the world!). It includes approximately 40% of the U.S., a measure that includes the smaller drainage basins, such as the Ohio River and Missouri River, that contribute to it.  Within it there are several smaller watersheds, and those contain yet smaller watersheds.  The water that falls within these watersheds eventually makes it to the Gulf of Mexico (Figure 6). Continental divides are major drainage divides that separate watersheds that flow to different water bodies (e.g., to Gulf of Mexico versus Atlantic Ocean vs. Pacific Ocean).


Map of the U.S. with the Mississippi River drainage basin highlighted. The Mississippi River basin is composed of 6 smaller basins which are (clockwise starting at the basin in Minnesota): Upper Mississippi, Ohio, Tennessee, Lower Mississippi, Arkansas-Red-White, and Missouri.
Figure 6. Drainage basins within the larger Mississippi River drainage basin. The overall Mississippi River drainage basin is made up of the Missouri, Arkansas-Red-White, Upper Mississippi, Lower Mississippi, Ohio, and Tennessee drainage basins. Source: Environmental Protection Agency (2023) Public Domain. Found here.

Surface Water Resources: Lakes

Groundwater Seepage
Figure 7. Groundwater Seepage. Groundwater seepage can be seen in Box Canyon in Idaho, where approximately ten cubic meters per second of seepage emanates from its vertical headwall. Source: NASA
In addition to rivers, lakes can also be an excellent source of fresh water for human use. They usually receive water from surface runoff and groundwater discharge. They tend to be short-lived on a geological time scale because they constantly fill in with sediment supplied by rivers. Lakes form in various ways, including glaciation, recent tectonic uplift (e.g., Lake Tanganyika, Africa), and volcanic eruptions (e.g., Crater Lake, Oregon). People also create artificial lakes (reservoirs) by damming rivers. Large changes in climate can result in major changes in a lake’s size. As Earth was coming out of the last Ice Age about 15,000 years ago, the climate in the western U.S. changed from cool and moist to warm and arid, which caused more than 100 large lakes to disappear. The Great Salt Lake in Utah is a remnant of a much larger lake called Lake Bonneville.

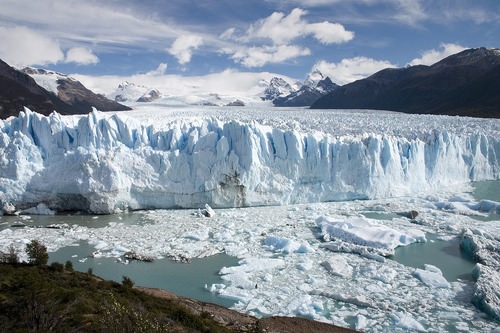
Surface Water Resources: Glaciers

Mountain Glacier in Argentina
Figure 8. Mountain Glacier in Argentina Glaciers are the largest reservoir of fresh water but are not used much as a water resource directly by society because of their distance from most people. Source: Luca Galuzzi – www.galuzzi.it
Although glaciers represent the largest reservoir of fresh water, they generally are not used as a water source because they are located too far from most people (Figure 8). Melting glaciers do provide a natural source of river water and groundwater. During the last Ice Age, there was as much as 50% more water in glaciers than there is today, which caused sea level to be about 100 m lower. Over the past century, the sea level has risen partly due to melting glaciers. If Earth’s climate continues to warm, the melting glaciers will cause an additional rise in sea level.

Groundwater Resources

Although most people worldwide use surface water, groundwater is a much larger reservoir of usable fresh water, containing more than 30 times more water than rivers and lakes combined. Groundwater is a particularly important resource in arid climates, where surface water may be scarce. In addition, groundwater is the primary water source for rural homeowners, providing 98% of that water demand in the U.S.

Porosity and Permeability

Groundwater is water located in small spaces, called pore space, between mineral grains and fractures in subsurface earth materials (rock or sediment). Different rocks and sediments have different amounts of pore space in them. The porosity of a material is a measure of the percentage or amount of pore space compared to the total volume of rock or sediment.


Diagram as described in the figure caption
Figure 9. Simplified diagram demonstrating porosity of various unconsolidated sediments and rocks. In all diagrams blue represents pore space that could be filled by water. Top Row is unconsolidated sediments. Well sorted gravels (left), sands (second from left), and silts/clays (second from right) all have high porosity while glacial till (right) is poorly sorted and has lower porosity because of the wide range of grain sizes. Bottom Row shows rocks. Left: Sandstone has lower porosity than unconsolidated sand as the cement (shown in yellow) holding the sand grains together fills in some of the pore space. Middle: Crystalline rocks have low to no porosity as the mineral grains grow together and fill in open spaces as these rocks form. Right: Fracturing rocks creates porosity even in crystalline rocks that would otherwise have none. The porosity created by fracturing will range from low to high depending on the amount of fracturing. Source: Lindsay Iredale (2024). CC BY-4.0.


Bar graph showing porosity of various materials. Porosity of Unconsolidated materials: Glacial till: 10 - 20%. Gravel: 25 - 40%. Sand: 30 - 50%, Silt and Clay: 35 - 70%.Rocks: cemented sedimentary rocks: 0 - 30% depending on level of sediment sorting and amount of cement. Limestone (crystalline sedimentary rock) without caves: 0 - 20%. Limestone with caves: 0 - 50%. Intrusive Igneous and metamorphic rocks: 0 - 10% depending on level of fracturing. Volcanic rocks: 0 - 50% depending on level of fracturing.
Figure 10. Variations in porosity of unconsolidated sediments (in red) and rocks (in blue). General trends to note are rocks have lower porosity than sediments; sedimentary rocks that are poorly sorted and have lots of cement have lower porosity than the same rock type if it is well sorted and with less cement; and unfractured rocks have lower porosity than the same rock if fractured. Limestone is a crystalline sedimentary rock. Intrusive igneous and metamorphic rocks have tightly interlocked mineral grains whereas volcanic rocks are much more likely to contain air bubbles which increases porosity. Source: Steve Earle (2015). CC BY-4.0. Found here.

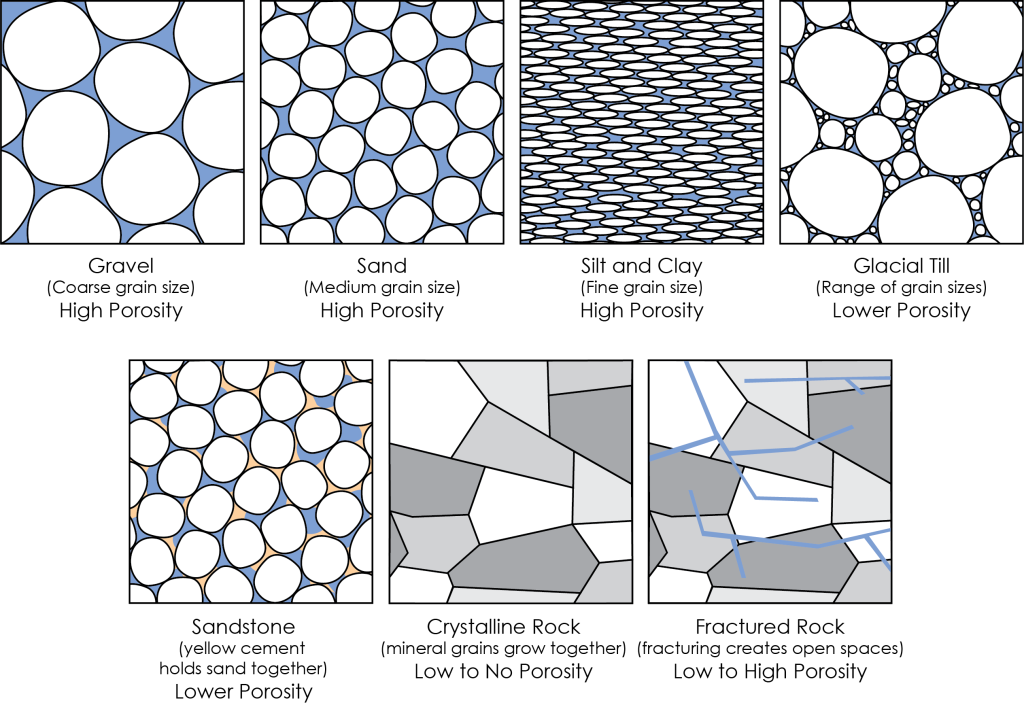
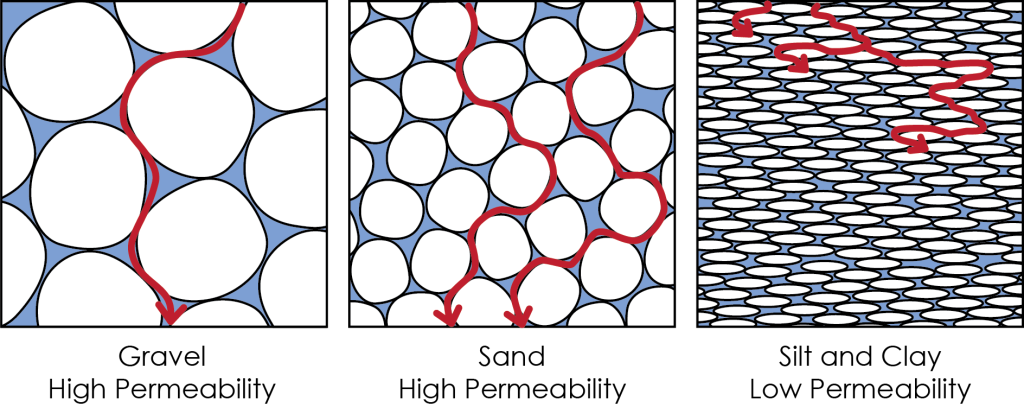
Just because a rock or sediment can hold a lot of water (i.e., has high porosity) does not mean the water can easily flow through the rock. The ability of water to flow through the rock is called permeability. Permeability is a measure of the size and how well connected the pore space in a rock or sediment is and therefore how easily water can move from one pore space to the next.

Smaller pores (not sediment size!) typically mean more twists and turns for the water to have to flow-through which impedes its ability to flow, and if the pore space is not connected at all, then there is not an available path to get through the material. Permeable materials have a greater number of larger, well-connected pores spaces, whereas low permeability (low connectivity and flow) or impermeable (no connectivity or flow) materials have fewer, smaller pores that are poorly (or not) connected.


Three cartoon diagrams of high permeability gravel, high permeability sand, and low permeability silt and clay. Red arrows show possible flow paths of water through these materials as described in the figure caption.
Figure 11. Simplified diagram demonstrating permeability in gravel, sand, and silt/clay. Gravels have high permeability with well-connected large pore spaces that allow water to take a reasonably straight path through (red line). Sands also have high permeability with well-connected pore space; however, the pore space is smaller, and the path water needs to take is more curved than in gravel. So, while permeability is still high, it is not as high as gravel. Silts and clays have much lower permeability. The small size of the pore space and packing of the fine silt and clay grains means the pore space is not as well connected and water does not easily flow through these materials as shown by the red line getting “stuck” as water works to find a path through. Source: Lindsay Iredale (2024). CC BY-4.0

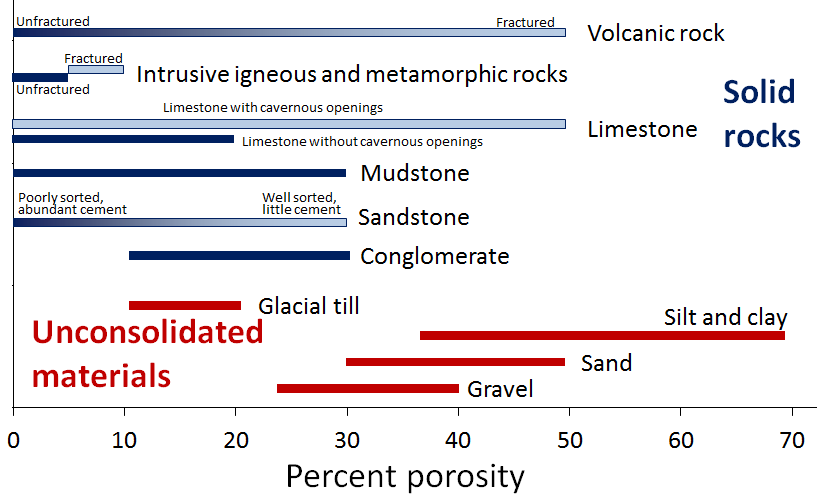
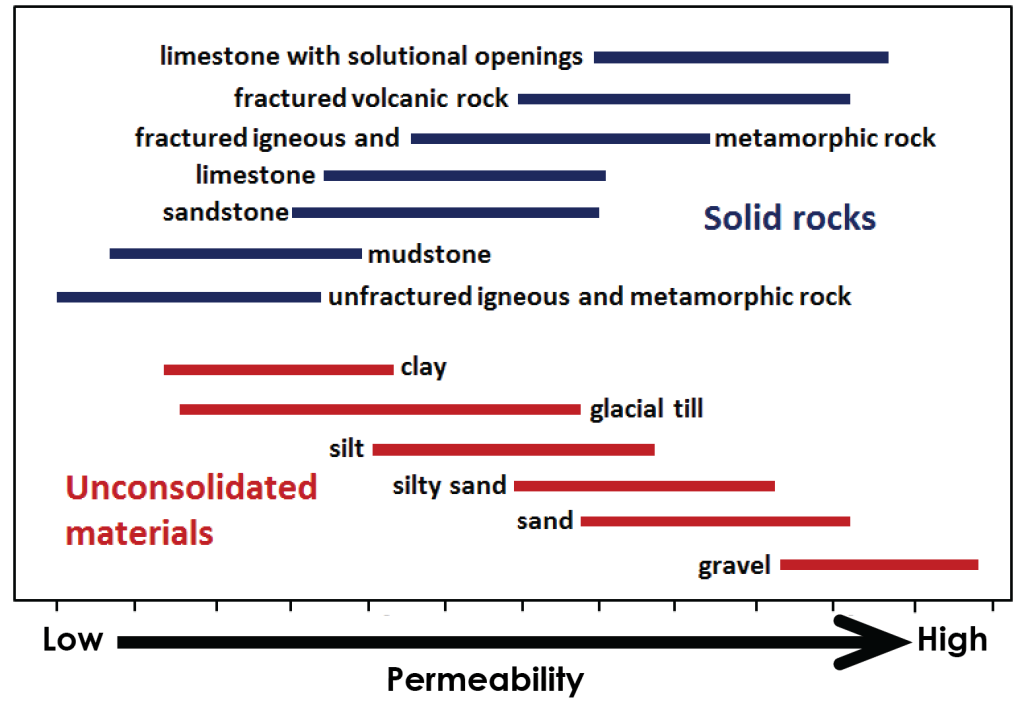
Relative permeabilities are shown in Figure 12 below. Permeabilities of rocks are shown in blue and unconsolidated sediments are shown in red. Some sediments like gravel and sand have high porosity (Figure 9) and high permeability. Other sediments like clay have high porosity but very low permeability. Fractured igneous and metamorphic rock has low porosity but can have quite high permeability! This means that the fracturing may not make a lot of open space in these rocks, but the open space it does make is very well connected.


Bar graph illustrating variations in permeability for unconsolidated materials and rocks. Permeabilities are as follows:Solid rocks: Limestone with solution openings: medium high to very high fractured volcanic rock: medium high to very high, slightly less permeable than limestone with solution openings fractured igneous and metamorphic rock: medium to high limestone: medium low to medium high sandstone: medium low to medium high, very slightly less permeable than limestone mudstone: low to medium unfractured igneous and metamorphic rocks: low to medium, slightly less permeable than mudstone Unconsolidated materials: clay: low to medium, more permeable than mudstone but less than sandstone glacial till: low to medium high, low end is about the same as clay, high end is about like silt silt: medium to medium high silty sand: medium to medium high sand: medium to high, more permeable than silty sand gravel: high to very high, most permeable of all the rocks or unconsolidated materials.
Figure 12. Variations in permeability of unconsolidated materials (in red) and of rocks (in blue). Source: Adapted from Steven Earle (2015). CC BY-4.0. Found here.

Water Table, Aquifers, and Aquicludes

Most groundwater originates on the surface as rain or snowmelt, infiltrating the ground and moving downward. As water travels downwards, it is moving through an area of rock or soil where the pore space is broadly filled with air. This is the unsaturated zone. Water continues to move downwards until it reaches rock and sediment where all the pore space is filled with water. This is the saturated zone.


Cross section view to see the layers below the ground surface. precipitation falls on the ground where it can infiltrate (flow down into the ground) to become groundwater (this movement is shown with arrows going from the surface down towards the water table). There is a layer on the surface through which the water infiltrates that is above the water table - this is the unsaturated zone. Below the water table is the saturated zone. A thin zone in the unsaturated zone, just on top of the water table has some water in the pore space (but not completely saturated) and this is the capillary fringe.
Figure 13. Simplified diagram showing the relationship between the unsaturated zone, saturated zone, and water table. The ground above the water table is the unsaturated zone (beige area) and may be wet, but it does not stay saturated. The water table is indicated by a solid horizontal line with an upside-down triangle. Below the water table is the saturated zone (dark blue area) where the pore space is filled with water. The capillary fringe (light blue zone) is a slightly wet, but not saturated, zone between the unsaturated and saturated zones. Water moves from the surface to the saturated zone through infiltration. Source: Lindsay Iredale (2024). CC BY-4.0. Adapted and simplified from USGS. Public Domain. Found here.

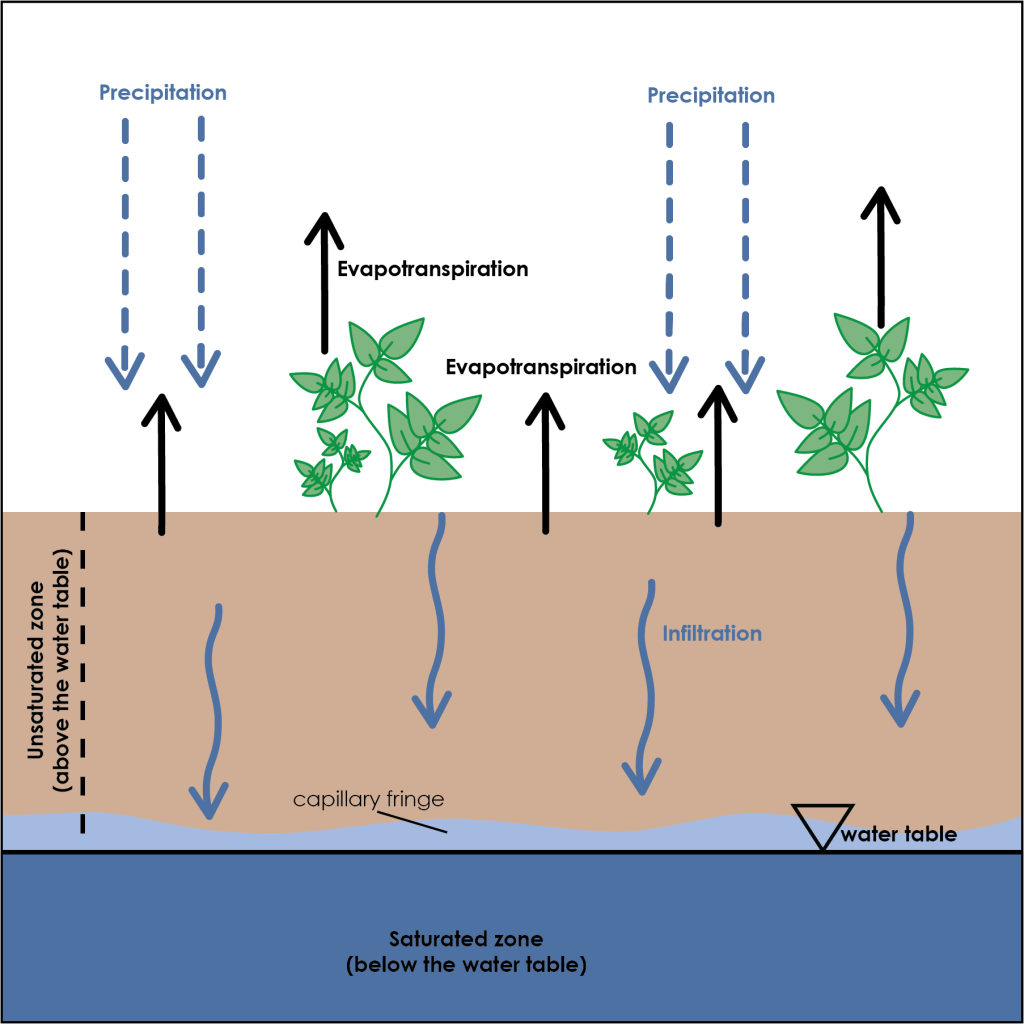
The surface of the saturated zone is called the water table. It is the boundary between the unsaturated and saturated rocks and sediments. Note there is a small zone on top of the water table where the rock and sediment are neither fully saturated nor unsaturated. This is the capillary fringe, and it is the transition from the unsaturated to saturated zones. The water table is located at the base of the capillary fringe.

As water works its way below the water table, it will collect and flow differently in different rock and sediment types based on their porosity and permeability. The name for a body of rock or sediment that has high porosity and high permeability is an aquifer. This is the rock or sediment a groundwater well is put into. Unconsolidated materials like gravel and sand, and rocks like sandstone make good aquifers. Other rocks can be good aquifers if they are well fractured. Aquifers are commonly drilled, and wells are installed to provide water for agriculture and personal use.

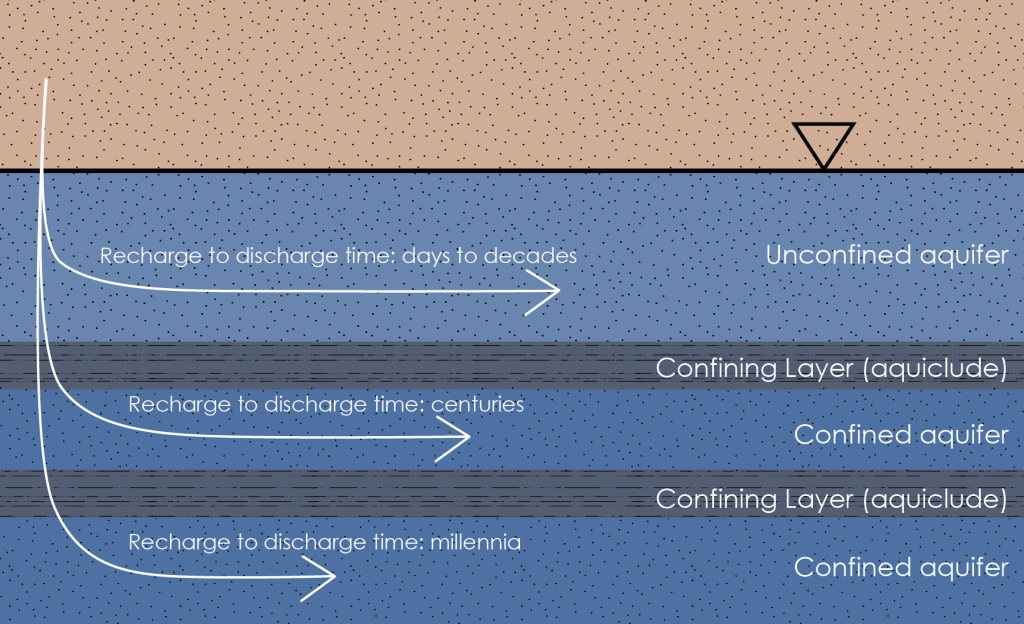
An aquiclude is a layer of impermeable geologic material that does not allow groundwater to flow through it. An aquifer where there is an aquiclude layer between it and the ground surface is called a confined aquifer, and the aquiclude separating it from the ground surface is known as the confining layer (Figure 14). Water in a confined aquifer can be pressurized. Artesian springs (natural) and artesian wells (manmade) occur where the water is pressurized enough that the water will push its way up to flow out at the ground surface through any available conduit (a fracture in the ground or a well pipe, respectively) without needing to be pumped.

An aquifer where the water table sits within the overall package or layer of rocks that make up the aquifer is called an unconfined aquifer. There is no aquiclude layer between an unconfined aquifer and the ground surface so the water within an unconfined aquifer is at atmospheric pressure. There can only be one unconfined aquifer but many confined aquifers at any location under the ground.

Geologic Diagram Symbols:

Geologists use stippled dot patterns for sands and gravels and narrow horizontal lines for silts and clays. The symbol for the water table is an upside-down triangle.

Cross section diagram showing layers below the ground. The top layer is a thick sandy layer and about halfway down through it is the water table, so the sandy layer is dry on the top half (unsaturated zone) and filled with water on the bottom half (saturated zone). This saturated zone just below the water table is labeled "unconfined aquifer" and has an arrow indicating water flowing in it labeled "recharge to discharge time: days to decades" The next layer down is a shale layer labeled "confining layer (aquiclude)". Below this is another sandy layer labeled "confined aquifer" and an arrow showing water flow labeled "recharge to discharge time: centuries". Below this is another shale layer labeled "confining layer (aquiclude)". The bottom layer is another sandy layer labeled "confined aquifer" with a water flow arrow labeled "recharge to discharge time: millennia".
Figure 14. Simplified diagram demonstrating the relationship of an unconfined aquifer with confined aquifers and confining layers (aquicludes). Aquifer material is shown in a stippled sand pattern and aquiclude material is shown as a horizontal lined pattern. The water table sits within the topmost layer of sandy material on top of the unconfined aquifer and the saturated zone is in shades of blue. Note there is no confining layer between the unconfined aquifer and the ground surface. Groundwater can flow into and through an unconfined aquifer in less time than into and through deeper confined aquifers. Source: Lindsay Iredale (2024). CC BY-4.0.


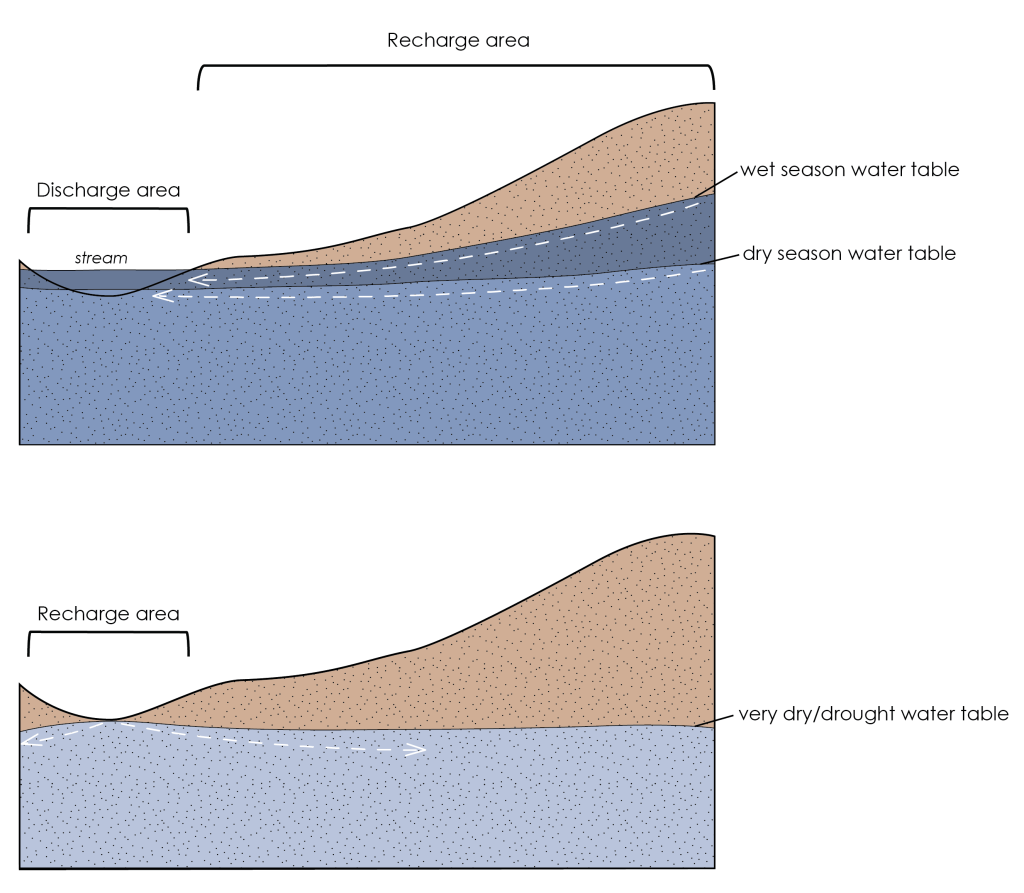
In addition to precipitation infiltrating from the surface, other groundwater sources include seepage from surface water (lakes, rivers, reservoirs, and swamps), surface water deliberately pumped into the ground, irrigation, and underground wastewater treatment systems (septic tanks). Water infiltrates down to the aquifer where it flows as groundwater, this is called groundwater recharge (the water is recharging or refilling the groundwater). Recharge areas are locations where surface water infiltrates the ground, rather than running into rivers or evaporating. Wetlands, for example, are excellent recharge areas. Eventually groundwater will flow to an area where it will discharge back into surface water or the ocean (the water is discharging or leaving the ground). 


Both diagrams from left to right: cross section view of stream valley up to a hilltop with unsaturated and saturated zones indicated as beige and blue layers, respectively. Top: stream is discharge area, hillslope is recharge area. Water table is higher during wet season and lower during dry season, but both have flow from hill (recharge) to stream (discharge). Bottom: stream is now a recharge area. Water table has dropped very low during drought conditions making the water table elevation under the stream the highest water table so groundwater now flows from the stream area out into the rest of the groundwater making the stream area a recharge area.
Figure 15. Diagram illustrating recharge and discharge areas and fluctuations of water table elevations. White arrows indicate groundwater flow direction. Top: The recharge area is the hillslope, and the discharge area is the stream valley, with water flowing from recharge to discharge areas. The water table is high during wet season conditions and drops lower during dry season conditions. Bottom: Water table drops very low during drought conditions making it highest underneath the stream. This turns the stream area into a recharge area. Source: Lindsay Iredale (2024). CC BY-4.0

The flow rate of groundwater is very slow compared to surface water. It ranges from a foot per day at the fast end down to a foot per year or even a foot per decade depending on the permeability of the material it is flowing through. To put this in comparison, an average river flow is in the range of 1-3 feet per second (over 16 miles per day). This means the time that water spends in the ground from recharge to discharge can be very long. Groundwater that flows through the surface unconfined aquifer will spend the least amount of time underground, anywhere from days to decades. Groundwater that travels into deeper confined aquifers can spend much longer underground, anywhere from centuries to millennia before discharging (Figure 14).

Discussion:

  • Rivers that have had international disputes over water supply include Colorado (Mexico, southwest U.S.), Nile (Egypt, Ethiopia, Sudan), Euphrates (Iraq, Syria, Turkey), Ganges (Bangladesh, India), and Jordan (Israel, Jordan, Syria).
  • In the upper Midwest of the U.S., specifically in the Red River of the North basin, watershed districts and water resource districts are local government agencies which have been created in Minnesota and North Dakota (respectively) to help minimize water disputes between landowners and land managers. With the Red River flowing northward into Manitoba, Canada, the International Joint Commission works to coordinate management of such waterways between the Canada and U.S.
  • Research other water volume challenges and disputes, such as:
    • White Bear Lake, MN: https://www.mprnews.org/story/2017/08/30/judge-rebukes-dnr-white-bear-lake-levels 
    • Why does the Red River of the North flood so often? What are the causes? What have been some significant flooding events on this river? What is being done to address flooding and the causes and effects of floods?
    • The Ogallala Aquifer of the U.S. Great Plains
    • The history of water resource management in Los Angeles, including Lake Mead and the Colorado River

Attribution:

Portions of this section are cloned from:

  • Introduction to Environmental Sciences and Sustainability, by Emily P. Harris, University of West Florida, published using Pressbooks, under a CC BY (Attribution) license.
  • Environmental Geology, by Lindsay J. Iredale, Normandale Community College, published using Pressbooks, under a CC BY-NC.SA 4. (Attribution-NonCommercial-ShareAlike 4.0 International; https://creativecommons.org/licenses/by-nc-sa/4.0/)

Media Attributions

  • recharge-discharge-areas-1024×893
  • hydrograph_cgi
  • Private: drainage basins
  • Private: porosity © Lindsay Iredale is licensed under a CC BY (Attribution) license
  • Private: Permeability © Lindsay Iredale is licensed under a CC BY (Attribution) license
  • Private: Permeability from Earle
  • Private: saturated unsaturated water table
  • Private: confined and unconfined1
  • Private: recharge discharge areas

License

Icon for the Creative Commons Attribution 4.0 International License

7.3 Freshwater Supply Copyright © by Bill Freedman; Brent Silvis; Emily P. Harris; and Lindsay Iredale is licensed under a Creative Commons Attribution 4.0 International License, except where otherwise noted.