10 Ch. 10 The Nature and Extent of Crime
Shanell Sanchez and Jeff Bry
Ch. 10
Nature and Extent of Crime
Introduction
When we discuss crime, we generally discuss what is known through official channels (UCR, NIBRS, NCVS). What is equally compelling is the amount of crime we don’t know about, as many crimes that occur are not reported to law enforcement. Some items may be minor, and people do not think it is worth the trouble to report, or perhaps they feel the loss is their own fault and they won’t get the item back (stolen bike for example). These items contribute to something known as the “dark” or hidden figure of crime.
Dark or Hidden Figure of Crime
Shanell Sanchez
https://openoregon.pressbooks.pub/ccj230/chapter/2-1-dark-figure-of-crime-or-unreported-crime/
It is difficult to determine the amount of crime that occurs in our communities every year because many crimes never come to the attention of the criminal justice system. There are various reasons that will be discussed, such as victims not reporting, victims not realizing they are victims, and offenders not getting caught. Research reveals, that on average, more than half of the nation’s violent crimes, or nearly 3.4 million violent victimizations per year, went unreported to the police between 2006 and 2010, according to a new report published by the Bureau of Justice Statistics (BJS). [1] Because of this underreporting of crime, criminologists often refer to a concept known as the dark figure of crime.

Picture from pixabay.com
There are three general sources of crime statistics that will be covered in this chapter: official statistics, which we often describe as reported statistics, self-report statistics, and victimization statistics. Each of these sources of crime statistics has pros and cons, and we will spend time discussing those as well. Additionally, we will discuss the importance of looking at crime trends over time, relying upon statistics and research when developing policy, and how data should be a tool that enhances the criminal justice system.
If we have accurate and reliable crime statistics, we can evaluate criminal justice policies and programs. For example, we could use crime statistics to see if incarcerating drug offenders is effective. Such effectiveness is studied in the correctional system via the ‘risk principal,’ or classifying people based on the level of risk. https://heinonline.org/HOL/LandingPage?handle=hein.journals/fedsen27&div=37&id=&page=
Relying on official statistics can be problematic to grasp a correct understanding of crime in society because many crimes never even come to the attention of the criminal justice system. Official statistics are often the crimes that are known or reported to police or others. It may seem shocking that people do not report crimes, but it is more common than we think. Let us take the example of looking at the gap between reported and unreported crimes.
Dark Figure of Crime Example
My father-in-law grew up in a small town in South Dakota. When his family moved to Colorado, they still had a rural mindset to their property. They often think people should not touch other people’s things, so there is no need to lock up their house, car, or other property. He leaves his vehicle, house, and garage unlocked in Colorado because of that mindset. However, they live in a large, populous part of Colorado in a suburb outside Denver. Most people do not know the neighbor three doors down. One morning he woke up to his truck gone! The first thing he did was realize he left the keys in the truck and the truck was unlocked (normal to him). Next, he decided to take a walk to look for it before phoning the police. He located the truck, and it was damaged. It appeared that kids took it for a joy ride, as evidence from the beer cans and odor. He chose not to call the police. Why? He was happy the property had was located, yet he believed ‘it was his fault,’ and he had to get to work. Is this type of reaction more common than we may think?

Picture from pixabay.com
A friend of mine was a victim of domestic violence for over nine months and never told anyone, especially the police. Her boyfriend was only presented as perfect, loving, and romantic on social media and around people. When she did come forward, it was after she landed in the emergency room due to him assaulting her. People may initially think domestic violence victims would always call the police, but there are so many reasons people do not come forward.
When victims of crime do not report, or police are not made aware of a crime these crimes go uncounted in the official statistics. They become part of the ‘dark figure of crime‘ that we will learn about throughout this section. [2]
Some Reasons People May Not Report [3]
1. The victim may not know a crime occurred
2. The offender is a member of the family, a friend, or an acquaintance
3. The victim thinks it is not worth reporting
4. The victim may fear retaliation
5. The victim may also have committed a crime
6. The victim does not trust the police
Bureau of Justice Statistics. (2012). Nearly 3.4 million violent crimes per year. https://www.bjs.gov/content/pub/press/vnrp0610pr.cfm ↵
Biderman, A., & Reiss, A. (1967). On exploring the “dark figure of crime.” The Annals of the American Academy of Political and Social Science. 374(1), 1–15. https://doi.org/10.1177/000271626737400102 ↵
Brantingham, P., & Brantingham, P. (1984). Patterns in Crime, New York: Macmillan. ↵

Picture from pixabay.com
Official Statistics
Shanell Sanchez
https://openoregon.pressbooks.pub/ccj230/chapter/2-2-official-statistics/
Despite being aware that crime does go unreported, it is still important to estimate and attempt to measure crime in the country. However, it is essential always to be aware of the data sources strengths and weaknesses when reading crime statistics. Also, be cautious of how changing data collection techniques may alter statistics. For example, if a survey never collected data on prescription drug abuse but then all of a sudden does it could seem like prescription drugs are being abused at high rates. However, it is most likely just because it is the first time the questions got asked and there are no comparison groups.
Official statistics are gathered from various criminal justice agencies, such as the police and courts, and represent the total number of crimes reported to the police or the number of arrests made by that agency. Remember, if an officer uses discretion and does not arrest a person, even if a crime was committed, this does not get reported.
The Federal Bureau of Investigation’s (FBI’s) Uniform Crime Reports (UCR) is the largest, most common data on crime currently available. The UCR lists the number of crimes that were reported to the police and the number of arrests made. The link below can take you to the UCR homepage https://www.fbi.gov/services/cjis/ucr.
The UCR Program’s primary objective is to generate reliable information for use in law enforcement administration, operation, and management. Various groups and agencies rely upon the UCR crime data, such as law enforcement executives, students, researchers, the media, and the public at large seeking information on crime in the nation. [1] The UCR began in 1929 by the International Association of Chiefs of Police to meet the need for reliable uniform crime statistics for the nation. In 1930, the FBI was tasked with collecting, publishing, and archiving those statistics. Every year there are four annual publications produced from data received from more than 18,000 city, university and college, county, state, tribal, and federal law enforcement agencies voluntarily participating in the program. [2]
The UCR Program consists of four data collections: The National Incident-Based Reporting System (NIBRS), the Summary Reporting System (SRS), the Law Enforcement Officers Killed and Assaulted (LEOKA) Program, and the Hate Crime Statistics Program. The UCR also publishes special reports on Cargo Theft, Human Trafficking, and NIBRS topical studies. The UCR Program will manage the new National Use-of-Force Data Collection.
National Incident-Based Reporting System, or NIBRS
The National Incident-Based Reporting System, or NIBRS, was created to improve the overall quality of crime data collected by law enforcement. NIBRS is unique because it collects data on crimes reported to the police, but also incidents where multiple crimes are committed, for example when a robbery escalates into a rape. [3] NIBRS also collects information on victims, known offenders, relationships between victims and offenders, arrestees, and property involved in the crimes. See the link to go directly to NIBRS https://www.fbi.gov/services/cjis/ucr/nibrs
Hate Crime Statistics
Congress passed the Hate Crime Statistics Act, 28 U.S.C. § 534, on April 23, 1990. This required the attorney general to collect data “about crimes that manifest evidence of prejudice based on race, religion, sexual orientation, or ethnicity.” Hate crime statistics may assist law enforcement agencies, provide lawmakers with justification for certain legislation, provide the media with credible information, or simply show hate crime victims that they are not alone (FBI, 2018). See the link to go to the FBI’s hate crime statistics link https://www.fbi.gov/services/cjis/ucr/hate-crime.
The FBI UCR Program’s Hate Crime Data Collection gathers data on the following biases:
Race/Ethnicity/Ancestry
Anti-American Indian or Alaska Native
Anti-Arab
Anti-Asian
Anti-Black or African American
Anti-Hispanic or Latino
Anti-Multiple Races, Group
Anti-Native Hawaiian or Other Pacific Islander
Anti-Other Race/Ethnicity/Ancestry
Anti-White
Religion
Anti-Buddhist
Anti-Catholic
Anti-Eastern Orthodox (Russian, Greek, Other)
Anti-Hindu
Anti-Islamic
Anti-Jehovah’s Witness
Anti-Jewish
Anti-Mormon
Anti-Multiple Religions, Group
Anti-Other Christian
Anti-Other Religion
Anti-Protestant
Anti-Atheism/Agnosticism/etc.
Sexual Orientation
Anti-Bisexual
Anti-Gay (Male)
Anti-Heterosexual
Anti-Lesbian
Anti-Lesbian, Gay, Bisexual, or Transgender (Mixed Group)
Disability
Anti-Mental Disability
Anti-Physical Disability
Gender
Anti-Male
Anti-Female
Gender Identity
Anti-Transgender
Anti-Gender Non-Conforming
The types of hate crimes reported to the FBI are broken down by specific categories. The aggregate hate crime data collected for each incident include the following:
Incidents and offenses by bias motivation: Includes crimes committed by and against juveniles. Incidents may include one or more offense types.
Victims: The types of victims collected for hate crime incidents include individuals (adults and juveniles), businesses, institutions, and society as a whole.
Offenders: The number of offenders (adults and juveniles), and when possible, the race and ethnicity of the offender or offenders as a group.
Location type: One of 46 location types can be designated.
Hate crime by jurisdiction: Includes data about hate crimes by state and agency.
Law Enforcement Officers Killed and Assaulted Program LEOKA
LEOKA provides data and training that helps keep law enforcement officers by providing relevant, high quality, potentially lifesaving information to law enforcement agencies focusing on why an incident occurred as opposed to what occurred during the incident, with the hope of preventing future incidents. [4]
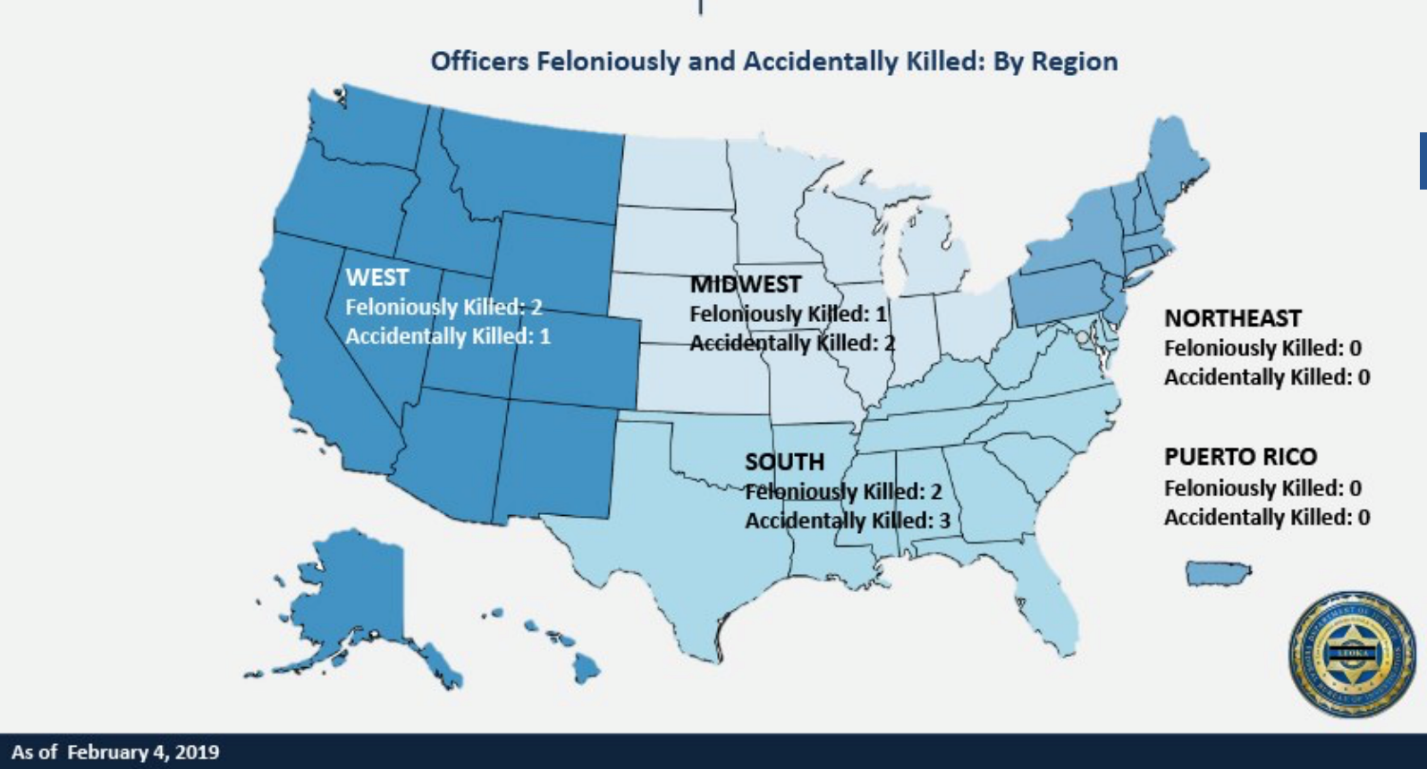 LEOKA Data
Exclusions from the LEOKA Program’s Data Collection
Deaths resulting from the following are not included in the LEOKA Program’s statistics:
Natural causes such as heart attack, stroke, aneurysm, etc.
On duty, but death is attributed to their own personal situation such as domestic violence, neighbor conflict, etc.
Suicide
Examples of job positions not typically included in the LEOKA Program’s statistics (unless they meet the above exception) follow:
Corrections/correctional officers
Bailiffs
Parole/probation officers
Federal judges
The U.S. and assistant U.S. attorneys
Bureau of Prison officers
Private security officers
All of these official statistics are a great starting point, although, recognize they are imperfect in nature. Police agencies can change their attention to certain events, which can change the overall number of arrests. For example, if police begin cracking down on domestic violence the statistics may go up. This crackdown can make it appear that the problem has increased, although it can be related to the crackdown. Just remember, if the crime is not reported, or no arrest is made it will not get captured in the data.
Bureau of Justice Statistics Exercise
The BJS is relatively user-friendly. Look at crime statistics by state, region, or city, and explore different years and crime types.
https://www.bjs.gov/index.cfm?ty=datool&surl=/arrests/index.cfm
Examine current state AND city crime trends in the past five years.
Second, pick a state AND city interested in living in and examine the crime trends for the past five years.
U.S. Department of Justice. (2017). UCR Reports ↵
U.S. Department of Justice. (2017). UCR Reports ↵
Rantala, R. R. (2000). Effects of NIBRS on crime statistics. Bureau of Justice Statistics Special Report. U.S. Department of Justice, Office of Justice Programs. Washington, DC. ↵
FBI (2017). https://www.fbi.gov/services/cjis/ucr/leoka ↵
Victimization Studies
Shanell Sanchez
https://openoregon.pressbooks.pub/ccj230/chapter/2-4-self-report-data/
Victimization studies attempt to fill in where police reports are missing by asking people if they have been a victim of a crime in a given year, reported or not. The National Crime Victimization Survey (NCVS) is the primary source of information on criminal victimization in the United States. The NCVS helps fill in gaps that the UCR and NIBRS cannot fill in because that data is only crimes known to police. Every year the U.S. Census Bureau administers the survey and gathers data on frequency, characteristics, and consequences of criminal victimization from approximately 135,000 households, composed of nearly 225,000 persons. The NCVS collects information on nonfatal personal crimes (i.e., rape or sexual assault, robbery, aggravated and simple assault, and personal larceny) and household property crimes (i.e., burglary, motor vehicle theft, and other theft) both reported and not reported to police. [1] It is important to help fill in the gap of the dark figure of crime previously discussed.
The NCVS collects information on age, sex, race and Hispanic origin, marital status, education level, and income, and whether they experienced victimization. Additionally, the NCVS collects information about the offender about age, race and Hispanic origin, sex, and victim-offender relationship, characteristics of the crime (e.g., time and place of occurrence, use of weapons, nature of injury, and economic consequences), whether the crime get reported to police, reason(s) the crime was or do not get reported, and victim experiences with the criminal justice system. [2] See the link below to explore the NCVS https://www.bjs.gov/index.cfm?ty=dcdetail&iid=245
See the report below on findings of repeat victimization from the NCVS: https://www.bjs.gov/index.cfm?ty=pbdetail&iid=6046
NCVS Exercise
Go to the NCVS page and use the analysis tool that allows you to examine the National Crime Victimization Survey (NCVS) data on both violent and property victimization. You can select the victim, household, and incident characteristics.
You can instantly generate tables with national estimates of the numbers, rates, and percentages of victimization from 1993 to the most recent year that NCVS data are available. The pre-set Quick Tables show you trends in crime and reporting to the police. If you would like more detail, use the Custom Tables analyze victimization by excellent characteristics.
https://www.bjs.gov/index.cfm?ty=nvat
As with any data source, there are challenges and limitations to victimization surveys. Respondents may have issues recalling victimization, which can lead to underreporting or overreporting. If an individual was traumatized the event may blur together, and it may have occurred in 2017 rather than 2018, but gets reported as 2018. Other times respondents may lie or omit information for various reasons such as shame, fear, confusion, and a lack of trust. If the respondent is uncomfortable with the interviewers, they may not want to tell them that their partner abused them, out of fear it will get reported to police. However, methodological techniques can attempt to minimize these challenges buy bounding to mitigate the chances of this happening. [3]
Bureau of Justice Statistics, Data Collection: National Crime Victimization Survey (NCVS) ↵
Bureau of Justice Statistics, Data Collection: National Crime Victimization Survey (NCVS) ↵
Lab, S., Holcomb, J., & King, W. (2013). Criminal justice: The Essentials. Oxford University Press: Oxford. ↵
Shanell Sanchez
https://openoregon.pressbooks.pub/ccj230/chapter/victimization-data/
Self-report statistics are stats that are reported by individuals. Self-report statistics get gathered when people are asked to report the number of times they may have committed a particular crime during a set period in the past, regardless of getting caught or not. For example, in-class students take a criminal activity checklist and report behaviors they have engaged in at some point in their lives. People should be honest since the data has no identifying information collected, and report even if no one ever found out what we find during class time it that all the students, for over eight years of teaching, have committed a crime. However, the amount of students that have to get caught is minimal, especially those that received formal sanctioning from the CJ system (funneling of crime).
Monitoring the Future is an ongoing study of the behaviors, attitudes, and values of American secondary school students, college students, and young adults. Each year, a total of approximately 50,000 8th, 10th, and 12th-grade students get surveyed (12th graders since 1975, and eighth and 10th graders since 1991). Besides, annual follow-up questionnaires are mailed to a sample of each graduating class for some years after their initial participation. The Monitoring the Future Study has been funded under a series of investigator-initiated competing research grants from theNational Institute on Drug Abuse, a part of the National Institutes of Health. MTF is conducted at the
Survey Research Center in the Institute for Social Research at theUniversity of Michigan.
Monitoring the Future Drug Use Amongst Teens
How do we get estimates on drug use amongst teens if most of them do not get caught? We rely on reports like the one above from the MTF. Monitoring the Future (MTF) is a long-term study of substance use among U.S. adolescents, college students, and adult high school graduates through age 60. The survey is conducted annually, which allows us to examine long term trends. MTF findings identify emerging substance use problems, track substance use trends, and inform national policy and intervention strategies. Respondents are confidential, which means we cannot link their answers to them. Therefore, people may be more likely, to tell the truth. [1]
In the Report: One Form of Drug Use Showed a Sharp Increase in Use in 2018
The most important findings to emerge from the 2018 survey is the dramatic increase in vaping by adolescents. Vaping is a relatively new phenomenon, so we are still developing measures related to this behavior, which included asking separately for the first time in 2017 about the vaping of three specific substances—nicotine, marijuana, and just flavoring. As the section on vaping in this monograph shows, there was a significant and substantial increase in 2018 in the vaping of all three of these substances, including some of the most substantial absolute increases MTF has ever tracked for any substance. Given that nicotine is involved in most vaping, and given that nicotine is a highly addictive substance, this presents a severe threat.[2]
Self-report statistics are great because they can help discover problems we were unaware of, such as vaping. Further, it helps us identify victimless crimes, or crimes to where there is no victim such as drug use, gambling, and underage drinking. Lastly, we uncover offenses that are not as serious such as shoplifting, which are less likely to be known to police. [3]
However, self-report data also has its limitations. Respondents may exaggerate or underreport their criminal behavior, for various reasons. For example, in the class activity we do, many students did not know what they did was illegal behavior until the statute was read, so they would never have thought they committed a crime. Lastly, if we do not capture a large sample, we may limit who gets the survey. If we are surveying kids in school about substance abuse, but not reaching out to all kids even if they get suspended, we may miss important data. [4]
Which Data Should We Use?
In each type of data (official, self-report, and victimization) there are pros and cons. Additionally, each source is more likely to produce a better picture of what is occurring depending on the area of study. If a person wanted to get the best statistics on reported homicides in the US, which source would be best? How about domestic violence? What if we were interested in finding out drug abuse rates amongst teens in high school?
“Correlates” of Crime
When examining criminal statistics, three major correlates of crime are found to be consistent across the spectrum of criminal behavior. While there are potentially a number of variables that may be correlated to crime, the variables age, gender and race are three that are consistently significant in terms of criminal behavior. We will examine the influence of each of the these variables in terms of criminal behavior, also in regards to predicting crime and criminal behavior.
Age
According to Hirschi and Gottfredson (1990), age is one of the “strongest” predictors and correlates of crime. Age has been shown to be somewhat consistent across cultures, national boundaries and even (to some extent) over time. The “age-crime curve” has been described as including young people ages 16-24, which are viewed as the “prime” ages to commission (and victimization) of crime. As brain development does not fully occur until the mid 20’s (primarily frontal lobe development), there is an argument young people do not make well reasoned choices before their mid 20’s. Onset of puberty has been cited as a reason for an uptick in negative choices and behaviors in pre-teen and early teenage years, however the age of 16 seems to trigger more significant risk of negative choices and behaviors. In terms of age, there are some significant trends regarding behavior:
- Bell-Shaped Curve: The curve is often bell-shaped, indicating a sharp increase in criminal activity during adolescence, peaking in the late teens, and then a decline as individuals enter adulthood.
- Universal Trend: This pattern is observed across different countries and historical periods, suggesting a consistent relationship between age and crime.
- Variations by Crime Type: The curve for violent crimes tends to peak later than that for property crimes.
- Gender Differences: Studies show that the curve peaks earlier for girls than for boys.
- Socioeconomic Factors: The curve is higher and wider for young males, especially minorities, growing up in disadvantaged neighborhood.
Gender
In terms of official statistics, males consistently commit more crime than females. Males are also victimized at a higher rate than females, except in areas of domestic violence and some types of physical assault and sexual violence. While males appear to be more criminogenic than females, there are theories (as discussed in a previous chapter regarding Feminist criminology) that this may be in part due to systemic sexism in our criminal justice system. When studying gender and crime, there are complex societal issues to consider to more fully understand the relationship between these variables. Trends identified between gender and crime include:
- Gender Gap in Crime: Women are consistently less likely than men to commit criminal acts. This gap is observed across various types of crimes and different cultural contexts.
- Types of Crimes: Men are more likely to be involved in violent crimes, while women are more often associated with property crimes and offenses related to family and relationships.
- Biological Factors: Research suggests that biological differences, such as lower resting heart rates in men, may partially mediate the relationship between gender and criminal behavior.
- Social and Cultural Influences: Gender roles, societal expectations, and cultural norms significantly influence criminal behavior. Women’s criminal activities are often shaped by their social environment and relationships.
- Victimization: Women are more likely to be victims of certain types of crimes, such as domestic violence and sexual assault, which also impacts their involvement in criminal activities.
Race
Race and crime is an area of significant discussion and debate in the arena of criminal justice and criminology. There does appear to be a relationship between race and crime, some individual races commit crime (and are victimized) at a higher rate, other races commit crime and are victimized at a lower rate. To add to the confusion, adding socio economic variables into the discussion, in many studies the “racial effect” seems to go away. Spawning conversation of class and poverty being far more important variables to examine, as opposed to any racial effect. However, race has been something that has been studied to decades, and continues to be examined as a major correlate of crime. Some important findings regarding race include:
- Disproportionate Representation: Certain racial and ethnic groups are disproportionately represented in crime statistics and the criminal justice system. For example, African Americans and Hispanics are more likely to be arrested, convicted, and incarcerated compared to their white counterparts.
- Socioeconomic Factors: Socioeconomic disparities, including poverty, education, and employment opportunities, significantly contribute to the higher crime rates observed in minority communities.
- Racial Profiling: Practices such as racial profiling by law enforcement can lead to higher arrest rates for minority groups, further exacerbating the disparities in crime statistics.
- Victimization: Minority groups are also more likely to be victims of certain types of crimes, such as violent crimes, which can perpetuate cycles of crime and victimization within these communities.
Gottfredson, M. R., & Hirschi, T. (1990). A general theory of crime. Stanford University Press.
Hindelang, Hirschi, & Weis, (1981). Measuring delinquency. Thousand Oaks, CA: Sage Pubs. ↵
Johnston, L.D., Miech, R.A., O’Malley, P.M., Bachman, J.D., Schulenberg, J.E., & Patrick, M.E. (2018). MTF. 2018 Overview Key Findings on Adolescent Drug Use ↵
Johnston, L.D., Miech, R.A., O’Malley, P.M., Bachman, J.D., Schulenberg, J.E., & Patrick, M.E. (2018). MTF. 2018 Overview Key Findings on Adolescent Drug Use ↵
Lab, S., Holcomb, J., & King, W. (2013). Criminal justice: The Essentials. Oxford University Press: Oxford. ↵
Shanell Sanchez
https://openoregon.pressbooks.pub/ccj230/chapter/2-3-challenges-with-crime-measurement/
Genocide: Misuse of Statistics Exercise
The misuse of statistics promotes crime myths and generates fear of crime. There are various ways that we can misuse statistics, such as limiting public access to critical information, intending to mislead the public by presenting false information, or using deceptive formats to present information. [1]
Exercise: Find a news article that demonstrates an apparent misuse of statistics for a crime OR an article that demonstrates that people are trying to get release accurate and reliable information about a crime. Specifically, discuss how it is a misuse of statistics or not and why that particular article was picked in 500 words.
For example, the article I found is about the genocide in Myanmar. The article is titled, “What is happening in Myanmar is genocide. Call it by its name” in the Washington Post. For a long time, no one referred to this crime as a genocide, and there were deliberate attempts by the government in Myanmar and the world to not refer to it as genocide. Despite visual evidence that a genocide was occurring, the government tried to deny it. The news said, “NO MORE. Call it what it is.”
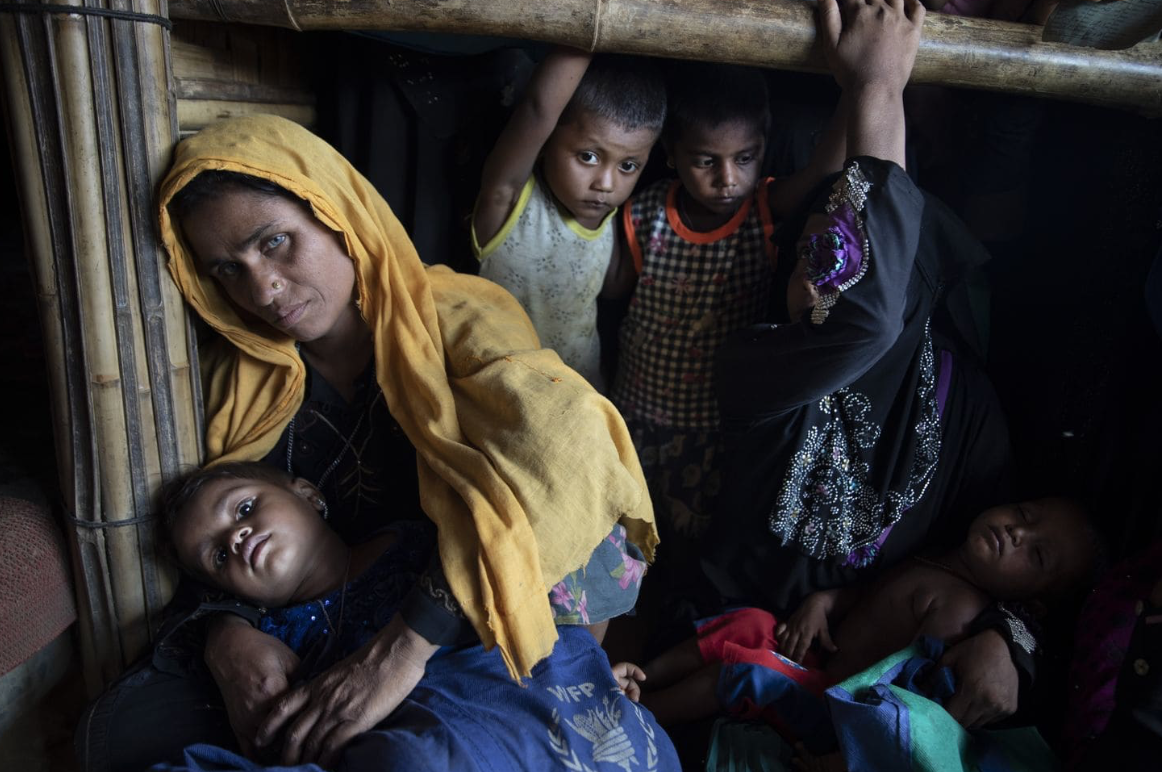 Genocide of Rohingya families
Watch the video link embedded at the top of the CNN news clip where the Monks say the international community is wrong and it is not genocide. However, the United Nations took a stance by calling it genocide and calling for the end of it. https://www.cnn.com/2017/11/25/asia/myanmar-buddhist-nationalism-mabatha/index.html
Misusing statistics can happen all the time, and sometimes it is intentional, others accidental. When we think back to the example of my grandfather, he would just cite stats out of nowhere. However, he had never really studied any of the issues and his sources were unreliable. As a child, I often wondered how he knew this? He did not intend to spew inaccurate facts but accidentally did to us because he listened to someone who thought they had knowledge. This happens often when people give ‘opinions’ without facts, which they are merely opinions. It is important to be able to distinguish this.
Kappler, V., & Potter, G. 2018. The Mythology of Crime and Criminal Justice (5th ed.). Waveland Press, Inc: Long Grove. ↵
Chapter Summary
This chapter analyzes and nature and extent of crime, including the “dark figure” of crime and various measures of crime. As we examine and discuss the dark figure of crime, we come to realize there are aspects of crime we cannot accurately measure. While we do have a variety of methods of reporting and measuring crime, this dark figure issue is pervasive in criminal justice causing issues with reported official statistics. Self-report and victimization research is often helpful, but still incomplete (even when coupled with official statistics) in fully describing the nature and extent of crime.
